MSFT next target is $500 but....
#MSFT is currently in #overbought territory, which may cause the price to #temporarily decline to the $425–$445 range.
The chart indicates the price is moving between two #inner trendlines.
However, MSFT has broken out of the bearish trend ( ran out of the fear), with the next potential targets
18.10 CAD
119.43 B CAD
332.15 B CAD
About Microsoft Corp.
Sector
Industry
CEO
Satya Nadella
Website
Headquarters
Redmond
Founded
1975
FIGI
BBG012TB8CX7
Microsoft Corp engages in the development and support of software, services, devices, and solutions. It operates through the following business segments: Productivity and Business Processes; Intelligent Cloud; and More Personal Computing. The Productivity and Business Processes segment comprises products and services in the portfolio of productivity, communication, and information services of the company spanning a variety of devices and platform. The Intelligent Cloud segment refers to the public, private, and hybrid serve products and cloud services of the company which can power modern business. The More Personal Computing segment encompasses products and services geared towards the interests of end users, developers, and IT professionals across all devices. The firm also offers operating systems; cross-device productivity applications; server applications; business solution applications; desktop and server management tools; software development tools; video games; personal computers, tablets; gaming and entertainment consoles; other intelligent devices; and related accessories. The company was founded by Paul Gardner Allen and William Henry Gates III in 1975 and is headquartered in Redmond, WA.

Microsoft - This might be the ultimate breakout!Microsoft - NASDAQ:MSFT - will break the all time high:
(click chart above to see the in depth analysis👆🏻)
If you wonder why Microsoft has been rallying +15% this month, market structure will give you an answer. In fact, the recent bullish break and retest was totally expected, and if we take

MSFT Weekly Options Play – 2025-06-09🧾 MSFT Weekly Options Play – 2025-06-09
Bias: Moderately Bearish
Timeframe: 5–6 days
Catalysts: Overbought RSI, weakening momentum, technical divergences
Trade Type: Single-leg put option
🧠 Model Summary Table
Model Direction Strike Entry Price Target Stop Loss Confidence
Grok Bearish 457.50P $0.76

MSFT Surges to Record High, Sustaining Bullish MomentumMicrosoft (MSFT) has demonstrated remarkable resilience, fully recovering from losses incurred during the tariff war sell-off. The stock has even achieved a new all-time high. This performance underscores the stock’s persistent bullish trend. The low recorded on April 7, 2025 likely serves as a robu

$MSFT Getting HighNASDAQ:MSFT is getting to a price where its a good idea to start trimming and/or taking profits as we should always have a plan before trading. Happy Friday

MICROSOFT - Simple Analysis WIN ! Its Bearish Ahead ! MAGIC Microsoft - Lets explore the magic of Technical Analysis / Price action.
Microsoft is currently testing the daily resistance level and it will be more matured once the bearish candle / rejection candle is formed. We see a bearish divergence at this level which is a strong confluence for the bearis


MSFT Holding Highs. Gamma & Structure Say Rejection Risk is Real🔍 MSFT GEX Daily Overview (Options Sentiment Breakdown)
Microsoft ( NASDAQ:MSFT ) closed at $460.36, right inside a tight zone between heavy call resistance at 462.5–465 and a weakening support floor at 450. The stock has been on a strong run, but we’re now entering a dealer-dense gamma zone — which

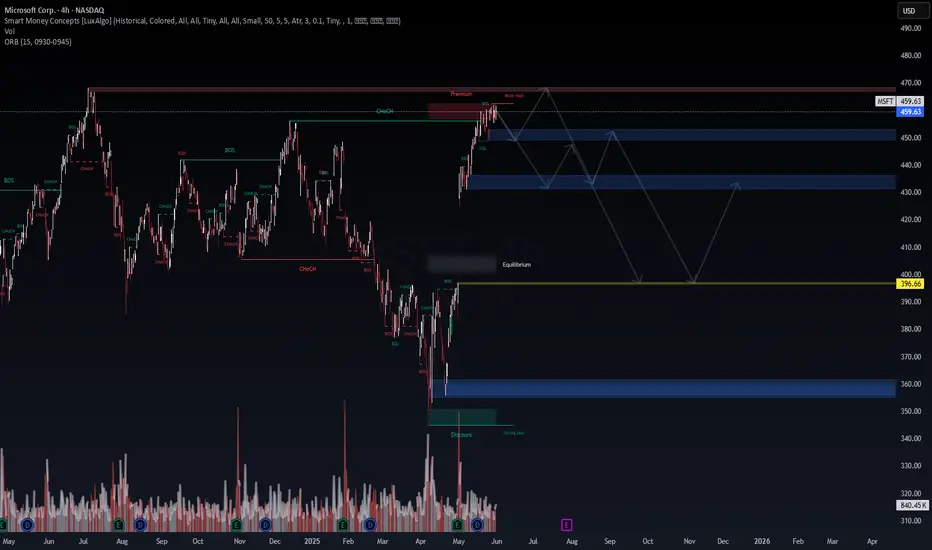
Microsoft Corp. (MSFT) – Smart Money Concepts | Liquidity Trap This chart outlines a high-probability liquidity run reversal setup driven by SMC principles. Price has reached Premium territory, sweeping the weak high and now showing signs of distribution.
🔍 Key Levels & Structure:
Current Price: $459.63
Premium Zone: $457–462 → Price swept weak high (liquidit
MSFT short, Broader Market Weakening.Weekly:
MFI divergence: Smart money flow pulling back while price pushes up — early warning sign of distribution.
Price touching upper Bollinger Band: Extended move on volatility basis; usually implies reversion risk, especially if paired with divergence.
Daily:
Overbought RSI: Price momentum overs

See all ideas
Summarizing what the indicators are suggesting.
Oscillators
Neutral
SellBuy
Strong sellStrong buy
Strong sellSellNeutralBuyStrong buy
Oscillators
Neutral
SellBuy
Strong sellStrong buy
Strong sellSellNeutralBuyStrong buy
Summary
Neutral
SellBuy
Strong sellStrong buy
Strong sellSellNeutralBuyStrong buy
Summary
Neutral
SellBuy
Strong sellStrong buy
Strong sellSellNeutralBuyStrong buy
Summary
Neutral
SellBuy
Strong sellStrong buy
Strong sellSellNeutralBuyStrong buy
Moving Averages
Neutral
SellBuy
Strong sellStrong buy
Strong sellSellNeutralBuyStrong buy
Moving Averages
Neutral
SellBuy
Strong sellStrong buy
Strong sellSellNeutralBuyStrong buy
Displays a symbol's price movements over previous years to identify recurring trends.
A
ATVI5026499
Activision Blizzard, Inc. 2.5% 15-SEP-2050Yield to maturity
8.33%
Maturity date
Sep 15, 2050
A
ATVI4499883
Activision Blizzard, Inc. 4.5% 15-JUN-2047Yield to maturity
7.80%
Maturity date
Jun 15, 2047
A
ATVI5026498
Activision Blizzard, Inc. 1.35% 15-SEP-2030Yield to maturity
6.64%
Maturity date
Sep 15, 2030
See all MSFT bonds
Curated watchlists where MSFT is featured.


