Israel Strikes Iran. Oil and Gold Prices SurgeIsrael Strikes Iran. Oil and Gold Prices Surge
According to media reports, Israel launched a large-scale overnight strike on Iranian territory, targeting dozens of military and strategic facilities linked to the country’s nuclear programme and missile capabilities. Israeli officials justified the

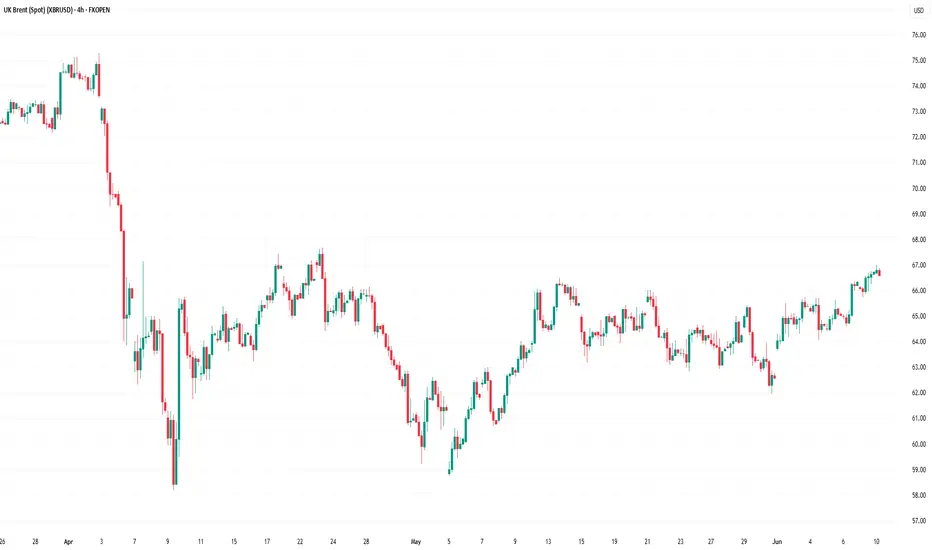
XBR/USD Chart Analysis: Brent Crude Reaches 1.5-Month HighXBR/USD Chart Analysis: Brent Crude Reaches 1.5-Month High
In our analysis of Brent crude oil six days ago, we identified a large contracting triangle and a local ascending channel. We also outlined a potential scenario involving a bullish breakout above the upper boundary of the triangle.
Althou
Brent Oil Intra-day Analysis 12-Jun-25Drawing possible scenarios we could see on Brent Oil prices.
Keep in mind fundamentals supporting the move up on oil:
* Geopilitical escalations between Russia and Ukraine
* Opec+ production policy
* US - China Trade talks and demand optimisim
* Geopolitical tensions between US and Iran.
Dis

Oil spikes as Israel strikes Iran: What traders need to knowOil prices surged after Israel attacked Iran’s nuclear sites, reversing the recent downtrend and reigniting inflation fears. In this video, we break down the chart patterns, explain the move, and explore what could come next. Is this the start of a new uptrend or just a short-lived spike? Watch for

Elliot Wave 3 advance just starting in Brent Crude - Target $255Have tried to show and explain my analysis with the written annotation on the chart but, in short, I believe we are witnessing the start of a Wave 3 advance in Brent Crude with a target price of $255.
Just about every other commodity i look at are showing similar indications of major advances just

Brent Oil H1 | Potential bounce off a multi-swing-low supportBrent Oil (UKOILSPOT) is falling towards multi-swing-low support and could potentially bounce off this level to climb higher.
Buy entry is at 64.42 which is multi-swing-low support that aligns with the 78.6% Fibonacci retracement.
Stop loss is at 63.70 which is a level that lies underneath a pullb


Brent Bulls Eye $74 & $81 — 2 Profit Points, 1 Tight StopBrent crude has confirmed a bullish breakout on the daily chart after closing decisively above the key horizontal resistance near $66.65. This level had acted as strong overhead pressure over the last two months but has now flipped into support, reinforcing the bullish sentiment.
Price is currently

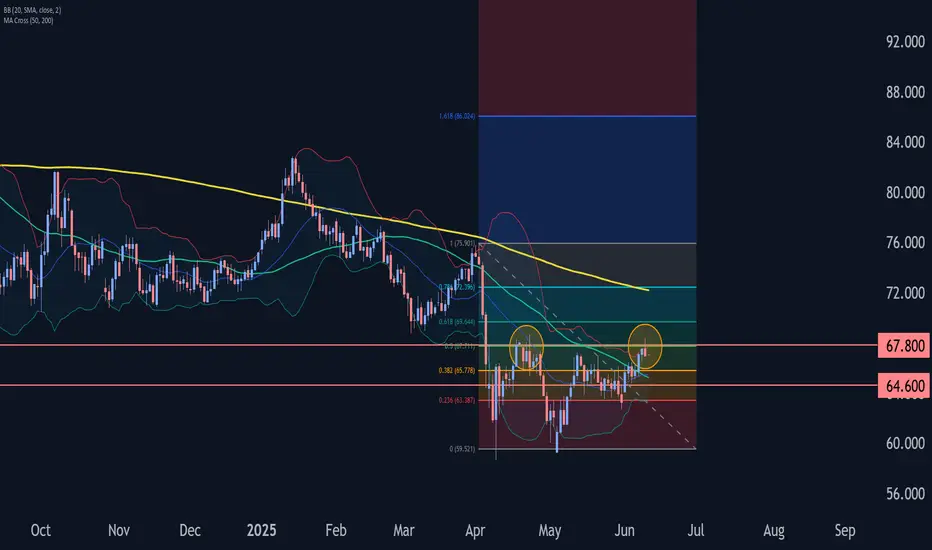
Brent crude oil Wave Analysis – 10 June 2025
- Brent crude oil reversed from key resistance level 67.80
- Likely to fall to support level 64.60.
Brent crude oil recently reversed down from the resistance area between the key resistance level 67.80 (which stopped wave (2) in the middle of April), upper daily Bollinger Band and the 61.8% Fibon
Crude Climbs Back to Key Resistance ZoneOil is back at a key level. After a two-legged recovery from May’s lows, Brent crude is now pushing into a heavy resistance zone that traders will be watching closely. Let’s take a look at what’s driving the move and why this area could matter.
Production Lags Behind the Promise
OPEC’s product

See all ideas
Displays a symbol's price movements over previous years to identify recurring trends.