Brent Crude Alternative In trade analysis using pure price action, when a potential head and shoulders pattern doesn't confirm, watch out for the alternative: the triangle between the head and right shoulder. Always weigh all potential price movements and trade the setup with the best odds. Note: This analysis is on a very long timeframe—the weekly chart.
UKBRENT trade ideas

What to do when you forget to trail?In this live trading,we look at the different options we looked at when we forgot to trail our stop on brent oil. You can apply these principles on any strategy.

Live Trading Session 253: Potential & open positions on BRT,etcIn this live trading session video,we look at current live open positions on BRENT, GBPUSD,
EUR and potential trades coming on Bitcoin,Etherum,US30, etc and the thinking behind them.

DeGRAM | UKOIL potential double top at the resistance levelUKOIL was rejected at resistance at 84.00 before.
Price is printing potential for a double-top.
The oil market is consolidating on the 4H chart.
We anticipate further consolidation and a bounce off the resistance level.
-------------------
Share your opinion in the comments and support the idea with a like. Thanks for your support!

Oil short patternBased on cycles and ewa, ending 2 after 1, and go to 3 vawe sort in A B C. A ending at 54-56.

UKOIL 09.02.2024 please make sure of them and do not risk, this is our analysis and ideas.
Please observe the capital carefully and do not risk more than 1% of your capital
Good luck to everyone

Live Trading Session 252: Open positions on BRT,GBP&EURIn this live trading session video,we look at current live open positions on BRENT, GBPUSD,
EUR,USDJPY and potential trades coming on Bitcoin,Etherum,US30, etc and the thinking behind them.

BCOUSD#Brent crude oil - H1
📣 Based on the chart structure in the 1-hour timeframe, with a break above the downtrend line around the 79.24 level, one can consider buying with a target of 81.00.
⛔ Stop Loss: 77.80
On the other hand, with a break below the 77.80 range, one can be optimistic about a price decline towards the 76.00 range.
⛔ Stop Loss: 79.24

what next for oil?🤔On hi time from we can see a biger flag pointing to down wait for more information to go short

UKOIL Brent 05.02.2024 please make sure of them and do not risk, this is our analysis and ideas.
Please observe the capital carefully and do not risk more than 1% of your capital
Good luck to everyone

Will Brent oil stop its correction?📊 Due to the price approaching the supply range of $79.0 and the downward momentum of the price movement, if the range of 78.0 units is broken and the price stabilizes below it, the price may fall to the range of 76.6 🎯and in the case of the strength of the range of 74.0 units🎯🎯.
📊 Otherwise, the possibility of price increase up to the range of 81.0 units.

THE CATALYST COMES OUT FOR BRENTArea of Interest price for BRENT play out
As concern for the increasing tension in the Middle East and the ongoing Russian invasion that could lead to the curb of the global oil supply, the price bounced from the AoI marking.
.
.
Stay safe in these uncertain economic conditions X.CO

BRENT REACHING THE AREA OF INTERESTWaiting for the catalyst to either pull or drag the price down
Let's see how London and New York play out, make sure to check the Geopolitical news that might occur in the meantime.
.
.
Be Safe X.CO

DeGRAM | UKOIL channel breakingUKOIL broke the ascending channel and went down.
The oil market is likely to create a pullback from the support level.
We anticipate a continuation of the bearish trend.
-------------------
Share your opinion in the comments and support the idea with a like. Thanks for your support!

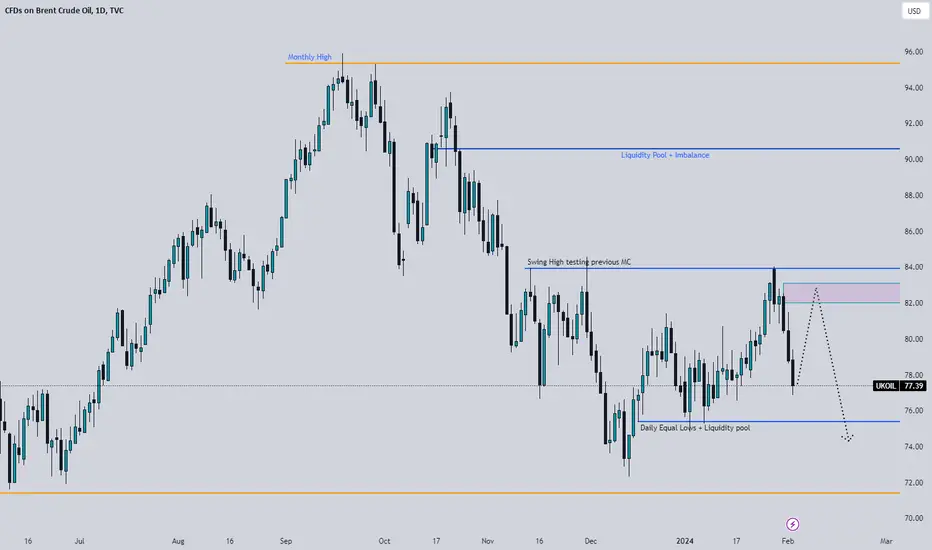
UKOil will continue moving lower!!UKOil tested swing high and moved aggressively lower. This week I will be looking for a selling opportunity to take this pair lower on smaller timeframes.
Look at the chart markup for more details.
BRENT OIL - 4HAccording to the strong downward momentum of the price movement and selling pressure in the market, if the range of 76.0 units is broken and the price stabilizes below it, the price may fall to the range of 74.8 and in the case of the strength of the range of 73.0 units.
Otherwise, the possibility of price increase up to the range of 79.0 units.

DeGRAM | UKOIL bearish move from confluence levelUKOIL bounced off the resistance at 84.00 and the 127.2% fibo extension level.
Price created the bearish harmonic pattern after breaking out of the descending channel.
The current trend on the D chart is a pullback against the major trend.
We anticipate a pullback and bearish move.
-------------------
Share your opinion in the comments and support the idea with a like. Thanks for your support!

brent 3h time frameAs we can see on the 3h chart of (bCo - brent C O) , it is clear that 12 and 12 is done so we need 1 flag and then the price should go down to the second 12 low price around 71.347 $ (calculated by low low symmetry on NDS strategy.

UKOIL Swing TradeUKOIL looks to be in an extending diagonal formation with an expected upside target of $93-$95. Invalidation to this idea is only possible with a break below $75.07.
These are my thoughts. Tell me your ideas on this in the comments.

OIL Brent Cash 29.01.2024please make sure of them and do not risk, this is our analysis and ideas.
Please observe the capital carefully and do not risk more than 1% of your capital
Good luck to everyone

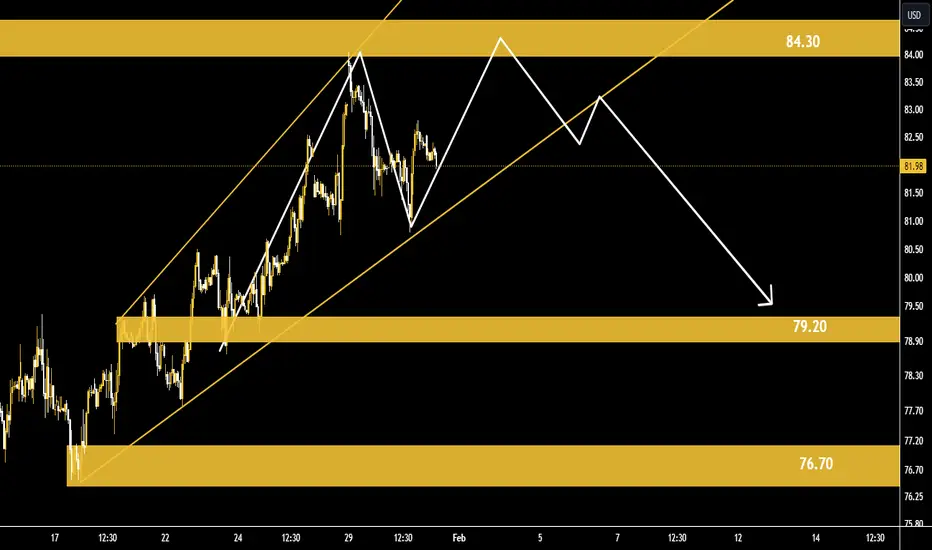
BRENT OIL - 1HIn the four-hour time frame, the trend of the price movement is upward, but due to the compression of the price movement and increasing selling pressure, if the upward trend is broken, the price will move downwards and the price stabilizes below the range of 81.5 units, the price may fall to the range of 80.6 units, and in the case of strength, the range of 79.2 units .
Otherwise, the possibility of price increase up to the range of 84.3 units.
Brent Crude’s Triangle BreakoutOil Jumps as US Military Base in Jordan Attacked
The Middle East powder keg came into sharp focus again this weekend following a drone attack by Iran-backed militants on a US military base in Jordan. President Joe Biden reported three service members were killed in the attack.
These casualties mark the first time US troops have been killed in an attack in the Middle East since the Israel-Hamas war began in Gaza in October. In response to the incident, Brent crude, the international oil benchmark, gapped higher in early trading but has since given back the gains.
While escalating tensions in the Middle East provide a supportive backdrop for oil, this month has also witnessed headwinds. Saudi Arabia's unexpected price cuts and the International Energy Agency (IEA) projecting a significant slowdown in oil demand growth for 2024 have added pressure to the market.
Building Bullish Momentum on Brent Crude's Daily Candle Chart
After more than a month of tight consolidation, the market for Brent Crude has finally showed its hand…
Prices had been winding ever tighter within a triangle consolidation pattern, but last week’s price action saw the market break decisively above it – creating a burst of bullish momentum. The breakout takes prices above the volume-weighted average price (VWAP) anchored to the September 2023 highs for the first time since October.
The market now faces a critical level of horizontal resistance (black dashed line), previously rejected twice in November. A successful breach of this level could pave the way for a more robust bullish trend in Brent crude.
Brent Crude Daily Candle Chart
Past performance is not a reliable indicator of future results
Disclaimer: This is for information and learning purposes only. The information provided does not constitute investment advice nor take into account the individual financial circumstances or objectives of any investor. Any information that may be provided relating to past performance is not a reliable indicator of future results or performance. Social media channels are not relevant for UK residents.
Spread bets and CFDs are complex instruments and come with a high risk of losing money rapidly due to leverage. 84.01% of retail investor accounts lose money when trading spread bets and CFDs with this provider. You should consider whether you understand how spread bets and CFDs work and whether you can afford to take the high risk of losing your money.

Higher Time Frame Volume and Liquidity BiasYersterday i had the opportunity to look at my charts. Saw a perfect textbook analysis demonstration of the Topdown Analysis. i can Help you Just like comment and hit me up lets chart.
