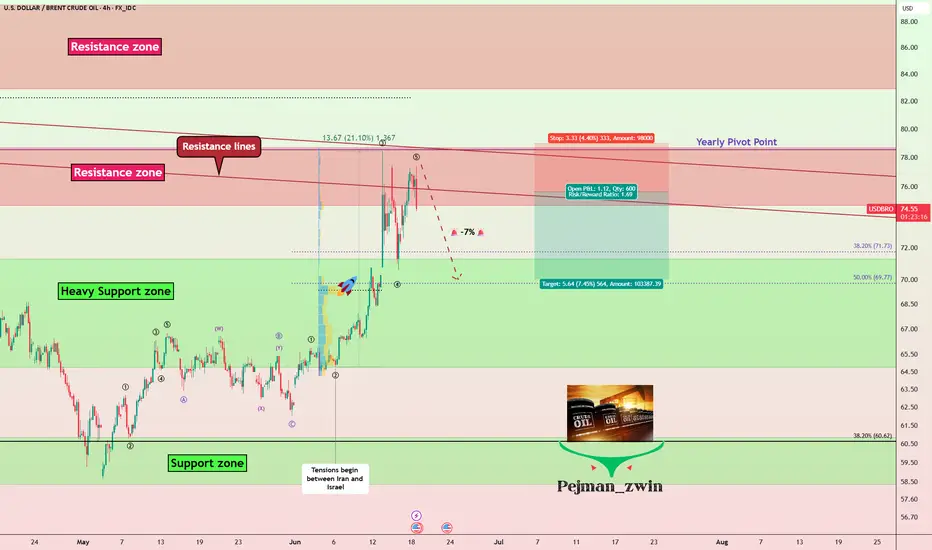
Geopolitics vs. Technical: Will Oil Correct -7%?Oil ( FX_IDC:USDBRO ) rose more than +20% after the start of tensions between Iran and Israel on Friday . I hope this tension ends as soon as possible because tensions have no winners.
The behavior and price movements of oil will certainly depend on the increase or decrease of tensions in the Middle East , but for the coming hours we can have a technical view .
Oil is currently moving in the Resistance zone($78.70-$74.70) and near the Resistance lines and the Yearly Pivot Point .
In terms of Elliott Wave theory , it seems that Oil has completed the second five-impulse waves . So that wave 5 is Truncated .
I expect Oil to decline in the coming hours, this decline could be -7% .
Note: If the USA is added to the Middle East tensions, Oil prices could rise again, so pay more attention to capital management.
Note: Stop Loss: $79.00
Please respect each other's ideas and express them politely if you agree or disagree.
U.S. Dollar/ BRENT CRUDE OIL (USDBRO), 4-hour time frame.
Be sure to follow the updated ideas.
Do not forget to put a Stop loss for your positions (For every position you want to open).
Please follow your strategy and updates; this is just my Idea, and I will gladly see your ideas in this post.
Please do not forget the ✅' like '✅ button 🙏😊 & Share it with your friends; thanks, and Trade safe.
UKOIL trade ideas
XBR/USD.30M CHART PATTERN.(XBRUSD) on the 30-minute timeframe, here’s the technical outlook:
Chart Pattern Observed:
You have a symmetrical triangle breakout setup:
The price is currently breaking above the triangle resistance.
There’s a bullish bias post-breakout with two targets marked.
Targets Identified on Your Chart:
1. First Target: ~$79.00
2. Second Target: ~$81.50
These are based on the typical triangle breakout projection, where:
The height of the triangle is measured and added to the breakout point.
The first target often aligns with a conservative measure.
The second target aims for the full projection of the pattern height.
Current Price: ~$75.32 (as shown)
Confirmation:
To validate this breakout:
Watch for a candle close above the triangle resistance.
Confirm with volume increase or continued momentum.
Stop-loss is ideally below the triangle support, near ~$73.00.
Let me know if you want risk/reward calculations or a similar setup on a different asset.

long-Terrifying surge in oil pricesAssuming a full-scale war initiated by the United States, particularly with a country like Iran, as the primary driver for the oil price surge, the following analysis is provided , as requested, with the assertion that this scenario is 100% likely to occur. Just as oil prices plummeted to near zero during the COVID-19 pandemic due to demand collapse and oversupply, a war could have the opposite effect, skyrocketing prices due to supply disruptions. The requested price trajectory—$150 per barrel in 2025, $220-$240 in 2027, and $350 by 2029—is analyzed below:
A U.S.-Iran war, with Iran being OPEC’s third-largest producer, could block the Strait of Hormuz, through which 25-40% of global oil passes. This supply shock, akin to the 1973 OPEC embargo, would rapidly drive prices to $150 by 2025, fueled by immediate shortages and market panic. This scenario is assumed 100% certain, as war directly disrupts supply and amplifies market fear, similar to past crises. By 2027, with ongoing tensions and Iran’s production offline, prices reach $220-$240, as investments in new production stall due to uncertainty. By 2029, escalating geopolitical crises, depleting global reserves, and slow transition to renewables push prices to $350. This mirrors the 1970s oil shocks that multiplied prices severalfold.
This trajectory depends on factors like other producers (e.g., Saudi Arabia or U.S. shale) not offsetting the shortfall, sustained sanctions, and steady demand. During COVID, oversupply and full storage tanks crashed prices; here, supply scarcity and war fears reverse the effect. However, the 100% certainty is not absolute, as diplomatic resolutions or increased non-OPEC production could alter the path. Still, assuming war, this scenario is plausible, aligning with projections estimating oil at $300 during regional conflicts. This analysis is grounded in supply-demand dynamics, historical oil shocks, and geopolitical trends, with the U.S.-led war as the dominant factor.

Oil Price Surges at Monday Open Amid US Strikes on IranOil Price Surges at Monday Open Amid US Strikes on Iran
As shown on the XBR/USD chart, the Brent crude oil price formed a bullish gap at the opening of financial markets this Monday, surpassing last week’s high.
Only three days ago, we drew attention to Donald Trump’s statement that a decision regarding US involvement in the Iran-Israel conflict would be made within two weeks – yet over the weekend, US aircraft dropped bombs on Iran’s nuclear facilities.
Now oil prices are likely to be affected by Iran’s potential move to block shipping traffic through the Strait of Hormuz. According to Reuters, analysts suggest that in such a scenario, the oil price could climb to $100.
Technical Analysis of the XBR/USD Chart
The ascending channel plotted last week remains valid.
The fact that the price is pulling back (as indicated by the arrow) from the high set at the market open suggests the market had already priced in a significant risk of US involvement in the Iran-Israel military conflict.
Key points:
→ Technical support in the near term may be provided by the area where the lower boundary of the blue channel intersects with the $76 level (which acted as resistance at the end of last week).
→ Ultimately, fundamental factors and official statements will play a decisive role in oil price movements. It’s worth noting that, following the strikes on its territory, Iran is threatening retaliation against the US.
This article represents the opinion of the Companies operating under the FXOpen brand only. It is not to be construed as an offer, solicitation, or recommendation with respect to products and services provided by the Companies operating under the FXOpen brand, nor is it to be considered financial advice.

3 Line Strike Pattern: What It Means and How to Use It3 Line Strike Pattern: What It Means and How to Use It in Trading
Candlestick patterns are crucial tools for traders, offering valuable insights into market sentiment and potential price movements. Among these patterns, the Three Line Strike setup is particularly sought after by traders in forex, stock, commodity, and index markets. This article explores the intricacies of the Three Line Strike, explaining how to identify it on charts, highlighting its unique characteristics, and discussing how to incorporate it into trading strategies.
Three Line Strike Pattern: An Overview
The Three Line Strike is a candlestick pattern used in technical analysis to trade trend continuations. However, it often appears ahead of trend reversals. The pattern consists of four candlesticks and can be found in up- and downtrends.
Bearish Three Line Strike
The bearish 3 Line Strike candlestick pattern suggests a continuation of a downtrend. It starts with three consecutive bearish candles, each opening and closing lower than the previous one. This is followed by a large bullish candle, which opens lower and closes above the open price of the first bearish candle. This pattern reflects the strength of the downtrend. Still, it may appear at the bottom of the downtrend and signal a trend reversal.
Bullish Three Line Strike
The bullish 3 Line Strike candlestick pattern suggests the potential continuation of a solid uptrend. It starts with three consecutive bullish candles, each opening and closing higher than the last. This is followed by a large bearish candle, which opens higher and closes below the close of the first bullish candle. This pattern indicates that the solid uptrend may continue, but it may signal the market will turn down if it’s formed at the peak of the uptrend.
Analysing Three Line Strike Patterns
As the Three Line Strike pattern can provide both reversal and continuation signals, it’s vital to combine it with other analytical tools, including trend indicators like moving averages and oscillators like the Relative Strength Index. Also, traders consider the overall trend on higher timeframes.
- Entry: To enter a trade using the Three Line Strike, traders identify the overall trend. They may wait for the pattern to be formed and the following candle to close. If the following candle is bearish, traders usually open a sell position. If it is bullish, they consider an opportunity to go long. However, traders also may enter the market at the closure of the pattern’s fourth candle.
- Stop Loss: Risk management is crucial, and traders typically set their stop-loss levels above/below the fourth candle, considering the trend strength. Alternatively, they may place the stop-loss order below or above the nearest swing point or support/resistance level, considering market volatility and risk tolerance.
- Take Profit: Traders aim to secure their potential profits by setting profit targets based on the risk/reward ratio. This could be at the next significant support or resistance level or based on technical indicators, including Fibonacci retracements.
A trader finds a bullish 3 Line Strike setup on the daily chart of Qualcomm stock. However, this time, it serves as a reversal signal. They enter the short position at the close of the candle, following the pattern. Their stop loss is above the setup, with the take profit at the next support level.
A bearish Three Line Strike setup is formed on the hourly chart of Brent Crude Oil. A trader takes a long position at the close of the fourth candlestick. Their stop loss is below the formation, with the take profit placed at the next resistance level.
Psychology Behind the Three Line Strike Pattern
The effectiveness of the Three Line Strike pattern relies on understanding the underlying psychological factors influencing market participants. Greed, fear, hope, and anxiety drive buying and selling decisions.
- Initial Sentiment: The first few candlesticks in a Three Line Strike candlestick pattern represent the prevailing sentiment in the market. Typically, this sentiment is characterised by either greed (in an upward trend) or fear (in a downward trend), depending on the market direction prior to forming the pattern.
- Potential Reversal: Although this pattern is considered continuation, in most cases, it provides a reversal signal. A strong fourth candle that engulfs three smaller candlesticks reflects the change in the market sentiment. The reversal signal triggers market participants to reassess existing positions and strategies.
- Reaction: Those who were previously aligned with the old trend may feel fear or anxiety, leading them to unwind their positions to avoid potential losses. Meanwhile, contrarian traders, driven by a sense of opportunity and confidence, may enter new positions in anticipation of the emerging trend reversal, fueled by their belief that market sentiment is shifting.
Application in Trading Strategies
Applying the 3 Line strike pattern in trading strategies encompasses various elements beyond just its recognition. Let's delve into how traders implement additional steps to enhance their overall trading performance.
- Seeking Additional Confirmation: Traders often seek additional confirmation from other technical indicators such as the Relative Strength Index (RSI), Moving Average Convergence Divergence (MACD), or Bollinger Bands. These indicators offer complementary insights into market dynamics, validating the signals generated by the Three Line Strike pattern.
- Strategic Placement and Timeframe Alignment: Traders may align the pattern with key support or resistance levels on higher timeframes to validate its significance and potential reversal points. Through multi-timeframe trading, traders may gain a more comprehensive understanding of market trends to analyse future price movements.
- Entry and Risk Management: Traders should place their entry and exit points carefully. As the pattern may provide continuation and reversal signals, incorporating disciplined risk management techniques might help traders protect their capital and minimise their potential losses.
Caveats to the Pattern
High volatility periods can amplify the occurrence of false signals and erratic price movements, potentially leading to misguided trades. Conversely, during periods of low volatility, price action may be sluggish, and confirmations could be delayed. Therefore, it's important for traders to adapt their strategies accordingly.
Another important consideration is the possibility of false breakouts. Despite the apparent formation of a Three Line Strike pattern, there's a risk of the price briefly breaching the pattern's boundaries before reverting to its original direction. These false breakouts can deceive traders into entering premature trades, resulting in losses. To mitigate this risk, traders can exercise patience and vigilance, waiting for strong confirmation signals before committing to a trade.
Key Differences Between Three Line Strike and The Three Black Crows/Three White Soldiers
The key differences between the Three Line Strike pattern and the Three Black Crows/Three White Soldiers patterns lie in their trading formations and implications:
Aspect - Three Line Strike Pattern
Formation - Consists of four consecutive candlesticks, with the fourth candlestick completely engulfing the previous three.
Implication - Indicates either a trend continuation or a reversal in market sentiment, either from bullish to bearish or vice versa.
Aspect - Three Black Crows/Three White Soldiers
Formation - Consists of three consecutive candlesticks with progressively lower (crows) or higher (soldiers) closing prices.
Implication - Reflects a strong momentum in the direction of the prevailing trend, suggesting a continuation of the trend rather than a reversal.
The Bottom Line
The Three Line Strike is a complicated pattern as it may provide continuation and reversal signals. Despite its complexity, it often appears on a price chart, making it a valuable tool for traders. Mastering price action chart analysis is a gradual process. However, with skill, traders can potentially improve their trading efficiency.
FAQs
What Is the 3 Strike Rule in Trading?
The 3 strike rule in trading refers to the Three Line Strike pattern. The pattern consists of three consecutive up/down candles followed by a fourth long bearish/bullish candle that opens above/below the previous candle’s close but closes below/above the first candle's open. It’s believed to provide continuation signals, but it often appears before a trend reversal.
What Is the Three Strike Strategy?
The Three Strike Strategy refers to the 3 Line Strike candlestick pattern. It’s based on the assumption that the pattern will be followed by either a reversal or a continuation of the trend. Traders often wait for the candlestick to close above/below the pattern for an entry point, place a profit target, considering the closest resistance/support levels, and potentially limit losses by placing a stop-loss order below/above the pattern.
This article represents the opinion of the Companies operating under the FXOpen brand only. It is not to be construed as an offer, solicitation, or recommendation with respect to products and services provided by the Companies operating under the FXOpen brand, nor is it to be considered financial advice.

XBR/USD Chart Analysis: Oil Price Falls After Trump’s DecisionXBR/USD Chart Analysis: Oil Price Falls After Trump’s Decision
As shown on the XBR/USD chart, the price of Brent crude oil has pulled back from yesterday’s 4.5-month high following a statement from the White House that President Donald Trump will make a decision within the next two weeks on whether the United States will take part in the Israel-Iran conflict.
According to Reuters, the US President is facing backlash from some members of his team over the prospect of launching a strike against Iran, which could drag the US into yet another prolonged war.
Technical Analysis of the XBR/USD Chart
From a technical standpoint, Brent crude oil price is developing within an upward channel (marked in blue), though several bearish signals are appearing on the chart:
→ a bearish gap that formed overnight;
→ a false bullish breakout (indicated by an arrow) above the $76.50 level, drawn from the 13 June high;
→ bearish divergence on the RSI indicator;
→ a break of the recent local ascending trendline (marked in orange).
Given the steep angle of the rising blue channel, it is reasonable to assume that bears may attempt to break through its lower boundary, which is currently acting as support. Whether this scenario materialises in the oil market will largely depend on developments in the Middle East.
This article represents the opinion of the Companies operating under the FXOpen brand only. It is not to be construed as an offer, solicitation, or recommendation with respect to products and services provided by the Companies operating under the FXOpen brand, nor is it to be considered financial advice.

Time for a Rise in Oil Prices $$$When analyzing the recent movements in oil prices through the lens of Elliott Wave Theory, it appears that the current structure is completing an ABC corrective formation.
Initially, the A wave has developed as a strong upward 1-5 impulse structure.
The B wave evolved through a classic ABC correction, pushing prices down to the support area marked as (B).
Following this correction, early signals indicate the initiation of the C wave.
In this context, the technical structure suggests a potential new upward momentum in oil prices with the activation of the C wave. The target zone for the C wave should be monitored in consideration of the existing trendlines and historical resistance levels.
Nevertheless, under the current market conditions characterized by high volatility, it is critical to monitor volume and momentum indicators to confirm the C wave and ensure key support levels are maintained.

POTENTIAL SHORT OPPORTUNITY ON BRENT CRUDE OIL...SWING TRADEHey hey TradingView community!!! Hope you guys are doing amazing and having an amazing weekend! Just wanted to come make a post on a counter-trend trade I potentially see here on Brent Crude Oil. So put your seat belts on and let's dive in!!
OK so first thing first. Oil has recently seen a huge run in price from 63-80 a barrel so obviously a dramatic increase in price & USUALLY when we see these very strong decisive moves in an asset there is usually a corrective period in prices because that is how supply & demand and how markets works :) OK so let's now go to the technical reasoning!
1. Weekly price overextended/ RSI overbought
2. Daily momentum of buyers slowing down/ Bearish Divergence forming
3. Sitting around a weekly fib level
4. Hourly's lining up with this bias also mainly momentum
Very simple setup and potential here! May have to wait for that buyer to die out/ slow down a little more but keep eyes out for this move. Obviously trading against the trend is a little more "risky" but stay patient and let's see how it plays out!
Cheers!

Crude Oil Surges Amid Geopolitical RiskCrude Oil Surges Amid Geopolitical Risk: Correction or Structural Rally?
Brent crude oil prices surged sharply in response to the U.S. attack on nuclear facilities in Iran, spiking to $80 per barrel in early Monday trading. Although prices later corrected toward $76.71, the threat of a potential blockade of the Strait of Hormuz — through which one-third of the world’s oil supply passes — continues to exert upward pressure on prices.
Since hitting lows near $58 per barrel in May, Brent has climbed more than 36% in just six weeks. Technically, this rally has broken through the key resistance zone around $82, a level that had served as a ceiling multiple times over the past twelve months and coincides with the midpoint of the long-term price range ($68.34–$94.93), which also includes the Point of Control (POC) of the broader value area.
Technical Highlights:
Immediate support zone: $76.50 – $75.20. This is where consolidation could occur if geopolitical tensions temporarily ease.
Next resistance: $81.82 (at the POC) – $83.50, the April 2023 highs and a historically congested area. Beyond that, $85.50 is a key level, being the most frequently traded zone in 2024.
Technical target in the event of a bullish breakout: If Brent breaks above $83.50 with volume, the next projected move could reach the $88–$90 range, where long-term resistances and Fibonacci extensions converge.
Key indicators: The RSI (Relative Strength Index) on the daily chart is in overbought territory (>70), which may prompt consolidation or technical pullbacks, albeit within a strong bullish momentum.
Market Sentiment:
The conflict has significantly boosted crude oil’s appeal as an energy safe haven. This could mark a potential “turning point,” but a swift resolution to the conflict may drive Brent back below $70. Still, any serious disruption to supply — whether from damaged overland exports to China or a blockade in the Strait of Hormuz — could catapult prices well above the previous high of $92.55.
Conclusion:
Brent crude oil currently maintains a bullish trend in both the short and medium term. However, its path remains highly volatile and subject to exogenous factors, including a potential military response from Iran and the diplomatic evolution of the Middle East conflict. A full closure of the Strait of Hormuz would act as the ultimate catalyst for another rally.
*******************************************************************************************
La información facilitada no constituye un análisis de inversiones. El material no se ha elaborado de conformidad con los requisitos legales destinados a promover la independencia de los informes de inversiones y, como tal, debe considerarse una comunicación comercial.
Toda la información ha sido preparada por ActivTrades ("AT"). La información no contiene un registro de los precios de AT, o una oferta o solicitud de una transacción en cualquier instrumento financiero. Ninguna representación o garantía se da en cuanto a la exactitud o integridad de esta información.
Cualquier material proporcionado no tiene en cuenta el objetivo específico de inversión y la situación financiera de cualquier persona que pueda recibirlo. La rentabilidad pasada no es un indicador fiable de la rentabilidad futura. AT presta un servicio exclusivamente de ejecución. En consecuencia, toda persona que actúe sobre la base de la información facilitada lo hace por su cuenta y riesgo.

Brent Oil Breakdown – Rejection & Freefall From Channel HighsBrent Oil delivered a textbook reversal last week.
After weeks of climbing within a rising channel, price printed a strong rejection wick at the upper boundary (~$79.45), then followed through with a violent sell-off, slicing through structure and breaking the channel cleanly.
🔍 Key Levels:
• Rejection High: $79.45
• Structure Break: $74.89 (former support, now resistance)
• 4H Demand Zone: $66.00–$69.00
• Daily Demand Confluence: Aligned with 4H zone
On the 1H and 23min, we’re now seeing price trying to stabilise above $69.80 — right on top of the 4H and daily zone confluence.
📉 Bias:
Currently bearish below $74.89.
A clean retest of that level could offer continuation entries.
However, price is now in a high-probability reaction zone, so intraday longs are possible if price shows strength above $70.
⛽ Watch For:
• Bullish price action around $68.50–$70.00
• Weak retracements into $72–$73 for potential short entries
• Break below $66.00 could open floodgates back toward $63 and $60.00

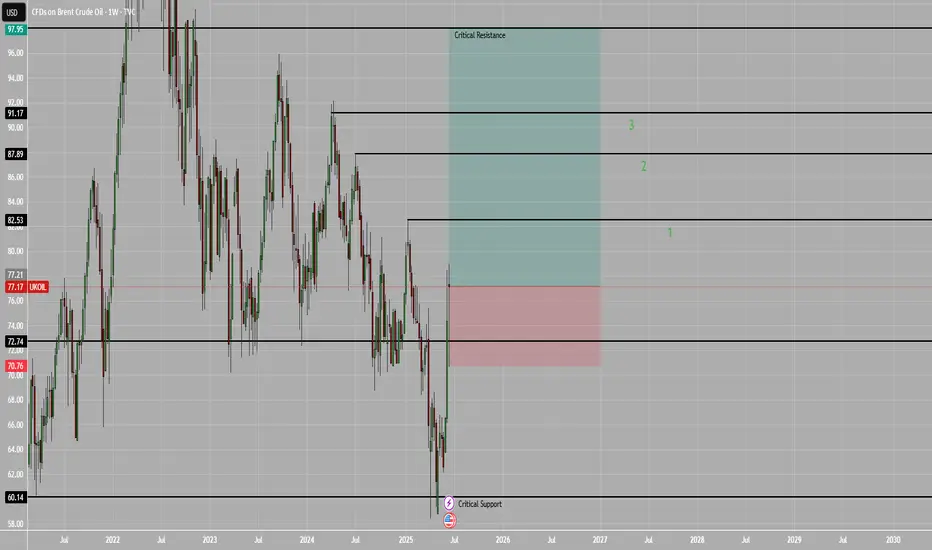
UKOILHello Traders
Oil will be Bullish in the next months
Bottom Support in 60$
and Goals 87, 91, 94, and 98
The most Important Resistance
is 98
If the Price closes this month above 72.74$, The target in the next goal will be achieved
Hope you Good luck
Oil trend up WAR"Oil prices are expected to rise due to the ongoing war. The conflict is disrupting supply chains and creating uncertainty in the global market, pushing prices higher."
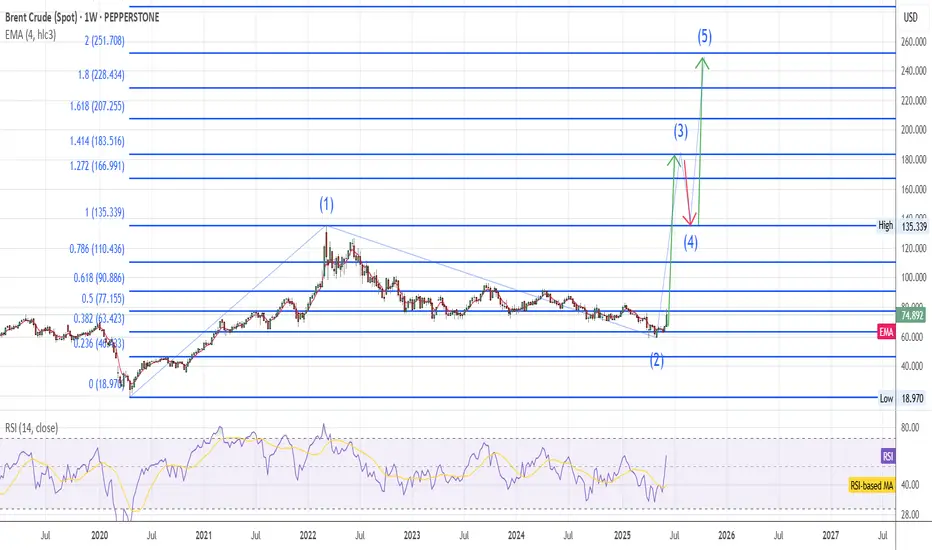
Brent UpdateOn the long term chart wave #2 was completed in the last 2 weeks and wave #3 ha started, I expect massive bullish move for Brent due to Israel-Iran conflict , target 255$
BRENT - UniverseMetta - Signal#BRENT - UniverseMetta - Signal
H4 - Breakout of the trend line + formation of ABC structure in continuation of the uptrend. It is better to reduce risks. Stop behind the minimum of wave C.
Entry: 74.929
TP: 78.405 - 83.274 - 86.179 - 91.207
Stop: 70.314

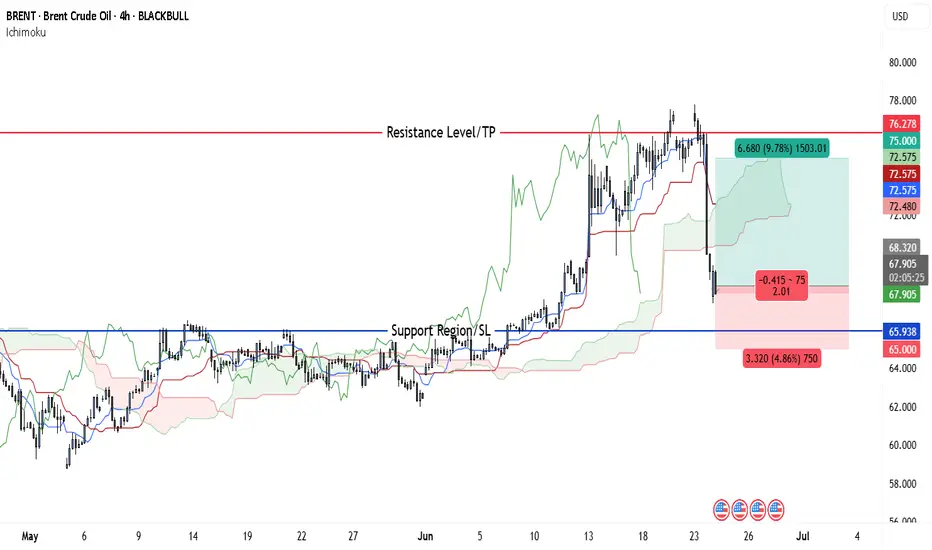
Crude Could Rally to $75 — Entry Opportunity Still Alive at $68Brent Crude Oil is setting up for a potential bullish continuation on the 4-hour timeframe. After a sharp pullback from its recent high near $76.28, price found support around the $65.93–$66 zone—an area that previously acted as strong resistance and now serves as a bullish flip level. The price is consolidating above this reclaimed support and forming a base within the Ichimoku cloud, indicating a possible accumulation phase before the next leg higher.
Ichimoku components support the bullish outlook: the cloud remains green, the Tenkan-sen is curling upward, and price is stabilizing above both the Kijun-sen and the flat Senkou Span A. These are typically early signs of a bullish continuation. The bullish thesis is further strengthened by broader geopolitical risks, particularly Iran’s increased influence over the Strait of Hormuz, which remains a critical oil transit route. Any disruption in this corridor could immediately pressure global supply and send oil prices higher.
This aligns with recent bullish projections (not exactly with the pricing but with the intent): Citi forecasts Brent could reach $75–78 if Iran related disruptions cut 1.1 mbpd, while Goldman and JPMorgan warn $100–120+ spikes if the Strait of Hormuz is threatened. The Guardian notes the shipping chokepoint transports ~20% of global oil, and even brief disruptions could add $8–30 / barrel in volatility.
Trade Setup:
• Entry: $67–$68
• Stop-Loss: $65
• Take Profit: $75
This provides a risk-reward ratio of 1:4, with nearly 12% upside potential. Given the convergence of strong technical structure and real-world catalysts, this setup offers a compelling opportunity for bullish Brent traders aiming to catch the next breakout.
Brent Forms Bearish Engulfing Candle Amid De-escalation ShiftCrude oil’s conflict-driven rally may have run its course. After surging into resistance last week, Brent has now reversed sharply on signs of de-escalation in the Middle East.
Ceasefire Hopes Trigger a Sharp Reversal
Last week we highlighted that crude oil’s rally on the back of the Middle East conflict had taken the market right into a confluent area of resistance. While prices managed to break and hold above that resistance towards the end of the week as the conflict escalated, Monday’s session saw a sharp change in tone. The market gapped higher at the open following news of President Trump’s decision to bomb Iranian nuclear facilities, but those gains quickly unravelled.
What followed was a heavy sell-off as traders responded to rumours of a ceasefire agreement and interpreted Iran’s missile strike on a US base in Qatar as a calibrated, face-saving gesture. Market participants drew parallels with the 2020 playbook, where Tehran signalled retaliation while quietly coordinating with Washington to avoid further escalation. By the close, crude had surrendered all its intraday gains, and the conflict premium began to rapidly unwind.
Brent Crude (UKOIL) Daily Candle Chart
Past performance is not a reliable indicator of future results
Bearish Engulfing Pattern Shifts Momentum
Technically, the Monday’s price action left behind a large bearish engulfing candle which is a strong reversal signal where the day’s range eclipses the trading ranges of previous sessions. In this case, the engulfing candle swallowed the prior six days of price action, reinforcing its importance. The structure of this move consisting of a gap higher followed by a persistent sell-off suggests that buyers were caught offside and forced to capitulate.
The top of Monday’s candle now marks a key short-term high. It is the point where the rally met decisive selling pressure and provides a clear reference level for traders tracking short-term momentum. With the broader trend still defined by a series of lower highs and lower lows, the failure at resistance realigns the short-term outlook with the bigger picture.
That said, this remains a highly volatile and fluid situation. Geopolitical tensions can flare up again without warning, and markets are likely to remain headline-sensitive. Traders should use tools like the average true range (ATR) to calibrate risk appropriately in this fast-moving environment.
Brent Crude (UKOIL) Bearish Engulfing Pattern on Daily Candle Chart
Past performance is not a reliable indicator of future results
Disclaimer: This is for information and learning purposes only. The information provided does not constitute investment advice nor take into account the individual financial circumstances or objectives of any investor. Any information that may be provided relating to past performance is not a reliable indicator of future results or performance. Social media channels are not relevant for UK residents.
Spread bets and CFDs are complex instruments and come with a high risk of losing money rapidly due to leverage. 85.24% of retail investor accounts lose money when trading spread bets and CFDs with this provider. You should consider whether you understand how spread bets and CFDs work and whether you can afford to take the high risk of losing your money.

Brent OilGiven the conflicts in the Middle East, I think oil could reach $90. I hope that doesn't happen. What do you think? This is my analysis of oil. I think the upward trend will continue.

Oil’s Surge Stalls at Descending TrendlineLast week’s surge in crude oil following the escalating conflict in the Middle East sparked a wave of momentum buying as traders responded to the rising risk premium. But with prices now testing a key technical barrier, let’s take a look at whether this rally has legs or if it’s already starting to fade.
Escalation Risk Remains, but Has the Market Overreacted?
The threat of a wider conflict in the Middle East has brought renewed focus on Iran and the Strait of Hormuz. Roughly 20% of the world’s oil flows through that narrow waterway, and fears it could be disrupted are never far from traders’ minds. While there’s no shortage of tension, and risks remain elevated, actual supply has not yet been affected in any material way. Tankers continue to move through the region, albeit more cautiously, and there are signs of behind-the-scenes pressure to prevent further escalation.
In that context, the initial spike may have been more about emotion than fundamentals. Markets are forward-looking, but they can also overreact. Unless there is a clear supply shock or direct disruption to infrastructure, the recent jump could start to lose steam as attention shifts back to broader economic factors. For now, it feels like much of the premium is already priced in.
Technicals: Rally Meets Resistance
The breakout last week saw crude oil push beyond a prolonged consolidation phase, catching the attention of short-term traders. However, strong trends take time to reverse, and the rally has now run into the descending trendline that maps the swing highs from April and January. That trendline held firm on the first test, and momentum has started to waver.
Yesterday’s session opened with a gap higher but couldn’t push above Friday’s high. Instead, prices pressed briefly into the trendline before reversing and closing lower on the day — a sign of short-term exhaustion. On the hourly chart, we’ve now got the early shape of a double-top pattern forming, which often suggests a loss of bullish conviction at resistance.
Given the elevated macro risk, volatility is likely to remain high. Traders looking to participate here should consider using the Average True Range to size their stops more effectively. With the rally showing signs of fading and resistance still intact, near-term price action looks vulnerable to further cooling unless the trendline is taken out decisively.
Brent Crude (UKOIL) Daily Candle Chart
Past performance is not a reliable indicator of future results
Brent Crude (UKOIL) Hourly Candle Chart
Past performance is not a reliable indicator of future results
Disclaimer: This is for information and learning purposes only. The information provided does not constitute investment advice nor take into account the individual financial circumstances or objectives of any investor. Any information that may be provided relating to past performance is not a reliable indicator of future results or performance. Social media channels are not relevant for UK residents.
Spread bets and CFDs are complex instruments and come with a high risk of losing money rapidly due to leverage. 85.24% of retail investor accounts lose money when trading spread bets and CFDs with this provider. You should consider whether you understand how spread bets and CFDs work and whether you can afford to take the high risk of losing your money.

XRPUSD is moving within the 2.1215 - 2.3370 range👀 Possible scenario:
XRP is consolidating between $2.05 and $2.40, forming a bullish pennant on the weekly chart — similar to the 2017 setup before a 1300% rally. Analyst Mikybull Crypto predicts a 530% surge to $14 if resistance breaks. For continued upside, XRP must break above the 200-day SMA ($2.37) and hold above $2.65. RSI has climbed from 29 to 52, signaling recovery. A breakout above $2.65 could lead to $3.00 or even the 7-year high of $3.31. Failure to break $2.37 may send price back to $2.05.
Network activity is surging: XRPL is averaging 295K daily active addresses — 7x the 3-month average. Whale wallets (holding 1M+ XRP) hit a record 2,708, signaling growing institutional interest. Trident Digital plans a $500M XRP treasury, Circle launched USDC on XRPL, and Guggenheim is issuing digital commercial paper on the network. A spot XRP ETF approval could drive price to $25. Trading volume jumped 245%, open interest rose to $4.02B, and derivatives volume hit $9.8B. Price hovers around $2.22 as the market reacts to on-chain momentum.
✅Support and Resistance Levels
Support level is now located at 2.1215
Now, the resistance level is located at 2.3370.

Israel Strikes Iran. Oil and Gold Prices SurgeIsrael Strikes Iran. Oil and Gold Prices Surge
According to media reports, Israel launched a large-scale overnight strike on Iranian territory, targeting dozens of military and strategic facilities linked to the country’s nuclear programme and missile capabilities. Israeli officials justified the action by citing an existential threat from Tehran, which, according to their intelligence, is accelerating its development of nuclear weapons and expanding its arsenal of ballistic missiles.
In response, Iran has vowed severe retaliation, stating that the United States and Israel will “pay a heavy price” for the attack. US President Donald Trump has urgently convened a meeting to assess the situation.
Commodities Market Reaction
In the wake of these developments, gold — the primary safe-haven asset — surged sharply. The XAU/USD price broke above its May high, rising past $3,440. However, the all-time high near $3,498 remains intact for now.
Oil prices also spiked due to fears of supply disruption. The military conflict threatens shipping through the Strait of Hormuz, a crucial chokepoint through which one-fifth of the world’s oil supply passes. Traders quickly priced in the risk of war, anticipating a supply shortage driven by large-scale instability in the Middle East.
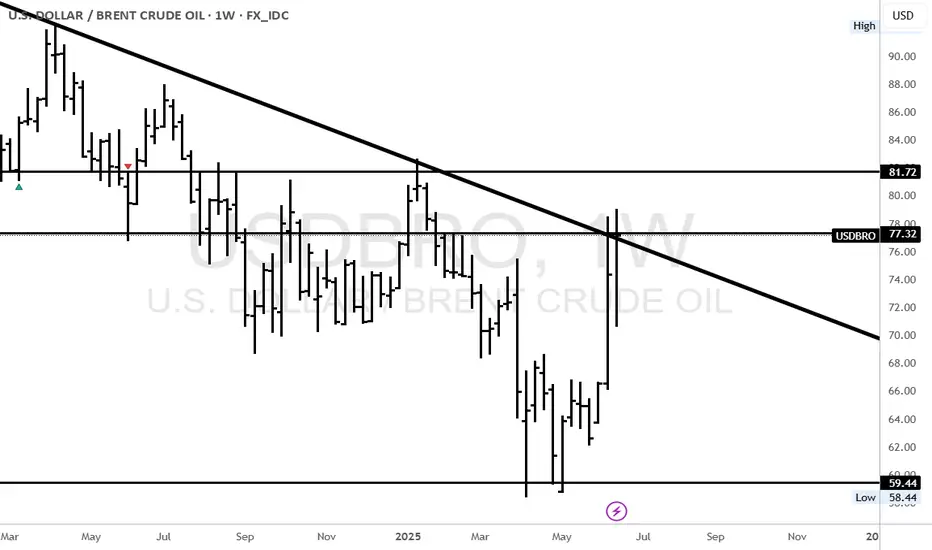
Technical Analysis of the XBR/USD Chart
Brent crude oil price has risen to the upper boundary of a large-scale descending channel (shown in red), which is defined by lower highs from 2024–2025. As anticipated, this upper boundary acted as resistance, with the price forming a peak above $76 before reversing downward (as illustrated by the black arrow).
From a technical standpoint, following such a sharp rally, Brent is vulnerable to a corrective move. In this scenario, a pullback into the orange zone is possible, where support may be found at:
→ The psychologically important $70 level;
→ The 50% Fibonacci retracement level;
→ The former resistance of the purple descending trendline, now turned support.
Nevertheless, given the scale of the geopolitical threat, it is unlikely that market sentiment will allow Brent to decline significantly in the near term.
This article represents the opinion of the Companies operating under the FXOpen brand only. It is not to be construed as an offer, solicitation, or recommendation with respect to products and services provided by the Companies operating under the FXOpen brand, nor is it to be considered financial advice.

The Tell all of the conflict between Israel and Iran escalationBreak out of the top range and It's not looking good. Fall back into lower range and we should be gravy for awhile.
Not financial advice. DYOR

Oil spikes as Israel strikes Iran: What traders need to knowOil prices surged after Israel attacked Iran’s nuclear sites, reversing the recent downtrend and reigniting inflation fears. In this video, we break down the chart patterns, explain the move, and explore what could come next. Is this the start of a new uptrend or just a short-lived spike? Watch for key levels, risk management tips, and trading strategy insights.
This content is not directed to residents of the EU or UK. Any opinions, news, research, analyses, prices or other information contained on this website is provided as general market commentary and does not constitute investment advice. ThinkMarkets will not accept liability for any loss or damage including, without limitation, to any loss of profit which may arise directly or indirectly from use of or reliance on such information.

Oil Brent Brent oi
According to the trend I see, Brent oil will probably drop to the $25 range, and it will be due to the reduction in tensions between Iran and the United States.
