Brent crude: why I'm not trading oil right nowBrent crude surged earlier this month on war headlines, and our trade setups nailed the moves. But right now, the market offers no edge. Volatility is fading and price is stuck in a large triangle. Unless you have geopolitical insight, there's no clear reason to trade. In this video, I explain why I
About CFDs on Crude Oil (Brent)
The Brent Сrude oil was originally produced from the Brent oilfield in the North Sea. About 2/3rds of all crude oil contracts around the globe include Brent Сrude oil, making it the most popular marker. Its relatively low density and sulphur content are the reasons why it’s described as light and sweet. One of the advantages is transportation since this type of oil is waterborne. The Brent Crude oil marker is also known as Brent Blend, London Brent and Brent petroleum and has a UKOIL ticker symbol.

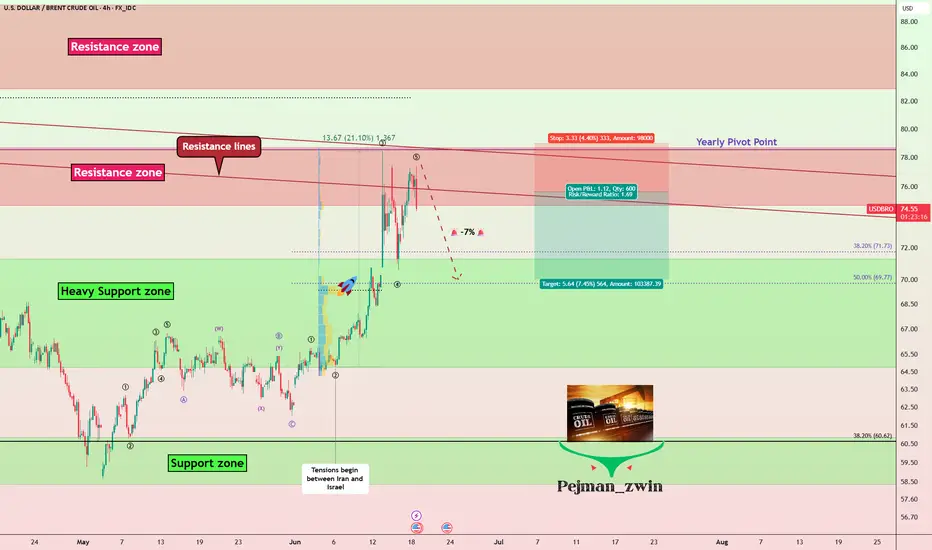
Geopolitics vs. Technical: Will Oil Correct -7%?Oil ( FX_IDC:USDBRO ) rose more than +20% after the start of tensions between Iran and Israel on Friday . I hope this tension ends as soon as possible because tensions have no winners.
The behavior and price movements of oil will certainly depend on the increase or decrease of tensions in the
Breakout In Crude OilHey fellow traders! Looks like we could have a breakout in crude oil!
Summer's here so, no surprise we would see a rise.
Target price is 75.981 area.
Beat the summer increase in gas prices by joining in on the action and long the crude futures.

Brent Oil Robbery: The Thief’s Guide to Energy Market Profits! 🚨💰 THE OIL VAULT HEIST: UK OIL SPOT/BRENT TRADING STRATEGY 💸🔫
🌟Hi! Hola! Ola! Bonjour! Hallo! Marhaba!🌟
Dear Money Makers & Robbers 🤑💰💸✈️
Based on our 🔥Thief Trading style analysis🔥 (both technical and fundamental), here’s the master plan to heist the UK Oil Spot/Brent Energy Market. Follow the bl

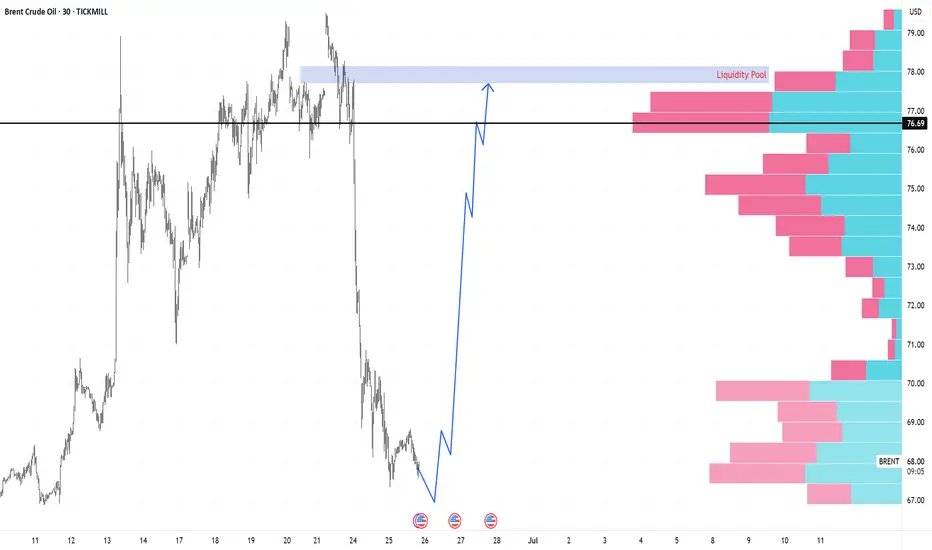
BRENT likely to reach 77.73 levelBRENT moved higher level due to war situation. BRENT is currently in downtrend and consolidating.
After consolidation BRENT is likely to rise back to 77.73 level.
This is for educational purpose only. Not an investment or financial advise.
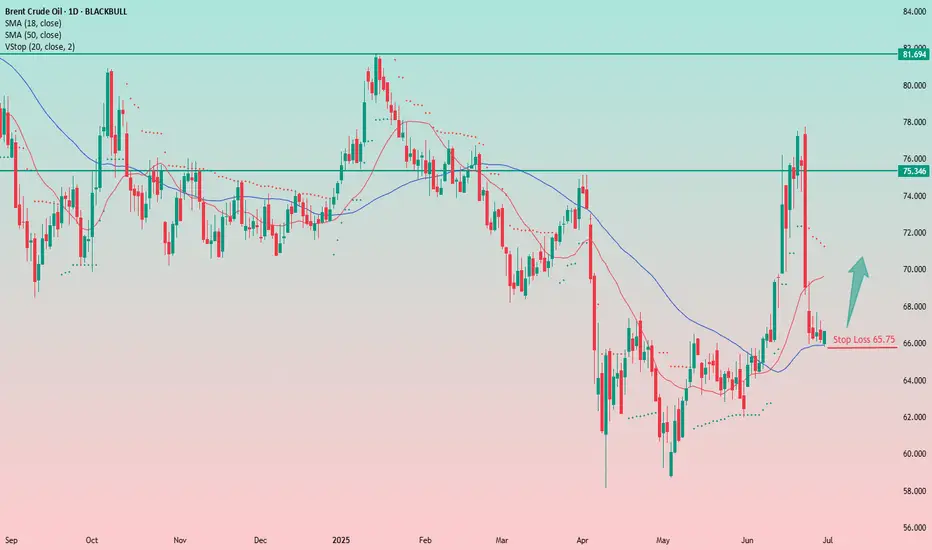
Crude Oil Bounce PlayAn interesting setup in crude oil with a tight stop at $65.75 and the first target in the $70–71 range.
It’s a bounce play. I'm usually not a big fan of these, but here I like the tight stop, the broader macro context, the sharp drop from the $76 level, and the subsequent consolidation around $66.5

OILI think this scenario can be considered for oil. Could the reason be the ongoing military conflict between Iran and Israel?

Brent Oil – Bearish Break or Bounce from Long-Term Support?Brent Oil is hovering just above critical support near 66.00, with a clear bearish structure visible across timeframes:
🔎 15m & 1h:
Price action is consolidating near the ascending support trendline drawn from early June lows. Short-term price structure shows lower highs and lower lows, suggesting

Brent Crude support at 6720Key Support and Resistance Levels
Resistance Level 1: 7060
Resistance Level 2: 7170
Resistance Level 3: 7280
Support Level 1: 6720
Support Level 2: 6610
Support Level 3: 6520
This communication is for informational purposes only and should not be viewed as any form of recommendation as to a p

See all ideas
Displays a symbol's price movements over previous years to identify recurring trends.