Stocks Are Crushing It at Record Highs. What’s Behind the Rally?Happy record highs, everyone — confetti, champagne, and yet another all-time high. The Nasdaq NASDAQ:IXIC and the S&P 500 SP:SPX just did it again — notched fresh closing records that have traders flexing their P&Ls like it’s 1999.
If you’ve been on the sidelines, you’re probably staring at th

The market bias stays up, MJ stocks may be a buy here. The market continues to be biased up, and the target is likely the weekly B. MJ stocks are showing technical signs that a reversal may come. There may be other sectors similar as I think the summer bottom gamblers will start appearing now that everything else is at the highs. Gold looks like it will

Biggest What-Ifs in Stocks (or How Investors Live with Regret)You think you’ve got regrets because you didn’t buy Nvidia NASDAQ:NVDA at $50 or sold Tesla NASDAQ:TSLA at $420? Join the club.
The stock market’s history is littered with “almost” trades, missed deals, and facepalm-worthy decisions that turned out to be trillion-dollar pivots.
This is the ha

S&P500 Bullish Leg not over yet.The S&P500 index (SPX) has been trading within a Channel Up since the May 07 Low and is currently unfolding the latest Bullish Leg.
As you can see, it is far from having topped, not just by a plain trend-line (Higher Highs) perspective but also based on the Fibonacci and % rise terms relative to th

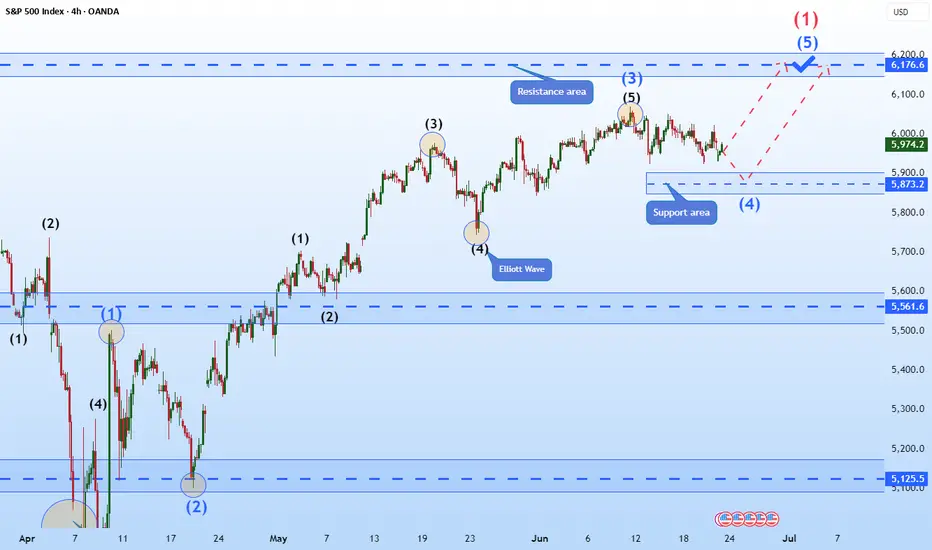
Hellena | SPX500 (4H): LONG resistance area of 6176 (Wave 1).Colleagues, the previous forecast remains essentially unchanged, and the target is still 6176, but I think the forecast can be updated because the price has been flat for quite some time.
I still expect the upward movement to continue in the large wave “1” and in the medium-order wave “5”.
A small
$SPX500 Most Hated Rally to Continue?FOREXCOM:SPX500 continues into price discovery suggesting a wave (3) is still underway but nearing a its minimum target of the 1.618 Fibonacci extension target $6310. Overextension of this target will demonstrate an even stronger bullish outlook.
Long term terminal targets remains above $7000 for

Nasdaq All-Time Highs, S&P Close, Blast Off or Breakdown?What an incredible melt-up since April 7 lows in the US markets.
Trump vs Musk - ignored
Iran vs Israel - ignored
High Valuations - ignored
FED Pausing - ignored
The US economy is resilient and it's a good thing because the world is performing really well (EX-US). Europe/China/India/Emerging Marke

Bearish Outlook on the S&P 500: Time to Get ReadyFrom a long-term perspective, I see a short setup building on the S&P 500 index. The anticipated rate cuts in the U.S. — which I believe are coming soon — have historically led to market declines, despite the common perception that lower rates are bullish for equities.
Additionally, the market app

S&P 500 - Fibonacci Resistance Intermediate wave (5) up from the 04/07/25 bottom could be nearing completion.
Minor wave 5 of (5) is close to a Fibonacci relationship with Minor wave 1.
Using leeway around the 6,208 target gives a broad zone of 6,175 to 6,220. The SPX could reach this zone on 06/27/25.

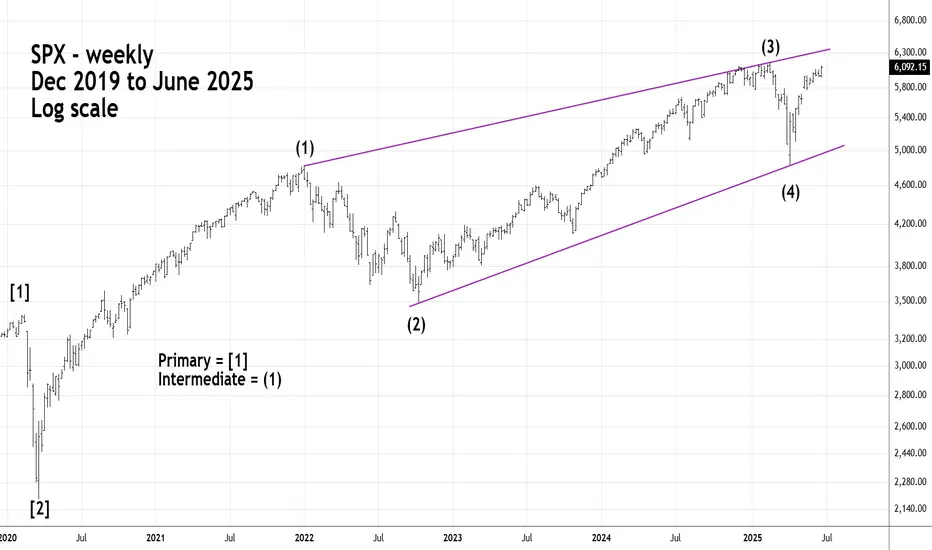
Long - Term S&P 500 - Elliott Imulse WaveThe S&P 500 - (SPX) could soon complete a five - year Elliott Impulse wave that began in March 2020.
Fibonacci resistance is in the SPX 6,200 area which could be reached on 06/26/25 or 06/27/25.
See all ideas
Displays a symbol's price movements over previous years to identify recurring trends.
Frequently Asked Questions
USA S&P 500 Index reached its highest quote on Jun 27, 2025 — 6,187.60 USD. See more data on the USA S&P 500 Index chart.
The lowest ever quote of USA S&P 500 Index is 1,387.30 USD. It was reached on Dec 29, 2012. See more data on the USA S&P 500 Index chart.
USA S&P 500 Index is just a number that lets you track performance of the instruments comprising the index, so you can't invest in it directly. But you can buy USA S&P 500 Index futures or funds or invest in its components.