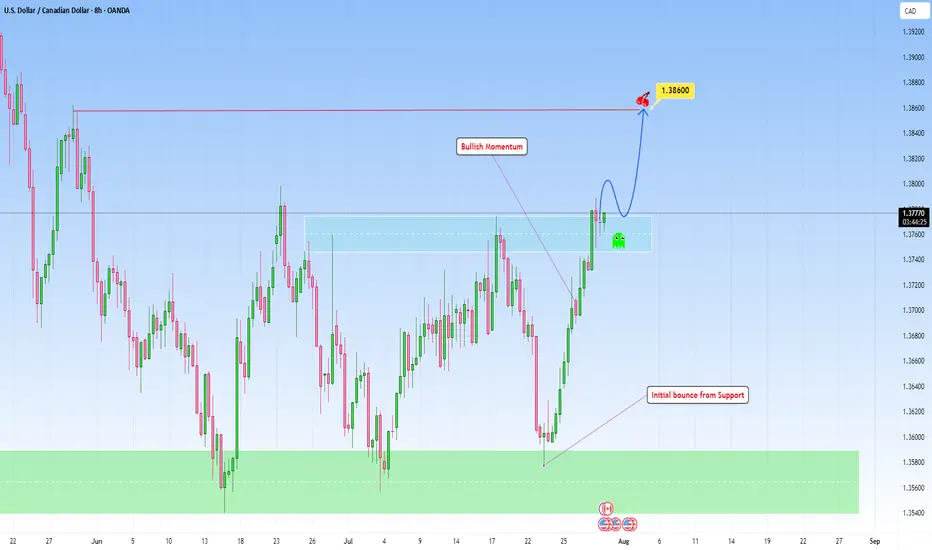
USDCAD bounced from Support and can continue higherLooking at the chart and the overall structure, I think we can favor the continuation setup with a emphasis on price action at key zones, particularly when price breaks out then can revisit this structure for a retest.
This bounce off support has been accomplished in my previous analysis:
Here, i
About U.S. Dollar / Canadian Dollar
The US Dollar vs. the Canadian Dollar is a very popular currency pair due to the extremely large amount of cross border trading that occurs between the U.S. and Canada. The CAD is considered to be a commodity currency because of the large amount of natural resources, especially oil, that are mined and exported to southern neighbors. The USDCAD is one of the most traded currency pairs in the world.
Related currencies
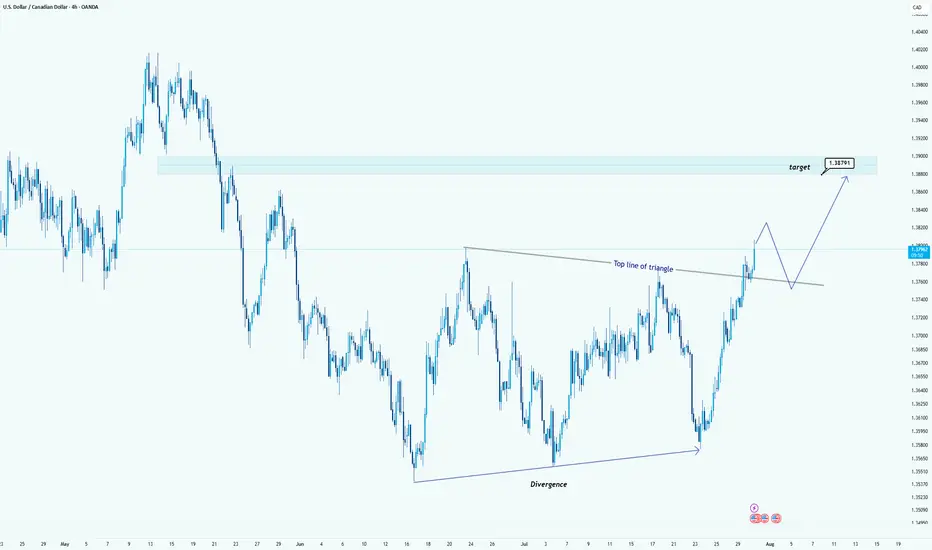
USDCAD: a long positionHello guys.
Divergence:
A bullish RSI divergence is noted, price made lower lows while RSI formed higher lows, signaling a potential bullish reversal.
Price Action:
Price has bounced strongly from around the 1.3570–1.3580 zone and is now approaching a descending trendline resistance.
Trade Setup

USD/CAD Breaks Triangle: Bullish Target in SightHello guys!
USD/CAD has broken out of a clear triangle formation, signaling strong bullish momentum. The breakout above the top line of the triangle, supported by earlier bullish divergence, confirms that buyers are now in control.
Triangle breakout confirmed
Strong bullish impulse post-brea
A New Day, A New Opportunity: USDCAD Buy StrategyGood morning Traders,
USDCAD has reached a key support zone between 1.37531 and 1.37592.
I'm opening a buy position from this level, aiming for the 1.37887 target.
Feel free to adjust your stop-loss based on your own margin and risk tolerance.
Your likes are my biggest source of motivation when

USDCAD - Bullish Triple BottomHello Traders !
The USDCAD price formed a triple bottom pattern.
Currently, The neckline is broken!
So, I expect a bullish move🚀
________________
TARGET: 1.39530🎯

USD/CAD Rises to 2-Month HighUSD/CAD Rises to 2-Month High
Today, the USD/CAD exchange rate briefly exceeded the 1.3870 mark – the highest level seen this summer. In less than ten days, the US dollar has strengthened by over 2% against the Canadian dollar.
Why Is USD/CAD Rising?
Given that both the Federal Reserve and the

Will the Canada-US Trade Tension Continue to Impair CAD?Fundamental approach:
- USDCAD advanced this week, supported by broad US dollar strength and renewed trade tensions as the US announced higher tariffs on Canadian imports.
- The pair was further buoyed after the BoC left rates unchanged and signaled caution amid persistent core inflation and ongoin
Uptrend is coming. Opportunity for buyers✏️ OANDA:USDCAD is trading close to the upper boundary of the triangle pattern. There is a high possibility that the current bullish momentum will break the upper boundary and form an uptrend for the USDCAD pair. The important price zone for the sellers at the moment is 1.075. If the buyers are s

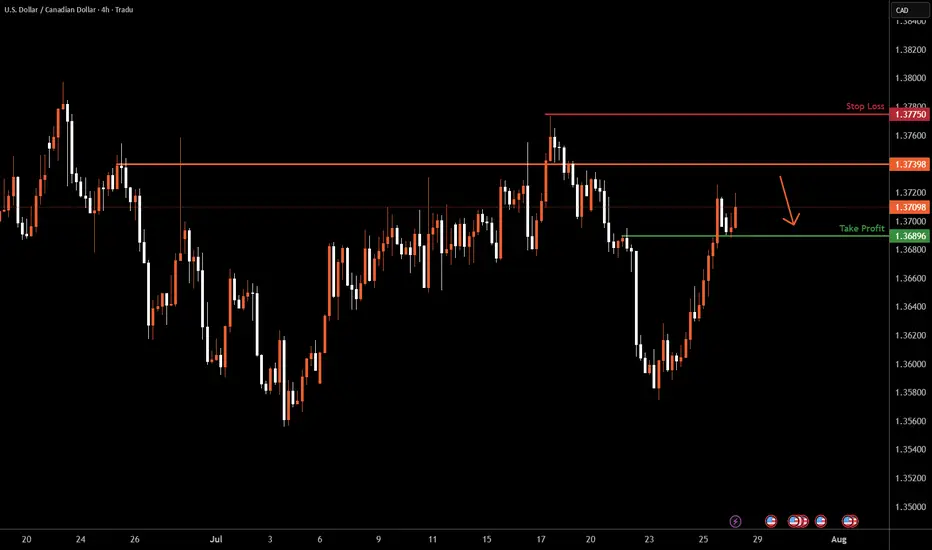
USDCAD H4 I Bearish Reversal OffBased on the H4 chart analysis, we can see that the price is rising toward our sell entry at 1.3739, which is a pullback resistance.
Our take profit will be at 1.3689, an overlap support level.
The stop loss will be placed at 1.3775, the swing-high resistance level.
High Risk Investment Warnin
USD/CAD - 6C1! : Trade update FundamentalThe US dollar index (DXY) gained strength against major currencies on Monday following a landmark trade agreement between the United States and the European Union. During the meeting in Scotland on Sunday, President Donald Trump and European Commission President Ursula von der Leyen announced a new

See all ideas
Summarizing what the indicators are suggesting.
Oscillators
Neutral
SellBuy
Strong sellStrong buy
Strong sellSellNeutralBuyStrong buy
Oscillators
Neutral
SellBuy
Strong sellStrong buy
Strong sellSellNeutralBuyStrong buy
Summary
Neutral
SellBuy
Strong sellStrong buy
Strong sellSellNeutralBuyStrong buy
Summary
Neutral
SellBuy
Strong sellStrong buy
Strong sellSellNeutralBuyStrong buy
Summary
Neutral
SellBuy
Strong sellStrong buy
Strong sellSellNeutralBuyStrong buy
Moving Averages
Neutral
SellBuy
Strong sellStrong buy
Strong sellSellNeutralBuyStrong buy
Moving Averages
Neutral
SellBuy
Strong sellStrong buy
Strong sellSellNeutralBuyStrong buy
Displays a symbol's price movements over previous years to identify recurring trends.
Frequently Asked Questions
The current rate of USDCAD is 1.37810 CAD — it has decreased by −0.54% in the past 24 hours. See more of USDCAD rate dynamics on the detailed chart.
The value of the USDCAD pair is quoted as 1 USD per x CAD. For example, if the pair is trading at 1.50, it means it takes 1.5 CAD to buy 1 USD.
The term volatility describes the risk related to the changes in an asset's value. USDCAD has the volatility rating of 0.21%. Track all currencies' changes with our live Forex Heatmap and prepare for markets volatility.
The USDCAD showed a 1.09% rise over the past week, the month change is a 1.45% rise, and over the last year it has decreased by −0.71%. Track live rate changes on the USDCAD chart.
Learn how you can make money on rate changes in numerous trading ideas created by our community.
Learn how you can make money on rate changes in numerous trading ideas created by our community.
USDCAD is a major currency pair, i.e. a popular currency paired with USD.
Currencies are usually traded through forex brokers — choose the one that suits your needs and go ahead. You can trade USDCAD right from TradingView charts — just log in to you broker account. Check out the list of our integrated brokers and find the best one for your needs and strategy.
When deciding to buy or sell currency one should keep in mind many factors including current geopolitical situation, interest rates, and other. But before plunging into a deep research, you can start with USDCAD technical analysis. The technical rating for the pair is buy today, but don't forget that markets can be very unstable, so don't stop here. According to our 1 week rating the USDCAD shows the sell signal, and 1 month rating is neutral. See more of USDCAD technicals for a more comprehensive analysis.