USD/HKD short?Factors That Could Push USD/HKD Lower (HKD Appreciation)
Capital Inflows Into Hong Kong
-Increased foreign investment (e.g., into Hong Kong equities, IPOs, real estate) can drive demand for HKD.
-This forces HKMA to intervene by selling HKD and buying USD to keep the peg in place.
Stronger Ch
About U.S. Dollar / Hong Kong Dollar
The U.S. Dollar vs. the Hong Kong Dollar. This is the most common pair to trade the Hong Kong currency. Many consider HKD to be the gateway of capital into and out of the world’s second largest economy, China, since both are becoming increasingly integrated.
Related currencies

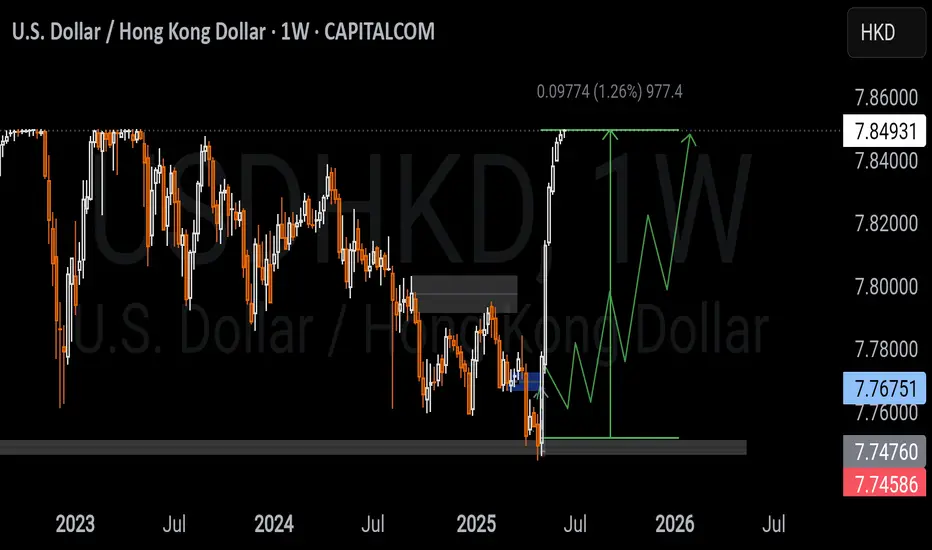
USDHKD UPDATE USDHKD skyrocketed 1.2% as I mapped it out though I didn't expect move that fast it did respect the peg range. Now what's next? Definitely total consolidation haha
How can I use PEGs to trade Forex?Hello everyone,
On May 6, we brought you a technical update on the USD/HKD rate (US dollar VS Hong Kong dollar), as the exchange rate was testing the PEG level of 7.75, defended by the Hong Kong monetary authorities. The PEG therefore provided solid support, and the exchange rate rebounded strongly

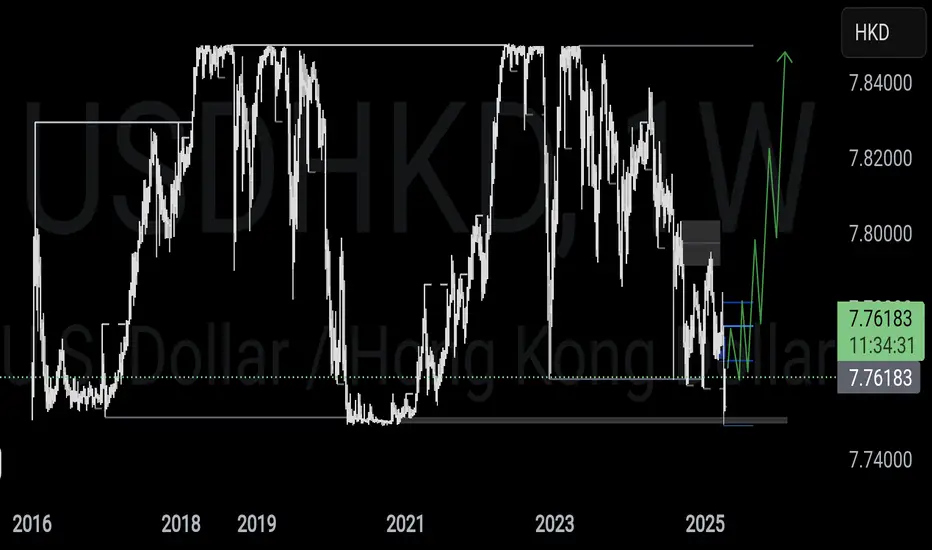
USDHKDThe Hong Kong dollar is a peg pair that will never trade above that region
It has been this since but there is a lot more to that
What do you think about the Trump Tariff will it affect the pegging policies? Let’s see how it unfolds
Caution: USD/HKD rate tests decisive PEG of 7.75Introduction: Since the start of 2025, the US dollar has been the only major currency to post a significant decline on the forex market. In fact, it is the only so-called major currency to have fallen on Forex this year. Against this backdrop, Donald Trump's trade war has weakened the greenback's i

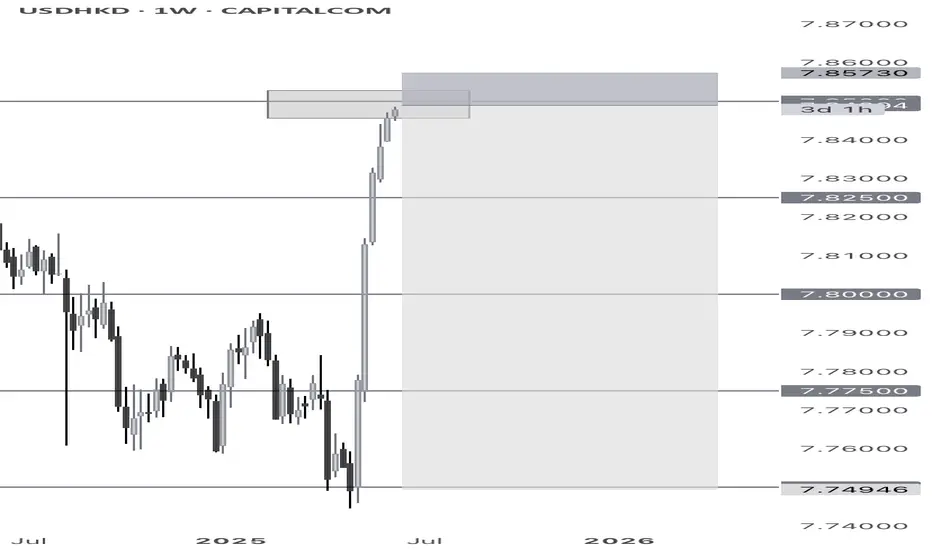
USDHKD 7.75 and 7.85 PEG RANGE USDHKD is waking up and we're getting early signals of a run toward 7.85
This pair moves in slow motion, but right now the setup is clear as price is grinding higher after bouncing perfectly from our key level. HKMA’s 7.85 weak-side peg is acting like a price magnet when the Fed stays hawkish = fuel
Understanding a Currency PegUnderstanding a Currency Peg: Definition, Mechanisms, and Implications
Fixed exchange rates, a cornerstone of international finance, play a pivotal role in shaping global commerce and investment landscapes. This article delves into their intricacies, exploring the historical evolution, practical u

USDHKD PROJECTION FOR MY FRIENDS Dear followers and friends,
See a great analysis of USDHKD on trendline and zones,
Confirming bearish move, now we wait for the market to touch the double TOP, Confirm the start of bearish movement.
Kindly like and recommend to your friends ...
OLUMIGHTYFX ACADEMY NIGERIA


USDHKD One of the best buys in the market.The USDHKD pair just formed a 1W Death Cross this week but the current 1W candle is a green one. The reason is that it is rebounding after reaching last week the 2-year Support Zone. We believe that we will see an aggressive rise next that will approach the Lower Highs trend-line. Our target is just

See all ideas
Summarizing what the indicators are suggesting.
Oscillators
Neutral
SellBuy
Strong sellStrong buy
Strong sellSellNeutralBuyStrong buy
Oscillators
Neutral
SellBuy
Strong sellStrong buy
Strong sellSellNeutralBuyStrong buy
Summary
Neutral
SellBuy
Strong sellStrong buy
Strong sellSellNeutralBuyStrong buy
Summary
Neutral
SellBuy
Strong sellStrong buy
Strong sellSellNeutralBuyStrong buy
Summary
Neutral
SellBuy
Strong sellStrong buy
Strong sellSellNeutralBuyStrong buy
Moving Averages
Neutral
SellBuy
Strong sellStrong buy
Strong sellSellNeutralBuyStrong buy
Moving Averages
Neutral
SellBuy
Strong sellStrong buy
Strong sellSellNeutralBuyStrong buy
Displays a symbol's price movements over previous years to identify recurring trends.
Frequently Asked Questions
The current rate of USDHKD is 7.84928 HKD — it has decreased by 0.00% in the past 24 hours. See more of USDHKD rate dynamics on the detailed chart.
The value of the USDHKD pair is quoted as 1 USD per x HKD. For example, if the pair is trading at 1.50, it means it takes 1.5 HKD to buy 1 USD.
The term volatility describes the risk related to the changes in an asset's value. USDHKD has the volatility rating of 0.02%. Track all currencies' changes with our live Forex Heatmap and prepare for markets volatility.
The USDHKD showed a 0.01% rise over the past week, the month change is a 0.00% fall, and over the last year it has increased by 0.46%. Track live rate changes on the USDHKD chart.
Learn how you can make money on rate changes in numerous trading ideas created by our community.
Learn how you can make money on rate changes in numerous trading ideas created by our community.
Currencies are usually traded through forex brokers — choose the one that suits your needs and go ahead. You can trade USDHKD right from TradingView charts — just log in to you broker account. Check out the list of our integrated brokers and find the best one for your needs and strategy.
When deciding to buy or sell currency one should keep in mind many factors including current geopolitical situation, interest rates, and other. But before plunging into a deep research, you can start with USDHKD technical analysis. The technical rating for the pair is neutral today, but don't forget that markets can be very unstable, so don't stop here. According to our 1 week rating the USDHKD shows the buy signal, and 1 month rating is buy. See more of USDHKD technicals for a more comprehensive analysis.