USDJPYHello Traders! 👋
What are your thoughts on USDJPY?
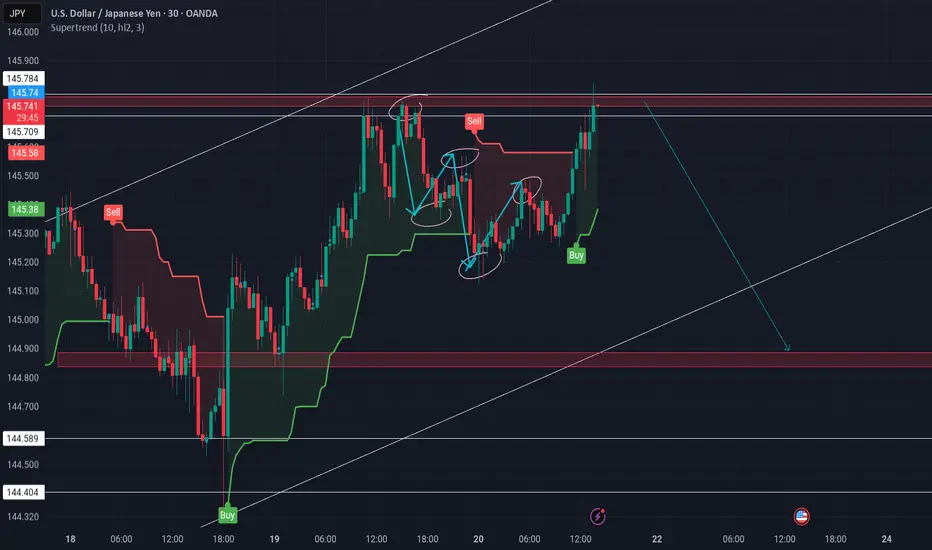
On the USD/JPY chart, price is currently moving within a symmetrical triangle pattern and is approaching the upper trendline and a key resistance zone.
We expect that upon testing this resistance level, price will likely fail to break above it and enter a bearish phase, potentially falling at least to the specified support level.
For higher-confidence sell entries, it’s recommended to wait for a confirmed downside break of the lower trendline of the triangle, which would validate a bearish continuation.
Will this resistance hold and trigger a drop, or will bulls take control? Share your thoughts below! 🤔👇
Don’t forget to like and share your thoughts in the comments! ❤️
USDJPY trade ideas

Lingrid | USDJPY Breakout Could Trigger Strong Bullish RallyFX:USDJPY is approaching a retest of the 144.20–144.30 support band after rebounding from a wedge breakdown and reclaiming structure within a broader ascending formation. Price remains under the downward trendline, but a successful bounce here could fuel another push toward 146. A higher low above 144.20 would confirm bullish intent.
📈 Key Levels
Buy zone: 144.20–144.40
Sell trigger: breakdown below 144.00
Target: 146.00
Buy trigger: breakout and hold above 145.00
💡 Risks
Rejection at the downward trendline limits upside potential
Failure to hold the 144.20 base could reverse the bullish structure
JPY strength from macro news could suppress breakout attempts
Traders, if you liked this idea or if you have your own opinion about it, write in the comments. I will be glad 👩💻

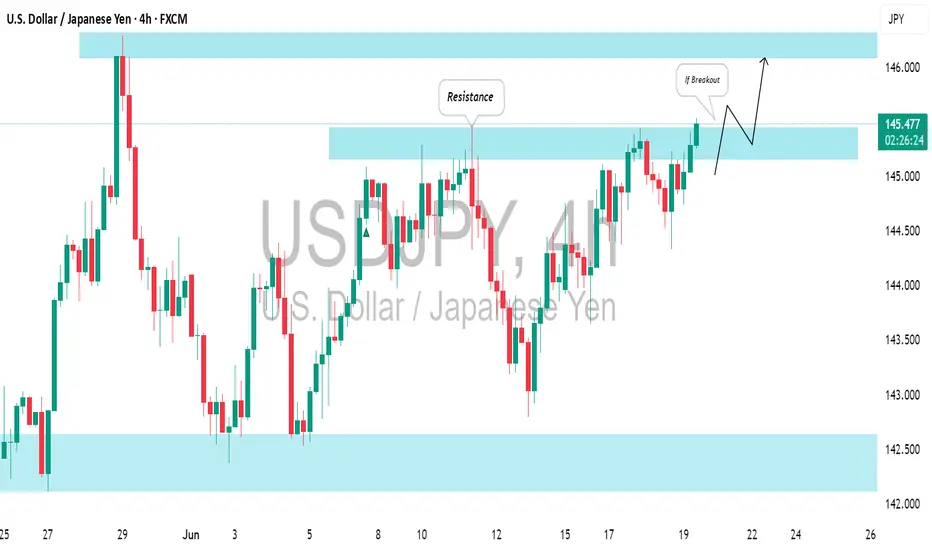
USDJPY: Waiting For a Breakout to Buy⚠️USDJPY is in a strong bullish trend on an intraday chart and is currently testing a significant horizontal resistance.
I'm looking for a breakout, specifically a 4-hour candle closing above it, to enter a buy position.
A bullish break of the highlighted blue area will provide a strong signal, potentially driving prices up to the 146.10 resistance level.
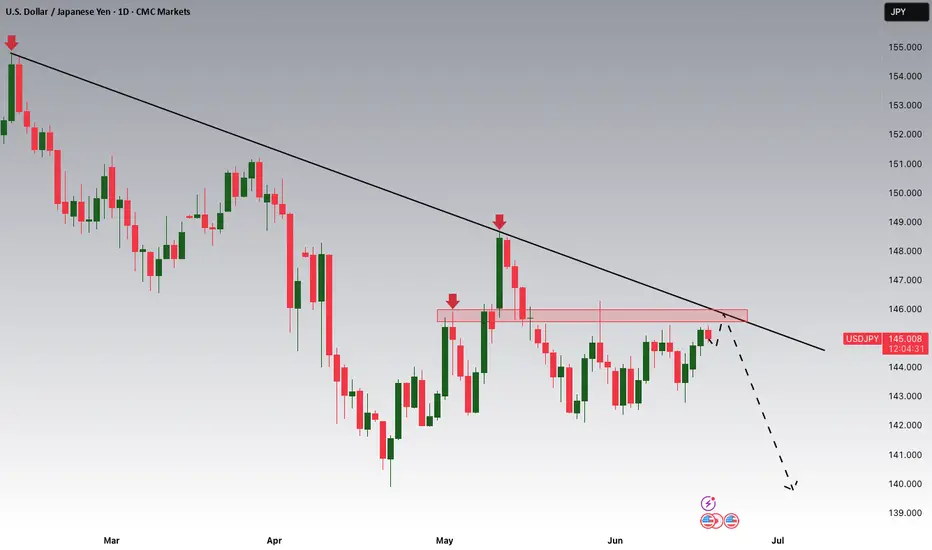
USD/JPY.1h chart pattern.(USD/JPY 1H), the price has broken below the rising channel, suggesting a bearish move ahead. Here are the two key target levels marked on My chart:
Targets:
1. First Target: Around 144.100
2. Second (Deeper) Target: Around 143.200
These levels align with previous support zones and measured moves from the channel breakdown.
Let me know if you’d like stop-loss or entry suggestions too.

Possible Sells on USDJPY Patiently waiting for price to get into my M15 Order Block then I'll enter a sell

USD/JPY) Bearish trend analysis Read The ChaptianSMC trading point update
Technical analysis iUSD/JPY on the 30-minute timeframe, showing a rejection from resistance zones and a potential move toward lower support levels.
---
Analysis Breakdown
Technical Components:
1. Resistance Zones:
Primary Resistance: Near 145.500 (upper yellow box), which has previously been rejected multiple times (red arrows).
FVG (Fair Value Gap) Resistance Level: Around 144.400, also acting as strong resistance, especially near the EMA 200.
2. Downtrend Line:
The price is moving below a downward trendline, respecting bearish structure.
Last rejection from both the trendline and FVG zone confirms selling pressure.
3. EMA 200 (144.075):
Price is hovering around this level, showing indecision.
Bearish bias remains unless price breaks and holds above it.
4. Target Zone:
A clearly marked support level around 142.543, shown as the bearish target.
Includes multiple event markers (potential news catalysts or key dates), suggesting added volatility.
5. RSI (14):
Currently near 55.23, with a prior rejection from higher RSI levels.
Bearish divergence not clear, but no overbought conditions.
---
Bearish Idea Summary:
Thesis: Rejection from resistance zones + trendline + EMA suggests continuation to downside.
Expecting: Price to either:
Retest the upper resistance zone (around 145.000–145.500) and reject again, or
Break below current levels and continue lower toward 142.543.
---
Trade Idea Concept:
Entry Option 1: Sell on confirmed rejection from FVG zone or upper resistance.
Entry Option 2: Sell on break and retest below 144.000.
Target: 142.543 (support zone).
Stop Loss: Above the resistance zone or trendline (e.g., >145.600).
Mr SMC Trading point
Risks to Watch:
Invalidation: Clean break and close above 145.500 would invalidate the bearish setup.
News Impact: Note the icons near the target zone – monitor economic releases around that time.
---
Please support boost 🚀 this analysis)

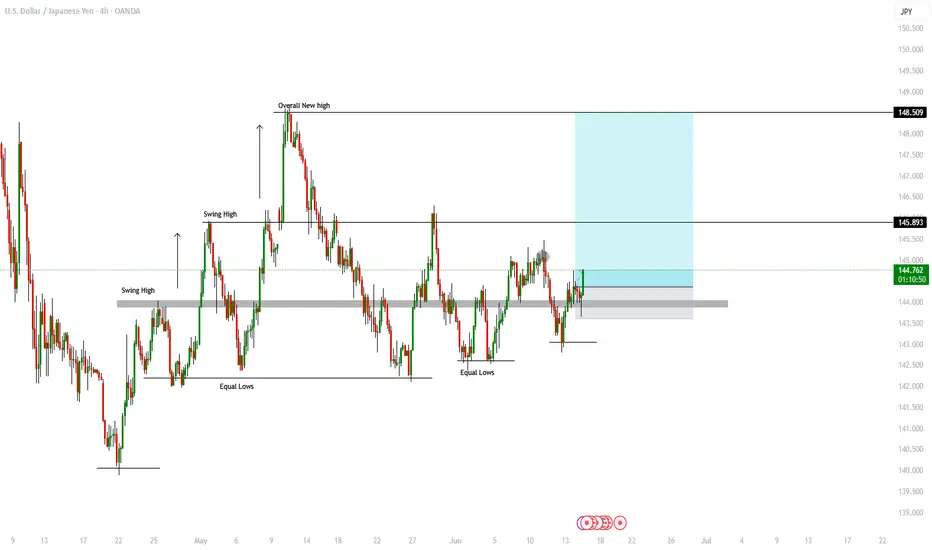
OANDA:USDJPY Buys SetupThe market has recently rebounded from a key support zone, showing strong bullish momentum and forming higher lows—a classic sign of accumulating demand. Price action suggests a potential breakout to the upside, possibly driven by liquidity resting above recent swing highs. If history is any guide, this pattern could signal further continuation in the direction of the trend.
Trade Setup (Risk Parameters):
Entry: 144.372
Stop Loss: 143.599
Target Levels:
Take Profit 1: 145.889
Take Profit 2: 148.508
This setup offers a favorable risk-to-reward ratio, aligning with recent market structure and momentum. As always, manage risk appropriately and monitor price action closely.
Let me know your thoughts in the comments. If this analysis resonates with your trading style, consider giving it a boost and follow for more high-probability setups. Stay disciplined and trade safe!
USDJPY Potential DownsidesHey Traders, in today's trading session we are monitoring USDJPY for a selling opportunity around 146.700 zone, USDJPY is trading in a downtrend and currently is in a correction phase in which it is approaching the trend at 146.700 support and resistance area.
Trade safe, Joe.

USDJPY Potential DownsidesHey Traders, in today's trading session we are monitoringUSDJPY for a selling opportunity around 145.700 zone, USDJPY is trading in a downtrend and currently is in a correction phase in which it is approaching the trend at 145.700 support and resistance area.
Trade safe, Joe.
USD/JPY) Bearish reversal analysis Read The captionSMC trading point update
Technical analysis of USD/JPY 3-hour chart suggests a bearish reversal setup, based on smart money concepts (SMC), resistance rejection, and price action structure. Here's a full breakdown:
Technical Breakdown – USD/JPY
Big Resistance Zone (~145.800–146.300):
Price has tapped into a major resistance zone (yellow box) twice (highlighted with red arrows).
Both rejections indicate strong seller interest.
The latest candle structure shows clear rejection wick, signaling weakness at resistance.
---
Bearish Bias Confirmation:
Bearish structure forming after the second rejection.
Break of the rising trendline could accelerate selling pressure.
A measured move projection (-2.58%) aligns the downside target with the support level at ~142.144.
---
Support Zone (~141.800–142.400):
Marked as the likely target zone.
Historically acted as a strong bounce area (visible from late May to early June).
Completion of ABC bearish structure aligns here.
---
Indicators & Tools:
200 EMA (144.419): Price currently slightly above it — watching for a close below to strengthen bearish view.
RSI (14): Shows signs of bearish divergence and cooling off from overbought (was above 70 previously).
Volume spike during the rejection suggests institutional selling.
Mr SMC Trading point
---
Forecast Summary:
Bias: Bearish toward 142.144
Entry Idea: Look for confirmation of breakdown below trendline (~145.00)
Invalidation: Strong bullish close above 146.300 would break this idea.
---
Please support boost 🚀 this analysis)

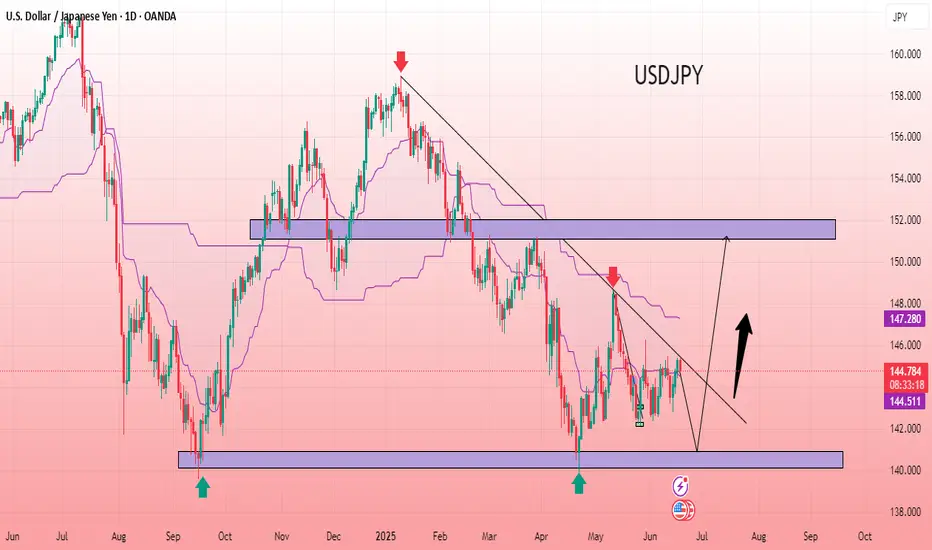
USD/JPY BULLISH SETUPThe USD/JPY daily chart indicates a potential bullish reversal setup. Price has been consolidating within a descending trendline and has recently bounced from a strong support zone around 140.000. The presence of multiple rejections from the lower support zone suggests buying interest. A breakout above the trendline confirms bullish momentum. The Ichimoku cloud is narrowing, indicating potential for trend shift. The market is eyeing a move towards the next resistance zone aligned near a previous supply area. Bullish confirmation with rising volume could fuel further upside. A break and hold above resistance may lead to further continuation in the coming sessions.
Entry Point: 142.100/141.000
Target Point: 151.110
If you found this analysis helpful, don’t forget to drop a like and comment. Your support keeps quality ideas flowing—let’s grow and win together! 💪📈
USDJPY – Bearish Pressure Builds Amid Fed Dovish ExpectationsFX:USDJPY is trading around the 145.300 mark and showing signs of weakness, as the US dollar comes under pressure from growing expectations that the Federal Reserve may begin cutting interest rates in September. This sentiment is fueled by recent soft US data, including weaker retail sales and industrial production.
Meanwhile, the Japanese yen is regaining some strength, supported by safe-haven demand amid geopolitical tensions in the Middle East and possible intervention signals from the Bank of Japan.
In the short term, I lean toward a corrective pullback scenario while awaiting clearer signals from the Fed.

Reason for SELL (USDJPY M30)1. [Strong Resistance Zone
Price reached a key resistance (red zone) that was rejected multiple times before.
USDJPY LONG Market structure bullish on HTFs DH
Entry at Daily AOi
Weekly Rejection At AOi
Daily Rejection at AOi
Previous Daily Structure point
Daily EMA Retest
Around Psychological Level 145.000
H4 EMA Retest
H4 Candlestick rejection
Rejection from Previous structure
Levels 3.67
Entry 95%
REMEMBER : Trading is a Game Of Probability
: Manage Your Risk
: Be Patient
: Every Moment Is Unique
: Rinse, Wash, Repeat!
: Christ is King.

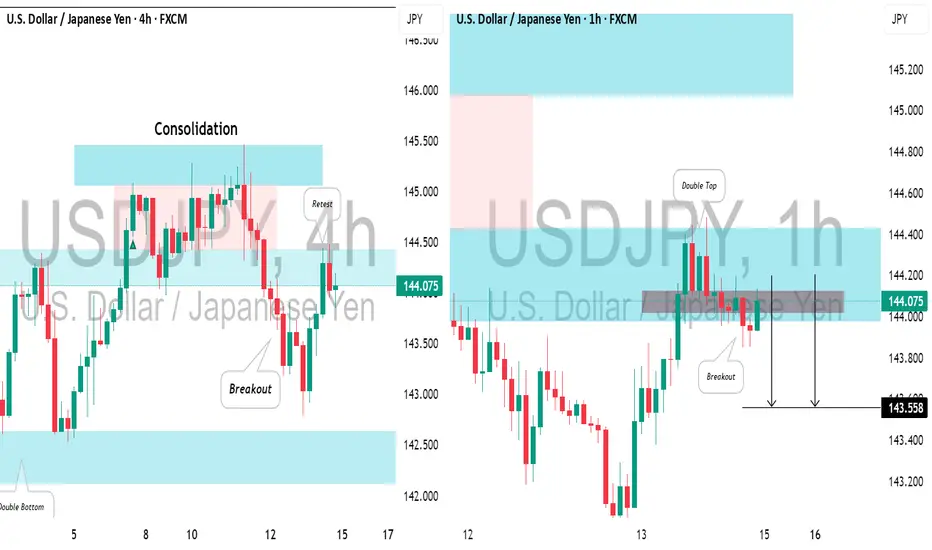
USDJPY: Intraday Bearish ConfirmationIn the middle of last week, I spotted a valid confirmed structure breakout on 📉USDJPY on a 4-hour timeframe.
Currently, the pair is retesting the broken structure, and the price has formed a strong bearish confirmation on the hourly chart.
I see a double top pattern and a violation of its neckline.
With high probability, the price will fall and reach the 144.02 level.
USD/JPY 4H Chart Analysis – Bullish Breakout Ahead?📈 USD/JPY 4H Chart Analysis – Bullish Breakout Ahead? 🚀💹
The USD/JPY pair is currently approaching a critical resistance zone (145.800 - 146.000), which has acted as a strong supply area in the past. The price has shown bullish momentum as it builds higher lows and heads toward this resistance.
🔍 Key Observations:
🔵 Resistance Zone: Clearly marked and tested multiple times. A breakout above this level could trigger a bullish continuation.
📊 Bullish Structure: The pair is forming a strong uptrend with higher highs and higher lows on the 4H timeframe.
🔄 Retest Scenario: Chart suggests a potential breakout above the resistance, followed by a bullish retest before continuing toward the target zone at ~148.900.
🟢 Upside Target: 148.900 (Previous swing high) – a potential gain of over 300 pips from breakout point.
📌 Trading Outlook:
✅ A confirmed breakout and retest of the resistance zone could offer a high-probability long setup.
❌ A failure to break and hold above the resistance may result in short-term consolidation or reversal.
📅 Watch Levels:
Resistance: 145.800 – 146.000
Support (breakout retest): 145.200 – 145.500
Bullish Target: 148.900
📢 Conclusion: Bulls are in control as long as price sustains above the resistance zone. A clean breakout followed by a retest could offer an attractive buying opportunity with a well-defined risk-to-reward setup. 🔥📊

USD/JPY breakthrough & long position? (novice analysis) #techFrom what I've seen so far, USD/JPY has the momentum to try to break through 146.093 and is heading towards 146-147.
The price could make a pullback around the first key level before breaking through, if not, I would anticipate the price making a retracement after breaking through
Hi, I'm not good at trading, and I'm still learning. I explore trading alone myself and also use online free sources to improve. If somewhere mistakes please notify me
Thank you.

NEXT WEEK CHECK USDJPY SIGNAL READ CAPTAINEntry: around 146.100)146.200 ✅
Take Profit 146.480 ✅
Take Profit :146.800 ✅
Last Target: 147.300✅
Stop Loss: 145.760❌

Re-defining Trading Psychology: A Functional ApproachRethinking Trading Psychology: A Functional Definition
Trading psychology is often misunderstood or overly simplified in trading discourse. Psychology, by definition, is the scientific study of the mind and behavior. When applied to trading, trading psychology should be defined as the study of how our mental processes directly influence market structure through behavior—specifically through the act of placing trades.
The Facts: How Humans Influence the Market
Traders interact with the market in only a few meaningful ways:
Placing entries
Setting stop losses
Setting take-profit (target) levels
Though external variables such as news events can impact decision-making, they only affect where we choose to interact with the market—they do not directly move price. Price only responds to order flow , and all order flow originates from trader decisions. Therefore, these three actions—entries, stops, and targets—are the only real mechanisms through which psychology influences price action.
Entry: The Initiator of Market Movement
Entries are typically based on structural cues like engulfing candles or order blocks —price zones where a shift in momentum is visible. These areas act as high-probability triggers that prompt traders to take action in a particular direction.
When enough buy orders are placed at a bullish signal, we see that reflected in the strength and size of bullish candles. Conversely, strong bearish signals generate concentrated sell-side pressure. This collective order flow initiates price movement—entries are the impulse drivers of the market.
Stop Losses: The Creation of Liquidity Pools
Once a position is opened, traders generally place stop losses behind significant structure—often just beyond the order block or engulfing pattern that prompted the entry. These zones become liquidity pools —clusters of pending orders that, when triggered, cause mass exits and reallocation of capital.
When price returns to these zones, it forces traders out of the market, often resulting in sharp movements or false breakouts. This behavior is not coincidental; it is a byproduct of shared psychological behavior manifesting as clustered risk management.
Take-Profits: Delayed Exit Pressure
Alongside stop losses, traders also define target levels where they plan to close their trades. These levels can be calculated based on fixed R-multiples (2R, 3R, etc.) or drawn from contextual zones like previous highs/lows or supply and demand areas.
As price moves into profit and hits these levels, traders begin to exit en masse. This diminishes order flow in the direction of the trade, often leading to hesitation or minor reversals—much like stop losses do when they are hit.
Conclusion: Market Movement vs. Market Stalling
To summarize:
Entries drive market movement
Stop losses and target levels stall or reverse movement
This dynamic defines how human behavior—guided by psychological patterns—actually shapes price. In this framework, engulfments represent entry logic , while liquidity zones represent collective exit logic .
Redefining Trading Psychology
Contrary to popular belief, trading psychology isn’t just about “staying disciplined” or “keeping emotions in check.” While emotional control matters, it’s secondary to understanding how trader behavior creates cause-and-effect loops in price action.
Having a trading plan is important—but deviating from that plan is not always due to emotion alone. It can stem from overconfidence, impulsivity, cognitive bias, or poor conditioning. These are psychological behaviors that affect execution, and thus, affect market movement.
What’s Next
In my next writing, I will explore how the sheer volume of market participants leads to herding behavior —the collective patterns that emerge from mass psychology and their role in creating consolidation zones, liquidity traps, and false breakouts.

Analysis of Trades and Trading Tips for the Japanese YenThe price test at 144.27 occurred when the RSI indicator had already moved significantly above the zero line, but the strong U.S. labor market data offered a high probability of the dollar strengthening against the yen, which I decided to take advantage of. As a result, the pair rose toward the target level of 145.06.
The confident growth in U.S. non-farm employment recorded in May exceeded experts' expectations' causing noticeable fluctuations in currency, markets. The publications of data showing the creation of 139,7000 new jobs versus the forecasted 127,000 instantly strengthened the U.S. dollar, putting pressure on the Japanese yen. The yen's reaction to the news was immediate: the currency weakened significantly against the dollar. Investors perceived the data as a signal of the strength of the U.S. economy and the likely continuation of Federal Reserve's tight monetary policy. Furthermore, the stable unemployment rate in the U.S. recorded at 4.2%, also reinforced the market's optimistic sentiment.
Today's data shows that Japan's GDP for the first quarter was revised upward, which helped the yen recover slightly from Friday's losses against the U.S. dollar. However, despite the positive revision, Japan's economy still faces serious challenges. Weak domestic demand and an aging population continue to pressure growth, while geopolitical uncertainty poses additional obstacles. The Bank of Japan maintains a wait-and-see approach and has no plans to raise interest rates for now, which had previously provided good support to the the yen. Strong growth in bank lending also contributed to increased demand for the yen.

USDJPY Poised for a BreakoutUSDJPY Poised for a Breakout
On the 4-hour chart, USDJPY is not yet taking a clear direction. The price is showing the possibility of both movements.
With the current data we can see that USDJPY is forming a triangle pattern and only the breakdown up or down will show the direction of the price.
However, I think the chances are higher for the bullish movement considering that the geopolitical tension in the Middle East is also very high and the USD remains one of the strongest currencies.
Bullish target: 147.90
Bearish target: 140.90
⚠️ Note: If the pattern transforms more than this triangle, then we may be in a different situation and everything may be invalid. The analysis may change over time.
You may find more details in the chart!
Thank you and Good Luck!
❤️PS: Please support with a like or comment if you find this analysis useful for your trading day❤️
Disclosure: I am part of Trade Nation's Influencer program and receive a monthly fee for using their TradingView charts in my analysis.

USDJPY – Triangle Complete? Wave (v) Setup BuildingWave (iv) appears to be ending with an (e) wave tag into the 0.764 retracement.
📉 Price remains capped within the contracting triangle — watching closely for breakdown confirmation.
If this plays out, wave (v) of C could now begin unfolding with initial focus on 140.00 and below.
🧩 Structure: (a)-(b)-(c)-(d)-(e) triangle complete
📏 Final wave (e) aligns with 0.764 retracement and structural resistance
⚠️ RSI divergence + weakening momentum support the bearish scenario

Short term sell into buying zone.USDJPY is at a prime zone... Where everyone is glued and carried away with the bullish move, let me point you out to the market structure.
