USDJPYHello Traders! 👋
What are your thoughts on USDJPY?
On the USD/JPY chart, price is currently moving within a symmetrical triangle pattern and is approaching the upper trendline and a key resistance zone.
We expect that upon testing this resistance level, price will likely fail to break above it and
About U.S. Dollar / Japanese Yen
Also known as trading the “gopher” the USDJPY pair is one of the most traded pairs in the world. The value of these currencies when compared to each other is affected by the interest rate differential between the Federal Reserve and the Bank of Japan.
Related currencies

Lingrid | USDJPY Breakout Could Trigger Strong Bullish RallyFX:USDJPY is approaching a retest of the 144.20–144.30 support band after rebounding from a wedge breakdown and reclaiming structure within a broader ascending formation. Price remains under the downward trendline, but a successful bounce here could fuel another push toward 146. A higher low above

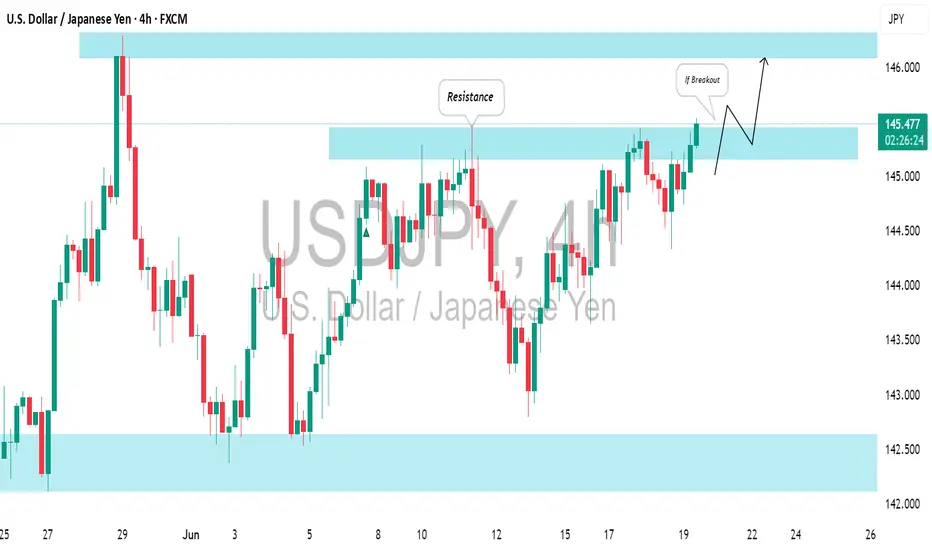
USDJPY: Waiting For a Breakout to Buy⚠️USDJPY is in a strong bullish trend on an intraday chart and is currently testing a significant horizontal resistance.
I'm looking for a breakout, specifically a 4-hour candle closing above it, to enter a buy position.
A bullish break of the highlighted blue area will provide a strong signal,
USD/JPY) Bearish trend analysis Read The ChaptianSMC trading point update
Technical analysis iUSD/JPY on the 30-minute timeframe, showing a rejection from resistance zones and a potential move toward lower support levels.
---
Analysis Breakdown
Technical Components:
1. Resistance Zones:
Primary Resistance: Near 145.500 (upper yellow box

USD/JPY.1h chart pattern.(USD/JPY 1H), the price has broken below the rising channel, suggesting a bearish move ahead. Here are the two key target levels marked on My chart:
Targets:
1. First Target: Around 144.100
2. Second (Deeper) Target: Around 143.200
These levels align with previous support zones and measured m

Possible Sells on USDJPY Patiently waiting for price to get into my M15 Order Block then I'll enter a sell

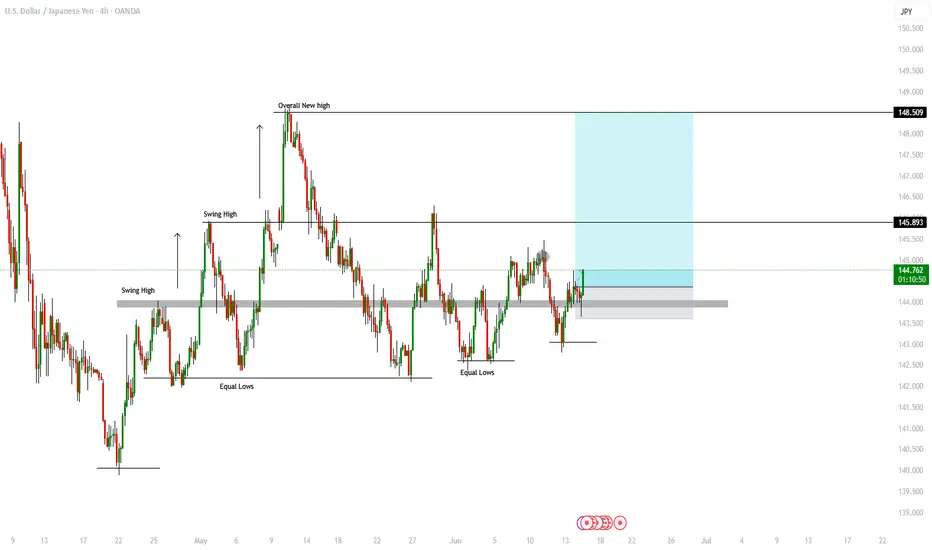
OANDA:USDJPY Buys SetupThe market has recently rebounded from a key support zone, showing strong bullish momentum and forming higher lows—a classic sign of accumulating demand. Price action suggests a potential breakout to the upside, possibly driven by liquidity resting above recent swing highs. If history is any guide,
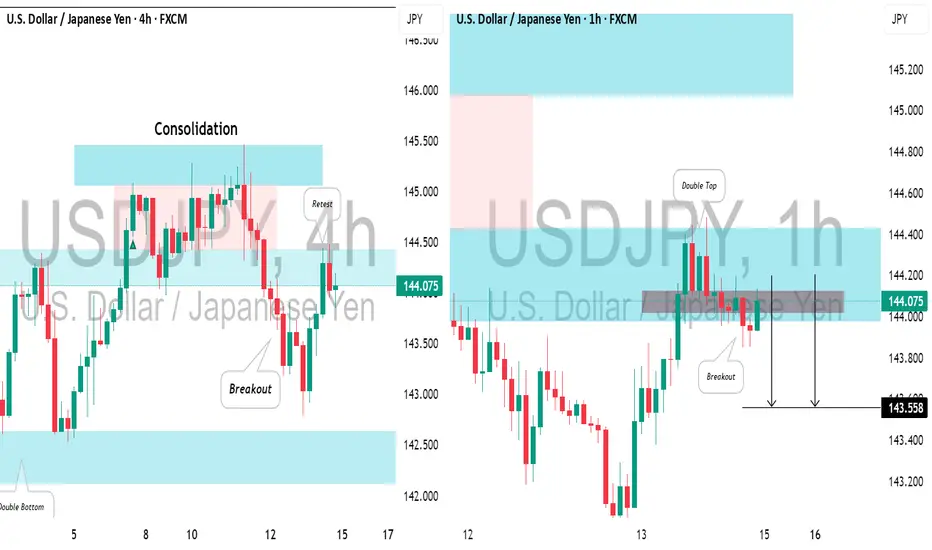
USDJPY: Intraday Bearish ConfirmationIn the middle of last week, I spotted a valid confirmed structure breakout on 📉USDJPY on a 4-hour timeframe.
Currently, the pair is retesting the broken structure, and the price has formed a strong bearish confirmation on the hourly chart.
I see a double top pattern and a violation of its neckli
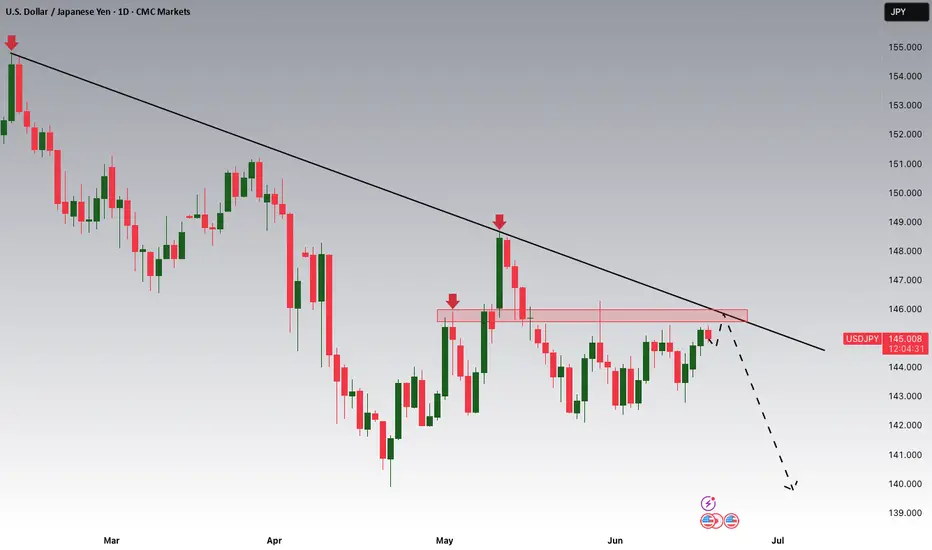
USDJPY Potential DownsidesHey Traders, in today's trading session we are monitoringUSDJPY for a selling opportunity around 145.700 zone, USDJPY is trading in a downtrend and currently is in a correction phase in which it is approaching the trend at 145.700 support and resistance area.
Trade safe, Joe.
Re-defining Trading Psychology: A Functional ApproachRethinking Trading Psychology: A Functional Definition
Trading psychology is often misunderstood or overly simplified in trading discourse. Psychology, by definition, is the scientific study of the mind and behavior. When applied to trading, trading psychology should be defined as the study of h

See all ideas
Displays a symbol's price movements over previous years to identify recurring trends.
Frequently Asked Questions
The value of the USDJPY pair is quoted as 1 USD per x JPY. For example, if the pair is trading at 1.50, it means it takes 1.5 JPY to buy 1 USD.
USDJPY is a major currency pair, i.e. a popular currency paired with USD.
Currencies are usually traded through forex brokers — choose the one that suits your needs and go ahead. You can trade USDJPY right from TradingView charts — just log in to you broker account. Check out the list of our integrated brokers and find the best one for your needs and strategy.