USDJPY: Bullish Continuation After Breakout📈 USDJPY is set to increase further in price after breaking through a significant daily/intraday horizontal resistance.
The next target is 147.81.
USDJPY trade ideas

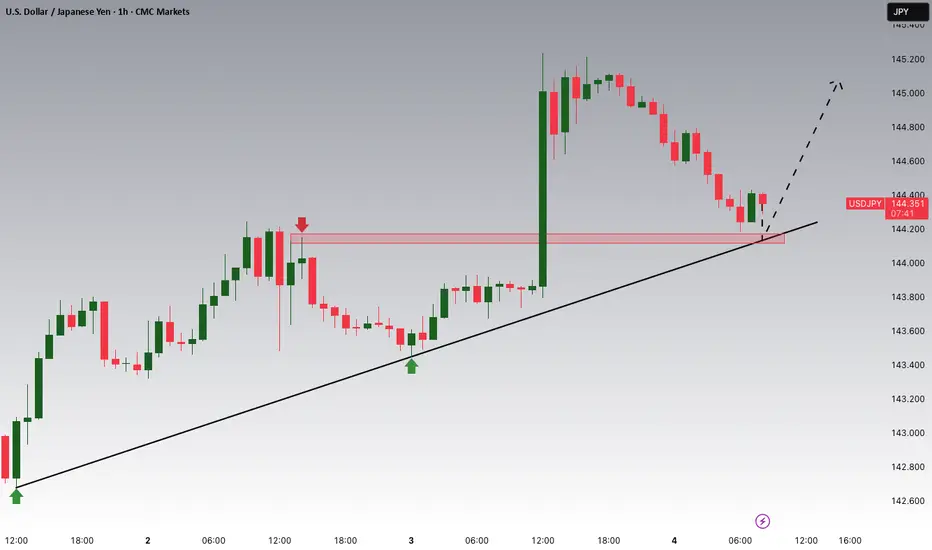
USD/JPY - H1- Wedge Breakout (07.07.2025)The USD/JPY pair on the H1 timeframe presents a Potential Buying Opportunity due to a recent Formation of a Wedge Breakout Pattern. This suggests a shift in momentum towards the upside and a higher likelihood of further advances in the coming hours.
Possible Long Trade:
Entry: Consider Entering A Long Position around Trendline Of The Pattern.
Target Levels:
1st Resistance – 148.00
🎁 Please hit the like button and
🎁 Leave a comment to support for My Post !
Your likes and comments are incredibly motivating and will encourage me to share more analysis with you.
Best Regards, KABHI_TA_TRADING
Thank you.
Disclosure: I am part of Trade Nation's Influencer program and receive a monthly fee for using their TradingView charts in my analysis.

BULLISH H4 MOMENTUM ACTIVATED...?📊 Pattern & Structure:
The chart shows a downward channel (falling wedge) pattern that has recently been broken to the upside, indicating a bullish breakout.
The breakout is clean, with a sharp upward move, confirming the reversal from the bearish trend.
🔍 Key Levels Identified:
Support Zone:
142.284 – 141.790 (marked with an orange box)
This zone acted as a strong demand/support area.
Price bounced strongly after reaching this zone.
Immediate Resistance Levels:
145.799 – Near-term resistance.
147.000 – 147.629 – Key resistance zone (highlighted with a red horizontal line).
148.725 – Final bullish target/resistance on the chart.
📈 Bullish Scenario (highlighted with arrows and wave projection):
Price has broken out of the falling wedge, retested, and is pushing higher.
Target zone: 147.000–148.725.
The chart suggests a bullish projection, with further gains expected if the price sustains above 145.47.

USD/JPY) Bullish trend analysis Read The captionSMC trading point update
Technical analysis of USD/JPY on the 4-hour timeframe, signaling a breakout and possible rally toward the 151.016 target zone. Here's the detailed breakdown:
---
Technical Analysis – USD/JPY (4H)
1. Bullish Structure Breakout
Price has broken above a long-term resistance trendline, indicating a bullish breakout from a rising wedge or ascending channel.
The breakout is confirmed by bullish momentum and sustained price action above the previous highs.
2. Trendline + EMA Confluence
Price remains well above the 200 EMA (145.143), reinforcing the bullish bias.
A clear higher low was formed at the inner trendline (support), followed by strong upside moves.
3. RSI Strength
RSI is around 63.16, indicating strong bullish momentum without being overbought yet.
Suggests more upside potential while maintaining healthy trend conditions.
4. Price Target Projection
The chart shows two upward extensions:
First move projected ~+2.20%, indicating a measured move target around 149.7.
Final target point is 151.016, based on previous price action extension and resistance level.
Mr SMC Trading point
---
Summary
Bias: Bullish
Current Price: 147.366
Key Support: Rising trendline + 145.143 EMA
Targets:
Short-term: ~149.7
Final: 151.016
RSI: Strong but not overbought (63.16)
Invalidation: Break below the inner trendline support and EMA (below 145.00)
Please support boost 🚀 this analysis)

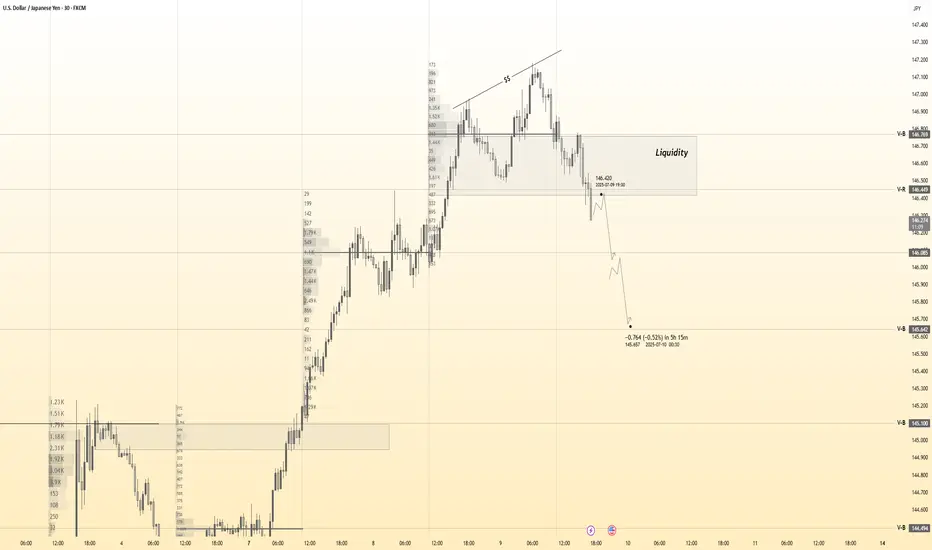
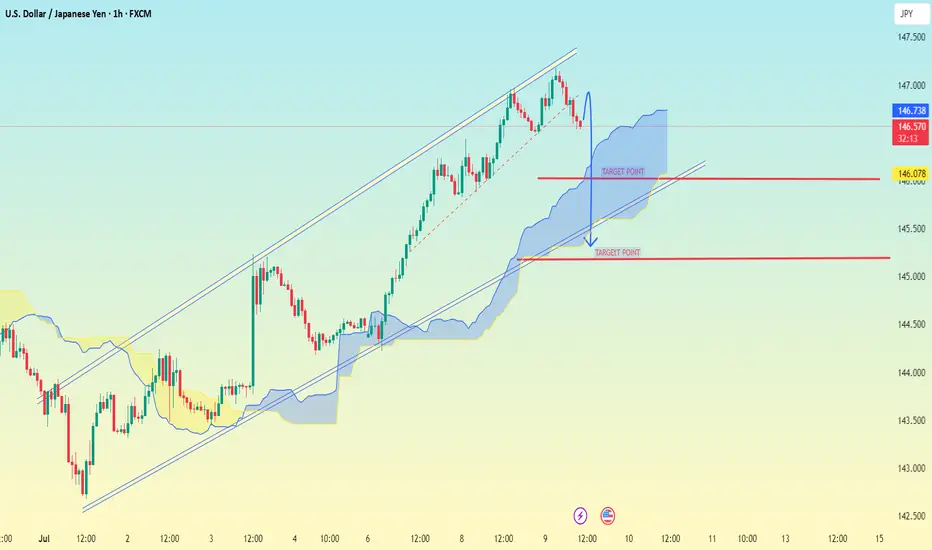
USD/JPY 1H chart PATTERNUSD/JPY 1H chart, the pair has broken below an ascending channel, which is typically a bearish signal. The price is currently inside the Ichimoku cloud, indicating uncertainty, but a breakdown seems likely.
📉 Bearish Target Points:
1. First Target:
✅ 146.078 — Near the bottom edge of the Ichimoku cloud and a horizontal support level.
2. Second Target:
✅ 145.300 — Clear support zone below the cloud, also aligns with previous consolidation area.
---
🔎 Additional Notes:
A breakdown below the Ichimoku cloud will confirm stronger bearish momentum.
Watch for a retest of the lower trendline or cloud support before a deeper drop.
Use stop-loss above 146.80 to manage risk if you're trading this setup.
Let me know if you want a buy/sell entry recommendation or SL/TP planning.
USDJPY : More Upside Ahead?USDJPY : More Upside Ahead?
USDJPY remains firmly in a bullish trend, largely driven by renewed tariff concerns.
The yen weakened sharply after U.S. President Donald Trump reaffirmed plans to impose 25% tariffs on Japanese goods starting August 1st.
Since that announcement, USDJPY has rallied nearly 200 pips before encountering some profit-taking.
Despite the brief pause, the broader trend remains intact, and the pair appears poised for further gains.
Key upside targets to watch:
146.95
147.80
148.40
You may find more details in the chart!
Thank you and Good Luck!
PS: Please support with a like or comment if you find this analysis useful for your trading day
Disclosure: I am part of Trade Nation's Influencer program and receive a monthly fee for using their TradingView charts in my analysis.

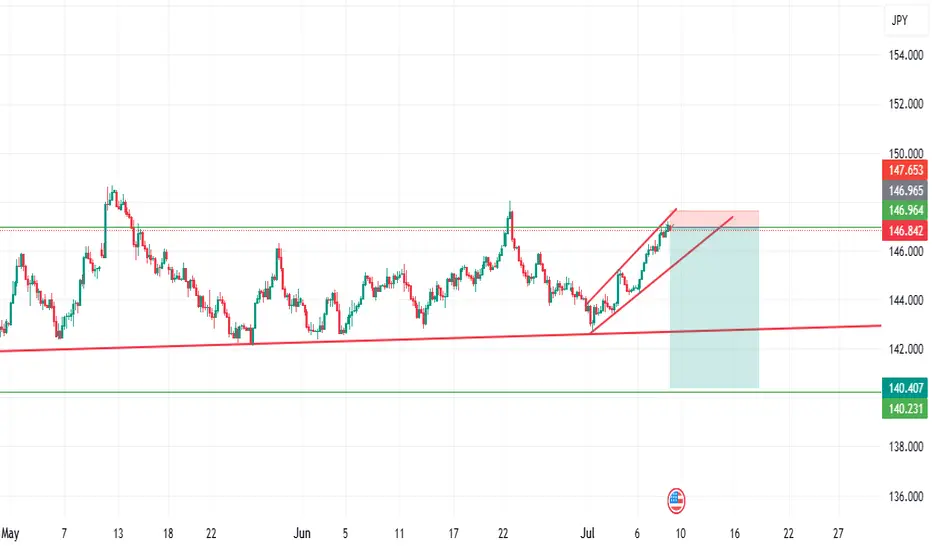
Lingrid | USDJPY Pullback From the Key Resistance ZoneThe price perfectly fulfilled my previous idea . FX:USDJPY is moving inside an upward channel after reclaiming support near 145.25 and breaking out from its previous range. The pair printed a higher low and is now approaching resistance around 146.78, testing the upper boundary of the ascending channel. If it fails to break through the red resistance trendline, a retracement toward the 145.25–145.00 support is likely.
📈 Key Levels
Buy zone: 146.78 - 147.00
Sell trigger: rejection from 146.78 and lower high below resistance
Target: 145.25
Buy trigger: bullish breakout above 147.00 with momentum confirmation
💡 Risks
Price rejection near 146.78 may cause a sharp pullback
A surge above 147.00 breaks trendline structure
Market reaction to macro data could distort short-term pattern
If this idea resonates with you or you have your own opinion, traders, hit the comments. I’m excited to read your thoughts!

USDJPY h4 strongly downBearish Expectation Disruption / Bullish Counterpoint
Resistance (147.5) Rejection and drop Breakout and continuation toward 148.5+
Breakout FVG Fakeout and reversal True breakout — bullish trend continues
Bullish Zone (~144) Clean break below Accumulation zone, strong buying interest may emerge
Target (~143) Next leg down May not be reached if price stabilizes above 145
Support (~142.5) Final drop destination Could become irrelevant if trend flips decisively bullish Original Assumption: Market is behaving in isolation from fundamentals.
Disruption: If U.S. data (e.g., strong NFP, CPI, or Fed commentary) supports rate hikes, USD/JPY may remain bid and breakout to 148+ instead of reversing.
Watch For: Strong dollar narrative or dovish BOJ language.

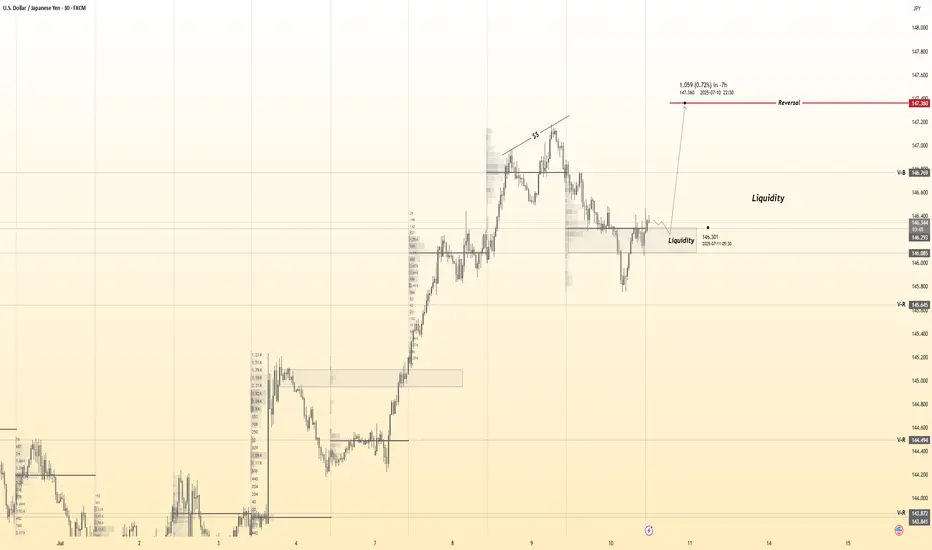
10.07.25 Morning ForecastPairs on Watch -
FX:USDJPY (live position)
FX:EURNZD
FX:EURUSD
A short overview of the instruments I am looking at for today, multi-timeframe analysis down to what I will be looking at for an entry. Enjoy!

USDJPY 30Min Engaged ( Bullish Entry Detected )➕ Objective: Precision Volume Execution
Time Frame: 30-Minute Warfare
Entry Protocol: Only after volume-verified breakout
🩸 Bullish Break : 145.100
➗ Hanzo Protocol: Volume-Tiered Entry Authority
➕ Zone Activated: Dynamic market pressure detected.
The level isn’t just price — it’s a memory of where they moved size.
Volume is rising beneath the surface — not noise, but preparation.
🔥 Tactical Note:
We wait for the energy signature — when volume betrays intention.
The trap gets set. The weak follow. We execute.
USDJPY Price Accumulated|Time For Bullish Distribution|Setupsfx|The price has accumulated nicely and is now distributing. We have three targets in mind, but set your own based on your analysis. Our approach is purely technical, but also includes a basic fundamental approach. This analysis concludes over 1500 pips and is a swing move. Please use this analysis as educational purposes only, as it does not guarantee that price will move exactly as predicted.
If you like our idea, please consider liking and commenting on it.
Good luck and trade safely!
Team Setupsfx_

USDJPY ENTRY CHARTWe are still bullish on this pair, the JPY is still WEAK, and the trend on this Pair is BULLISH, price is sitting on a ZONE, we have our LTF confirmation set also, You can add to watch-list if this matches with your trade idea on this pair, and as for us, we advise you move BREAK-EVEN after price move +1r. THANK YOU.

USDJPY – Key Support Bounce with Macro TailwindsUSDJPY is bouncing off a key trendline and 61.8% Fib zone (143.25–143.60) with confluence across multiple JPY crosses (EURJPY, AUDJPY, CADJPY). This area has historically triggered strong upside momentum, and the current setup aligns with both technical structure and macro drivers.
📊 Fundamentals Supporting the Move:
✅ US Yields Stable: US10Y is holding above 4.20%, keeping USDJPY supported. If yields push back toward 4.30%, expect USDJPY to retest 145.30 and potentially 147.80.
✅ BoJ Dovish: Japan shows no shift in policy. Despite weak Tankan data, BoJ remains patient, and no meaningful rate hike or YCC change is expected soon.
✅ USD Macro Resilience: Core PCE held firm at 2.6%. Focus now shifts to ISM Services PMI (Wed) and NFP (Fri). Markets are still pricing a soft landing – supporting risk-on and a stronger USD.
✅ JPY as a Fading Safe Haven: Even with geopolitical headlines (Trump tariff tensions, Taiwan, Middle East), JPY demand remains weak. Traders are favoring USD and Gold over JPY as risk hedges.
⚠️ Risks to Watch:
Dovish US Data Surprise: Weak NFP or ISM could drag yields down and trigger USDJPY reversal.
Verbal or Actual BoJ Intervention: If we approach 148.50–150, Japan may step in again.
Geopolitical Escalation: Any sharp risk-off could trigger safe haven demand for JPY, though this has underperformed recently.
🔎 Correlation Dynamics:
📈 USDJPY is leading JPY crosses like EURJPY and AUDJPY. The recent bounce started simultaneously across the JPY complex, with USDJPY slightly ahead.
📉 If US yields drop or risk sentiment shifts, USDJPY may lag gold or bonds but eventually catch up.
🧠 Trading Plan:
📍 Entry Zone: 143.30–143.60 (trendline + Fib confluence)
🎯 Target 1: 145.30 (38.2% Fib)
🎯 Target 2: 147.80 (channel resistance)
🛑 Invalidation: Daily close below 141.50 with US yields breaking down
📅 Upcoming Events to Watch:
Wed July 3: ISM Services PMI (key for USD reaction)
Fri July 5: US Non-Farm Payrolls + Average Hourly Earnings
JPY Risk: Verbal intervention possible near 148+
🧭 Summary:
USDJPY is positioned for a bullish continuation, backed by:
Rising yields
Resilient US macro
Weak JPY fundamentals
Technical structure respecting trendline support
Short-term traders can target the 145–147.80 range ahead of NFP, with a tight eye on yield and risk sentiment.
📌 If this analysis helps, drop a like and follow for more real-time macro-technical breakdowns. Stay nimble ahead of NFP! 🧠📈

USDJPY SELLWe have officially gotten a change of trend as proven by the transition from a sequence of higher highs and higher lows to a lower low and lower high. Stacked on top of this sequence is a pullback for a retest of a key level confirming our setup.

USDJPY is about to sellFrom my analysis, we can see that usdjpy is about to sell... because of the bearish signal ... wait for breakout for confirmation. Trade responsibly. Goodluck
USDJPY Will Go Down! Sell!
Here is our detailed technical review for USDJPY.
Time Frame: 1D
Current Trend: Bearish
Sentiment: Overbought (based on 7-period RSI)
Forecast: Bearish
The market is approaching a significant resistance area 146.736.
Due to the fact that we see a positive bearish reaction from the underlined area, I strongly believe that sellers will manage to push the price all the way down to 144.416 level.
P.S
We determine oversold/overbought condition with RSI indicator.
When it drops below 30 - the market is considered to be oversold.
When it bounces above 70 - the market is considered to be overbought.
Disclosure: I am part of Trade Nation's Influencer program and receive a monthly fee for using their TradingView charts in my analysis.
Like and subscribe and comment my ideas if you enjoy them!

USDJPY 30Min Engaged ( Bullish Entry Detected )➕ Objective: Precision Volume Execution
Time Frame: 30-Minute Warfare
Entry Protocol: Only after volume-verified breakout
🩸 Bullish From now Price : 146.350
➗ Hanzo Protocol: Volume-Tiered Entry Authority
➕ Zone Activated: Dynamic market pressure detected.
The level isn’t just price — it’s a memory of where they moved size.
Volume is rising beneath the surface — not noise, but preparation.
🔥 Tactical Note:
We wait for the energy signature — when volume betrays intention.
The trap gets set. The weak follow. We execute.
USDJPY Potential UpsidesHey Traders, in today's trading session we are monitoring USDJPY for a buying opportunity around 144.100 zone, USDJPY is trading in an uptrend and currently is in a correction phase in which it is approaching the trend at 144.100 support and resistance area.
Trade safe, Joe.
11.07.25 USDJPY Trade Recap + Re-Entry for +2.5%A long position taken on USDJPY for a breakeven, followed by a premature re-entry that I took a loss on. I also explain the true re-entry I should have taken for a 2.5% win.
Full explanation as to why I executed on these positions and also more details around the third position that I did not take.
Any questions you have just drop them below 👇

Forex Market Depth Analysis and Trading StrategiesForex Market Depth Analysis and Trading Strategies
Forex market depth analysis offers traders a deeper understanding of currency market dynamics. It reveals the real-time volume of buy and sell orders at different prices, which is crucial for assessing liquidity and trader sentiment. This article explores how to analyse and use market depth for trading, discussing various strategies and their limitations.
Forex Market Depth Explained
Market depth meaning is the volume of buy and sell orders at different price levels. It's a real-time snapshot of the pair’s liquidity and depth of supply (sell orders) and demand (buy orders). Traders use this information to gauge the strength and direction of a currency pair.
This depth is typically represented through an order book, displaying a currency pair’s existing orders at various price points. This book lists the number of units being bid or offered at each point, giving us insight into potential support and resistance levels. For instance, a large number of buy orders at a certain price level may indicate a strong support area, suggesting that many traders are willing to purchase the currency pair at this price.
Understanding market depth is crucial in assessing the likelihood of trades being executed at desired prices, especially in fast-moving currencies or when trading large volumes. It may help in identifying short-term price movements, offering a more nuanced view of an asset beyond just candlestick charts.
How to Analyse Market Depth
Analysing order flow is a fundamental aspect of market depth trading, providing traders with valuable insights into the supply and demand dynamics of forex pairs. Forex market depth can be assessed using various tools and indicators.
One key tool is the Depth of Market (DOM), which shows the number of buy and sell orders pending at different prices. DOM offers a visual representation of the currency pair’s order book, highlighting potential areas where large orders are placed. We can use such information to identify significant support and resistance levels where the pair might experience a turnaround.
Another essential tool is Level II quotes. These quotes provide detailed information about the price, volume, and direction of every trade executed in real-time. By analysing Level II quotes, traders may be able to identify the pair’s momentum and potential trend shifts. For example, if there is a sudden increase in sell orders at a particular price, it may indicate a potential downward movement, prompting us to adjust our positions accordingly.
Strategies Using Market Depth Analysis
In forex trading, market depth analysis is a crucial tool for understanding and executing a depth of market strategy. Here's how traders can leverage this type of analysis in their strategies:
Scalping Strategy
By closely observing the DOM, scalpers can identify minor price movements and liquidity gaps. For instance, if the DOM shows a large number of sell orders at a slightly higher price, a scalper might open a short position, anticipating a quick downturn. This strategy relies on fast, short-term trades, capitalising on small price changes.
Momentum Trading
Momentum traders use the order book to gauge the strength of a trend. By analysing the order flow and volume, they can determine if a trend is likely to continue or reverse. For example, a surge in buy orders at increasing prices may signal a strong upward momentum, prompting a trader to enter a long position. Conversely, a build-up of sell orders might indicate a potential downward trend.
Support and Resistance Trading
Depth analysis is invaluable for identifying key support and resistance levels. Clusters of orders often act as barriers, influencing price movements. Traders may use these levels to set entry and exit points. For example, a large number of buy orders at a specific price may indicate a strong support zone, reflecting a potentially good entry point for a long position.
Breakout Trading
Traders seeking breakout opportunities can use market depth to spot potential breakout points. A significant accumulation of orders just beyond a known resistance or support level may indicate a potential breakout. If the pair moves past these areas with high volume, it could signal the start of a new trend, potentially offering a lucrative trading opportunity.
Integrating Market Depth with Technical Analysis
Integrating a depth chart trading strategy with technical analysis may enhance decision-making, combining the real-time insights of depth charts with the power of technical indicators. For instance, we can use market depth to confirm signals from technical analysis tools.
If a moving average crossover suggests a bullish trend, a corresponding increase in buy orders in the depth chart may reinforce the signal. Similarly, a significant resistance level identified through technical analysis, such as a Fibonacci retracement level, might be substantiated if there’s a large accumulation of sell orders at that price point.
Risks and Limitations of Market Depth Analysis
While market depth analysis is a valuable tool in forex trading, it comes with certain risks and limitations:
- Dynamic and Fast-Changing Data: Order book data is highly dynamic, often changing within seconds, making it challenging to base long-term strategies solely on such information.
- Lack of Centralisation in Forex: Unlike stock exchanges, the forex market lacks a centralised exchange. This decentralisation means depth data might not represent the entire marketplace accurately.
- Susceptibility to 'Spoofing': Large players might place and quickly withdraw large orders to manipulate market depth perception, misleading other traders. It’s worth noting that spoofing is illegal in many jurisdictions.
- Limited Usefulness in Highly Liquid Markets: In highly liquid pairs, the depth of market data may become less relevant, as large orders are quickly absorbed without significantly impacting prices.
- Dependency on Broker's Data: The reliability of order book data depends on the broker's technology and the size of their client base, which can vary widely.
The Bottom Line
Market depth analysis provides critical insights for forex traders, though it's vital to recognise its dynamic nature and limitations. Integrating it with technical analysis may create robust trading strategies.
This article represents the opinion of the Companies operating under the FXOpen brand only. It is not to be construed as an offer, solicitation, or recommendation with respect to products and services provided by the Companies operating under the FXOpen brand, nor is it to be considered financial advice.

USD/JPY) back down Trend Read The captionSMC trading point update
Technical analysis of USD/JPY (U.S. Dollar / Japanese Yen) on the 3-hour timeframe, anticipating a rejection from a descending trendline resistance and a move down toward key support levels.
---
Analysis Overview:
Trend Bias: Bearish correction expected
Structure: Price is reacting at a descending trendline, which has held as resistance on multiple occasions.
Indicators:
EMA 200 (144.756): Price is currently above, but projected to break below it.
RSI (14): Overbought at ~74, signaling potential for a reversal.
---
Key Technical Components:
1. Descending Trendline Resistance:
Price is approaching/has touched a well-respected downtrend line, marked by three strong rejections (red arrows).
This trendline has consistently capped bullish moves, indicating strong seller interest.
2. Bearish Reversal Expectation:
The projected path suggests a potential fake breakout or double-top, followed by a steep decline.
A two-stage drop is anticipated, with price first targeting the EMA 200 zone, then extending lower.
3. Target Points:
First target: Around 145.244, near EMA 200.
Final target: 143.048, aligning with the key support zone (highlighted in yellow), where price previously bounced.
4. RSI (14):
Currently overbought (73.29), signaling a likely retracement.
Prior peaks at this level led to notable corrections.
---
Trade Setup Idea:
Parameter Level
Entry Near current price (~146.85) if bearish pattern confirms
Stop-Loss Above trendline (~147.30–147.50)
Target 1 145.24 (EMA 200 zone)
Target 2 143.05 (Support zone)
This setup offers a high-probability short opportunity if resistance holds.
---
Risk Factors:
Upcoming economic events could trigger volatility (news icon marked).
A clean breakout and close above the trendline (~147.50+) would invalidate this bearish thesis.
Mr SMC Trading point
---
Summary:
The analysis suggests a potential USD/JPY reversal from a descending trendline, supported by overbought RSI and prior rejections. The bearish projection targets a move toward 143.048, following a dip below the EMA 200 level at 145.244.
Please support boost 🚀 this analysis)

USDJPY: Up to +2000 Pips Move! Stay Tuned USDJPY has been accumulating for a long time, and we are confident that the price will enter the distribution phase. This phase will be extremely bullish, leading the price to new record highs and potentially surpassing 160. We wish you the best in trading and have a great week ahead.
Like and comment for more!
Team Setupsfx_
❤️🚀

USDJPY 30Min Engaged (Bearish Reversal Entry Detected )➕ Objective: Precision Volume Execution
Time Frame: 30-Minute Warfare
Entry Protocol: Only after volume-verified breakout
🩸 Bearish Reversal From : 146.400
➗ Hanzo Protocol: Volume-Tiered Entry Authority
➕ Zone Activated: Dynamic market pressure detected.
The level isn’t just price — it’s a memory of where they moved size.
Volume is rising beneath the surface — not noise, but preparation.
🔥 Tactical Note:
We wait for the energy signature — when volume betrays intention.
The trap gets set. The weak follow. We execute.