USD/JPY Bearish Flag (30.06.2025)The USD/JPY Pair on the M30 timeframe presents a Potential Selling Opportunity due to a recent Formation of a Bearish Flag Breakout Pattern. This suggests a shift in momentum towards the downside in the coming hours.
Possible Short Trade:
Entry: Consider Entering A Short Position around Trendl
Related currencies

USDJPY h4 strongly bullish opportunity Dip into/under support (~144.5)
2. Trap and reverse hard
3. Break above 148 with momentum
4. Stretch target → 149.50–150.20

USDJPY: Intraday Bearish ConfirmationLast week, I shared an update on a confirmed structure breakout for 📉USDJPY on a 4-hour chart.
On retesting the broken structure, the price showed a strong bearish signal.
I observed a rising wedge pattern with a broken support line
This breakout suggests a high likelihood that the price will d

USDJPY: Up to +2000 Pips Move! Stay Tuned USDJPY has been accumulating for a long time, and we are confident that the price will enter the distribution phase. This phase will be extremely bullish, leading the price to new record highs and potentially surpassing 160. We wish you the best in trading and have a great week ahead.
Like and comm

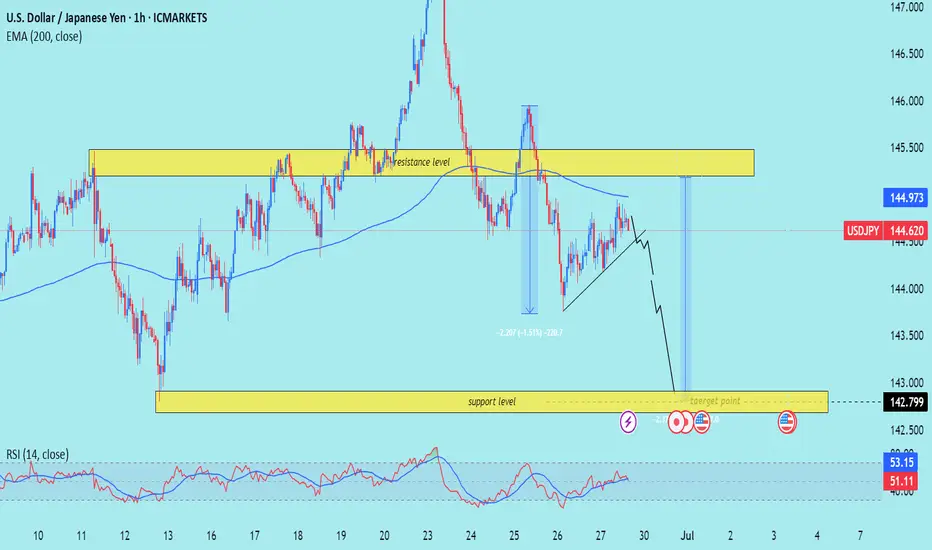
USD/JPY) bearish Trand analysis Read The captionSMC trading point update
Technical analysis of USD/JPY (U.S. Dollar vs Japanese Yen) on the 1-hour timeframe. Here's a clear breakdown of the idea presented:
---
Overview of the Setup
Current Price: 144.620
EMA 200 (Blue Line): 144.973 – price is trading below the EMA, indicating bearish
Trading Recommendations and Analysis for USDJPYThe technical picture on Monday may shape future developments in the medium term. The week began a gap up, followed by the formation of a long upper shadow. The daily close occurred exactly at the support level of 146.11 thereby closing the gap.
Today's trading also opened exactly at the same level

USD/JPY Bullish Reversal Trade Setup – Key Support Test at 145.2Entry Point: 145.273 (highlighted in blue)
Stop Loss: ~144.817–145.260 (purple zone)
Target Point (TP): 148.133 (upper resistance zone)
📉 Recent Price Action:
Price peaked near 148.05 before reversing sharply and breaking the trendline.
The market is currently testing the support zone (near the

Critical Channel Watch Begins on the 1-Hour Chart of USDJPY.Hey everyone,
📉 My Latest USDJPY Analysis:
USDJPY is currently moving within a downtrend. If the price breaks below the lower boundary of the parallel channel, our first target level will be 142.910. The most crucial factor here is the downward breakout of that channel—don’t overlook it.
Also, k

USD/JPY.2h chart patternI'm provided for USD/JPY on the 2-hour timeframe, here is a detailed breakdown and target analysis:
---
🔍 Technical Analysis Summary
Pair: USD/JPY
Timeframe: 2H
Current Price: ~144.98
Trend: Bearish
Breakdown Confirmation: Price broke structure support and the ascending trendline.
Indicato

USD/JPY (4H timeframe) shows a clear break 0ut.USD/JPY (4H timeframe) shows a clear break below the ascending trendline and Ichimoku cloud support, suggesting a bearish continuation.
Key Bearish Targets (Based on the chart):
1. First Target Zone:
📉 140.88
This level aligns with previous structure support and is marked as the initial target on

See all ideas
Displays a symbol's price movements over previous years to identify recurring trends.
Frequently Asked Questions
The value of the USDJPY_SPT pair is quoted as 1 USD per x JPY. For example, if the pair is trading at 1.50, it means it takes 1.5 JPY to buy 1 USD.
USDJPY_SPT is a major currency pair, i.e. a popular currency paired with USD.
Currencies are usually traded through forex brokers — choose the one that suits your needs and go ahead. You can trade USDJPY_SPT right from TradingView charts — just log in to you broker account. Check out the list of our integrated brokers and find the best one for your needs and strategy.