Yen Falls Despite Japan’s Manufacturing ReboundThe yen fell past 146 on Monday, its lowest in over five weeks, as the US dollar gained on safe-haven demand after US airstrikes on Iranian nuclear sites escalated Middle East tensions. Domestically, Japan’s manufacturing sector grew in June for the first time since May 2024, and services expanded for a third straight month, showing economic resilience.
The key resistance is at $148.15 meanwhile the major support is located at $146.15.
USDJPY_SPT trade ideas
UJ: Could we see a bearish leg looking at the 4h?USD/JPY is currently trading at a key price level of 147.5. We've got a 4h order block about 75 pips to the downside at 146.75.
If we see some lower time frame confirmations, we could potentially see a bearish leg towards this 4h OB today.
- Aman

USDJPY 15m H&S CORRECTION Quick trade on this H&S formation (GOOD RISK REWARD)
Plant to buy back if plays out @ 146.742
LONG TERM STILL BULLISH,
This will be just quick earner if plays out
Holla

USDJPY BULLS DONT PLAY STILL LONG WAY TO GOOOWaiting for PULL BACK @ around 146.73 (that will be my buy entry)
This trade its straight forward, i have only 1 target @ 149.79
All the best TRADERS

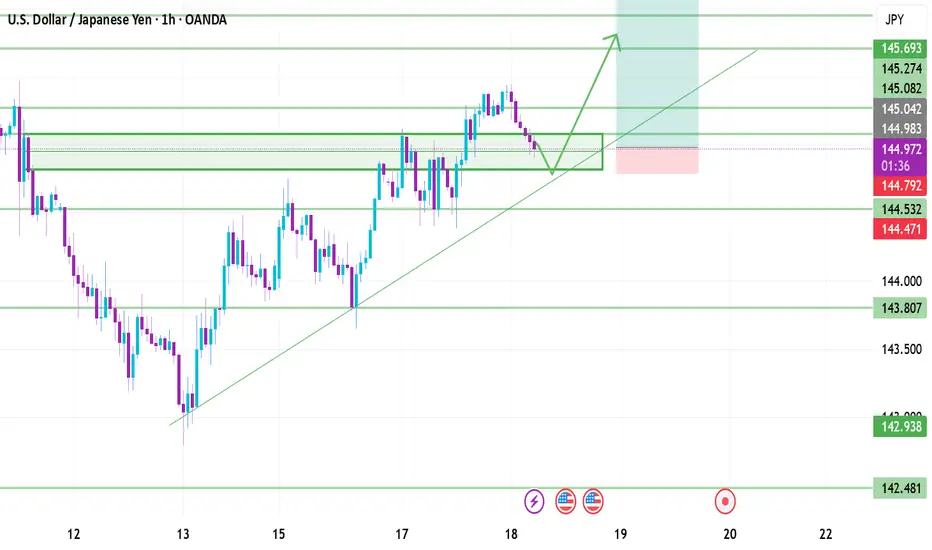
USD/JPYNow that USD/JPY has made a clear bullish move in price we can look for entries for long positions. At this point il wait for price to retest the zone its just broke out of - 445.000 and tp at the next resistance level - 145.693 & 146.000
USD/JPY Breaks Higher – Bullish Momentum Targets 148.40FX:USDJPY CMCMARKETS:USDJPY USD/JPY continues to climb, extending gains above the key 146.00 breakout level, supported by Fed–BoJ policy divergence and rising geopolitical tensions. Despite Japan’s strong CPI and PMI prints, the BoJ maintains a dovish tone, while tariff concerns continue to cap yen sentiment. The Middle East conflict further fuels demand for the USD as a safe haven.
Technically, the pair confirmed a bullish breakout, with price hugging the upper Bollinger Band – a sign of sustained upside pressure. As long as 146.00 holds, bulls may aim for the 148.40 monthly resistance.
Key Levels :
Resistance : 146.75 / 148.40
Support : 146.00 / 145.25
⚠️ Momentum favours the upside while above 146.00. Break below may trigger short-term pullback toward 145.25.

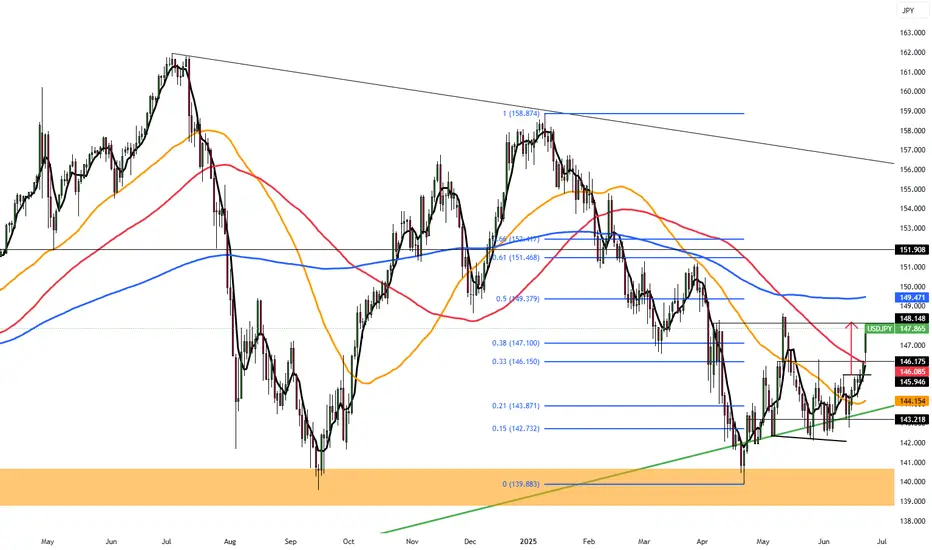
Long - the final move up before moving to the downsideMy macro bias for USDJPY is bearish. However, I opened a long position today.
Reasons for a long trade:
Weekly chart:
1) Both MACD and RSI are in the bear territory, however, both MACD and RSI lines are starting to cross and move to the upside.
2) The price has been moving sideways for weeks, however, weekly candle has been forming higher low since late April (subtle move).
3) There is a major support line at 140.50 area and weekly EMA200 is also sitting right below it.
Although the price has been moving to the downside, it will require strong momentum to pierce through the major support zone that has been holding since July 2023.
Daily chart:
1) EMA9 > EMA14 > EMA 21 - bullish trend
2) Yesterday's daily candle retested EMA 9/14/21 and closed above all of them.
3) MACD has entered the bull zone.
4) RSI has entered the bull zone.
5) There is an unmitigated fair value gap in the Fib 0.618-0.786 area. (see blue rectangular box in the chart).
As I said above, it will take strong momentum for the price to break below the major support line. It makes sense for the price to retrace to the unmitigated fair value gap area to take out all the liquidity to fuel the momentum to the downside.
My trade setup is below:
Entry: 145 Stop/Loss: 144.25 (just under yesterday's candle wick)Target: 147.12
Risk:Rewards 1:1.78

Usdjpy SELL setup Selling usdjpy now because we have swept last week high and I anticipate price to drop off to H1 BB

USDJPY H4 AnalysisUSDJPY Showing a Bearish Flag. If it breaks this zone above, Most probably can fly up to 148.668 and higher to 150.538. If no, Can rally between 143.981 or even lower to 142.410. Trading Analysis from 23-06-25 to 27-06-25. Take your risk under control and wait for market to break support or resistance on smaller time frame. Best of luck everyone and happy trading.🤗

USDJPY TRADE SETUPWait for retest the entry level and bullish momentum then a trade for Buy otherwise skip this setup

USDJPY: buy to sellstructure: range
liquidity: from weak swings to structural liquidity
orderblocks: demand and supply point of interests
buy is coming on USDJPYThe USD/JPY pair recently experienced a bearish movement, which is largely influenced by heightened concerns surrounding the ongoing trade and tariff tensions between the U.S. and its global counterparts. This risk-off sentiment triggered a flight to safe-haven assets, weighing on the pair.
However, price action has now approached a key trendline support zone, which has held firmly in previous sessions. Technical indicators like RSI are also beginning to show signs of bullish divergence, suggesting a potential reversal. If this trendline continues to act as strong support, we may see a bullish bounce from the current level, aligning with the overall ascending trend structure but if the trade break these support zones, then the bearish movement might continues
for now we will be watching for confirmation signals such as bullish candlestick patterns or a break above near-term resistance levels to validate the upward movement.

NEXT WEEK CHECK USDJPY SIGNAL READ CAPTAINEntry: around 146.060)146.110 ✅
Take Profit1 146.210 ✅
Take Profit 2: 146.363 ✅
Last Target: 146.570 ✅
Stop Loss: 145.888❌

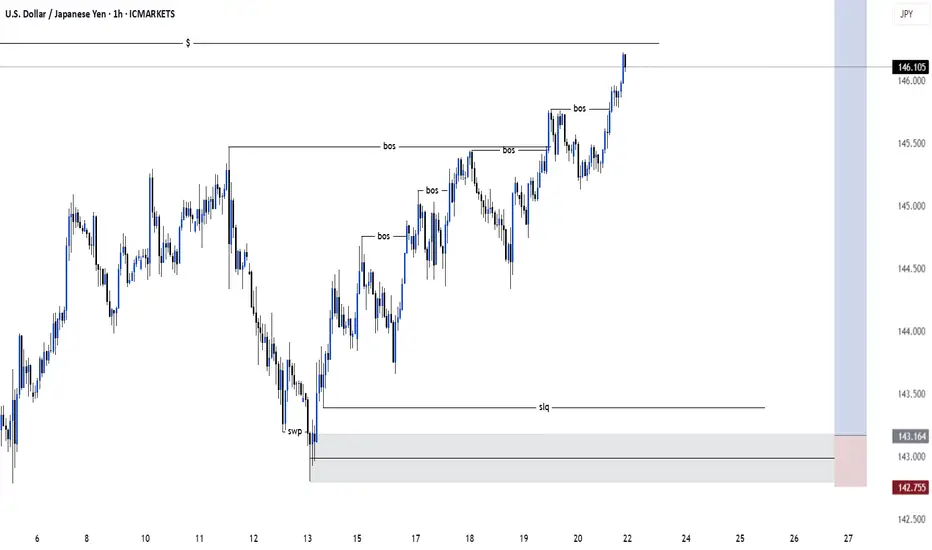
*USDJPY| Weekly Breakdown - Bulls Took OverUJ was all bullish this week, no question about it. The chart made it clear—30M structure stayed intact, and market flow shifted heavily in favor of the buyers.
Liquidity was taken along the way, with higher lows stacking up clean, setting the stage for further continuation to the upside.
Not overcomplicating this one—bulls won the battle, and structure confirmed it. Now we look for smart ways to join that strength as price builds momentum into next week.
Stay with the flow, not against it.
Bless Trading!

DOLLAR; ITS A WRAP.We are done with the week. If you've not been profitable no need for panic cause the market never stops running.We will still have plenty of opportunities to come, what's important is to remain calm and sane and prepared for a new week.
Always trust the process and have a lovely weekend.

USDJPY-bias long Bullish indications:
Major support respected
Inverted HS formation in 15 min time frame.
Inverted hammer candle in 4 hr
Bullish divergence in 1 hr
Trend line resistance broken .
Bearish indications:
Lower lows lower highs.
Trade plan bias long @ 140.815
SL:140.429
TP1:141.300
TP2:141.708

Yen Edges Higher as Inflation SurgesThe Japanese yen traded stronger near 145 per dollar, rebounding as Japan’s core inflation rose for the third straight month to 3.7%, its highest since January 2023. The data strengthens expectations that the Bank of Japan may continue policy tightening.
Earlier in the week, the BOJ held rates at 0.5% but highlighted how rising wages are being passed on to consumers, keeping inflation elevated. Governor Kazuo Ueda emphasized a data-driven path forward, keeping the door open for more hikes if needed.
The key resistance is at $145.30, while the major support is located at $142.50.
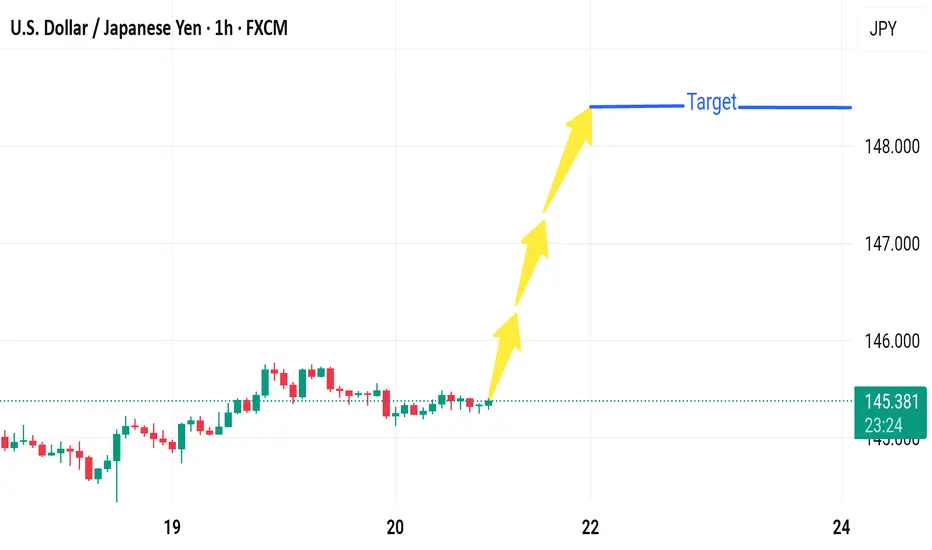
Market next move 🔻 Disruptive Analysis – Bearish Scenario
1. Resistance Rejection:
Price has stalled around 145.40, showing hesitation.
The target area (~148.000) hasn't been tested yet, and prior attempts to break higher may face heavy resistance from institutional sell orders or prior supply zones.
2. Range-Bound Structure:
Current price action shows consolidation — multiple small-bodied candles.
Lack of volume or momentum may indicate accumulation or distribution — not necessarily a bullish breakout setup.
3. Potential Bearish Triggers:
If price breaks below 145.00, a short-term bearish move could occur toward:
144.30 – recent swing low support.
143.80 – demand zone based on prior accumulation.
4. Macro Disruptors:
Surprise BoJ intervention or hawkish policy tone could strengthen the Yen.
A dovish Fed statement or poor U.S. economic data could drag USD down sharply.
---
📉 Alternate Scenario Chart Sketch (Hypothetical):
148.000 ──────── (Target denied - strong resistance)
↑
Rejection
↓
145.000 ──────── (Breaks support)
↓
144.300 ──────── (First bearish target)
↓
143.800 ──────── (Deeper retracement zone)
USD/JPY 4-Hour Forex Chart (June 20, 2025)4-hour candlestick chart from FOREX.com displays the USD/JPY currency pair's performance, showing a current value of 145.328 with a slight decrease of 0.112 (-0.08%). The chart highlights a recent downward trend following a peak near 145.950, with a shaded area indicating a potential resistance zone around 145.500-145.950. The time frame spans from early June to the present date, with key levels marked at 145.000, 144.478, and higher resistance points.

USDJPY | BullishUSDJPY is in bullish continuation pattern with ascending channel formation and bullish divergence on RSI.

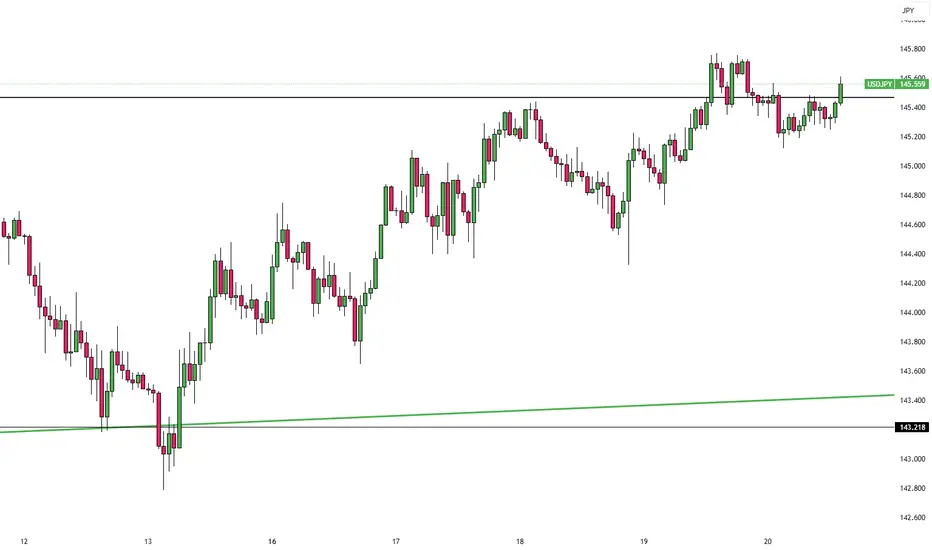
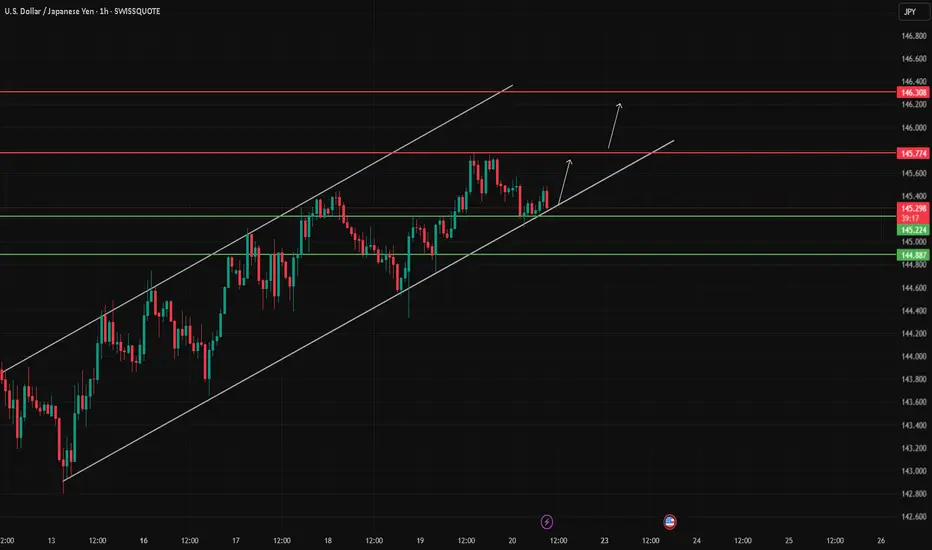
USD/JPY Holding Channel Support – Can Bulls Reach 146.30 ?USD/JPY continues to trade within a clean ascending channel.
Price is currently testing the lower boundary of the channel near 145.224 – 145.320, which aligns with intraday support.
If this zone holds, a bounce toward 145.774 and then 146.308 is likely.
A break below 144.887 would invalidate the bullish structure.
This is a technical analysis idea – not financial advice.
USD/JPY 2-Hour Forex Chart2-hour candlestick chart from FOREX.com displays the exchange rate between the U.S. Dollar (USD) and the Japanese Yen (JPY). The current rate is 145.513, with a slight increase of +0.074 (+0.05%). The chart shows price movements over the past 2-hour period, with a notable upward trend followed by a recent decline, as highlighted by the shaded area indicating a potential resistance or reversal zone. Key levels such as 145.701 and 145.106 are marked, along with the current time of 04:00.

Bearish AB=CDWhat's up, traders 👋
Let’s look at a clean Bearish AB=CD symmetry pattern playing out on USDJPY.
Price advanced from A → B, corrected sharply into C, then rallied again into D (145.767) — completing the AB = CD symmetry leg into a tight PRZ zone, now showing early signs of rejection.
🧠 Pattern Details:
Precise AB = CD symmetry
PRZ zone plotted with 145.504 (entry) to 145.793 (stop)
First target near 144.65 (100% extension)
Rejection aligns with short-term resistance + SMA 200 below
Textbook CD completion followed by indecision bar at D
Now it’s all about follow-through — we manage from structure, not emotion.
— C. Dela | #TradeChartPatternsLikeThePros
