USDJPYUSDJPY Trading Plan.
"Now let’s look at the Smart Money Concept behind USD/JPY.
A classic liquidity grab took place in the 142.8 to 143.0 zone — triggering stop-losses and then sharply reversing upward. This is a textbook example of institutional accumulation after sweeping retail traders."
"We also see a bullish order block and a fair value gap forming in the same area on both the daily and H4 charts. That makes this zone a high-probability entry point for smart money traders."
"A change of character is clearly visible as the price structure on H4 and H1 shifts from bearish to a more consolidative and bullish tone — especially after a strong reversal candle near the FVG support."
"In summary, institutions are quietly building long positions around 142.8 to 143.0 — and it’s a highly favorable entry zone, with a logical stop-loss just below 142.3."
USDJPY_SPT trade ideas

Yen Slips as Fed Holds and Risks MountThe yen weakened past 145 on Thursday, nearing a three-week low as the stronger U.S. dollar gained support from the Fed’s steady rate decision and cautious outlook. Concerns over Trump’s tariffs and Middle East tensions increased safe-haven demand for the dollar over the yen.
The BOJ also kept rates unchanged Tuesday and signaled a gradual asset reduction. Governor Ueda noted that rate hikes remain possible if inflation rises.
The key resistance is at $145.30 meanwhile the major support is located at $142.50.
CHECK GBPJPY SIGNAL READ CAPTAINusdjpy sell now ✅
entry point (145.300) (145.200)
TAKE PROFIT 1: (144.850)
TAKE PROFIT 2: (144.400)
LAST TARGET (144.000)
STOP LOSS (145.800)


DXY: STEP BY STEP.There was not much to yesterday as we awaited the FOMC minutes to know the Fed's rates decision.Interest rates remain unchanged so unless there are geopolitical catalysts I expect the dollar to rebound to 100.00 if there is successive break above 99.00. Subsequently leading to a higher price in dollar v yen. Patiently waiting to long this pair step by step. If London sessions fails then we wait for NY session.
#Happy Trading Y'all.


USD/JPY.1h chart pattern.(USD/JPY 1H), the price has broken below the rising channel, suggesting a bearish move ahead. Here are the two key target levels marked on My chart:
Targets:
1. First Target: Around 144.100
2. Second (Deeper) Target: Around 143.200
These levels align with previous support zones and measured moves from the channel breakdown.
Let me know if you’d like stop-loss or entry suggestions too.

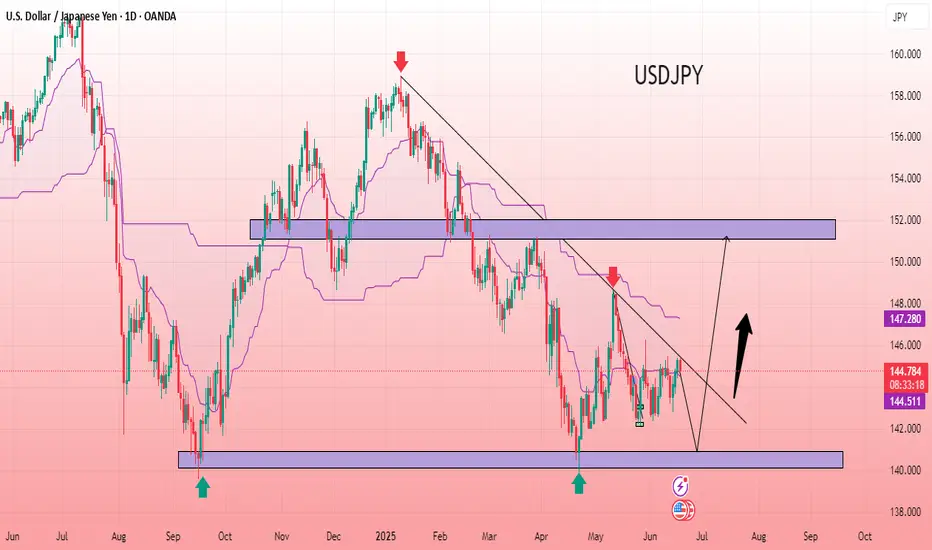
USD/JPY BULLISH SETUPThe USD/JPY daily chart indicates a potential bullish reversal setup. Price has been consolidating within a descending trendline and has recently bounced from a strong support zone around 140.000. The presence of multiple rejections from the lower support zone suggests buying interest. A breakout above the trendline confirms bullish momentum. The Ichimoku cloud is narrowing, indicating potential for trend shift. The market is eyeing a move towards the next resistance zone aligned near a previous supply area. Bullish confirmation with rising volume could fuel further upside. A break and hold above resistance may lead to further continuation in the coming sessions.
Entry Point: 142.100/141.000
Target Point: 151.110
If you found this analysis helpful, don’t forget to drop a like and comment. Your support keeps quality ideas flowing—let’s grow and win together! 💪📈
USDJPY – Fed Meeting Ahead With Range Highs In FocusYesterday’s Bank of Japan meeting saw the central bank act as expected. They kept interest rates unchanged and slowed the pace at which they will decrease monthly JGB purchases by half to help ensure market stability. This eventually assisted USDJPY to push higher and touch a peak early this morning at 145.44, matching a monthly high set on June 11th (145.46).
So far, this move to June range highs has been met with fresh selling, but there is still a lot for FX traders to consider moving into the Friday close, including an escalating conflict in the Middle East that has seen Israel and Iran exchange fire for six days in a row, and more importantly for wider financial markets, has drawn the full attention of President Trump and his national security team. How this situation evolves across the remainder of this week could influence the direction of USDJPY.
Also important could be the outcome later this evening of the Federal Reserve (Fed) Interest Rate Decision (1900 BST) and Press Conference (1930 BST). No change to interest rates is expected as policymakers, including Chairman Powell have been clear that they are currently in wait and see mode before making their next move, however their updated projections for US inflation, growth, and rate cuts may provide some extra volatility for USDJPY prices if these deviate from market expectations.
We shouldn’t forget it is also a holiday in the US tomorrow so liquidity could be reduced, so assessing the technical outlook, including relevant support and resistance levels may be useful.
Technical Update: Balanced Range Extends into Fed Meeting
Little has changed in USDJPY price activity from a technical perspective following Tuesday’s Bank of Japan meeting, and the focus now shifts to Wednesday’s Fed meeting in the US as the next potential sentiment driver for price.
As the chart above shows, the latest USDJPY activity has been held within a sideways range marked by potential support at 142.11, the May 27th session low, and potential resistance at 146.29, the May 29th session high.
This latest price activity may be an indication of trader uncertainty as to the direction of the next move and possibly the need for prices to ‘breakout’ and establish where the next directional risks might lay.
Of course, nothing is guaranteed and a closing break above resistance or below support might not see a more sustained phase of price movement, however being prepared is important.
Let’s consider the potential levels traders might find useful to watch if a breakout from the current sideways range is seen.
Potential Resistance Levels:
Successful closing breaks above 146.29 might be viewed by some as opening scope to higher levels and may possibly lead to a more sustained phase of price strength.
It’s at this time that the focus for traders may shift to the next potential resistance which could be at 148.65, the May 12th session high, even 151.21, the March 28th peak.
Potential Support Levels:
Equally possible within the current more balanced sideways price activity, is that a closing break under support provided by the May 27th low at 142.11 might well develop and be viewed as a potential negative breakout from the current sideways price range.
If closes below support at 142.11 are seen over the coming sessions, it might reflect for moves to even lower levels in price, with traders potentially shifting their focus to the April 22nd low trade at 139.89 as the possible next support.
The material provided here has not been prepared
accordance with legal requirements designed to promote the independence of investment research and as such is considered to be a marketing communication. Whilst it is not subject to any prohibition on dealing ahead of the dissemination of investment research, we will not seek to take any advantage before providing it to our clients.
Pepperstone doesn’t represent that the material provided here is accurate, current or complete, and therefore shouldn’t be relied upon as such. The information, whether from a third party or not, isn’t to be considered as a recommendation; or an offer to buy or sell; or the solicitation of an offer to buy or sell any security, financial product or instrument; or to participate in any particular trading strategy. It does not take into account readers’ financial situation or investment objectives. We advise any readers of this content to seek their own advice. Without the approval of Pepperstone, reproduction or redistribution of this information isn’t permitted.

We will be a seller again.* **Key Level**: 144.500 is the trigger zone. If broken downward, a sell becomes high probability.

USD/JPY BEARS ARE GAINING STRENGTH|SHORT
Hello, Friends!
USD/JPY pair is in the uptrend because previous week’s candle is green, while the price is evidently rising on the 1D timeframe. And after the retest of the resistance line above I believe we will see a move down towards the target below at 141.669 because the pair overbought due to its proximity to the upper BB band and a bearish correction is likely.
Disclosure: I am part of Trade Nation's Influencer program and receive a monthly fee for using their TradingView charts in my analysis.
✅LIKE AND COMMENT MY IDEAS✅

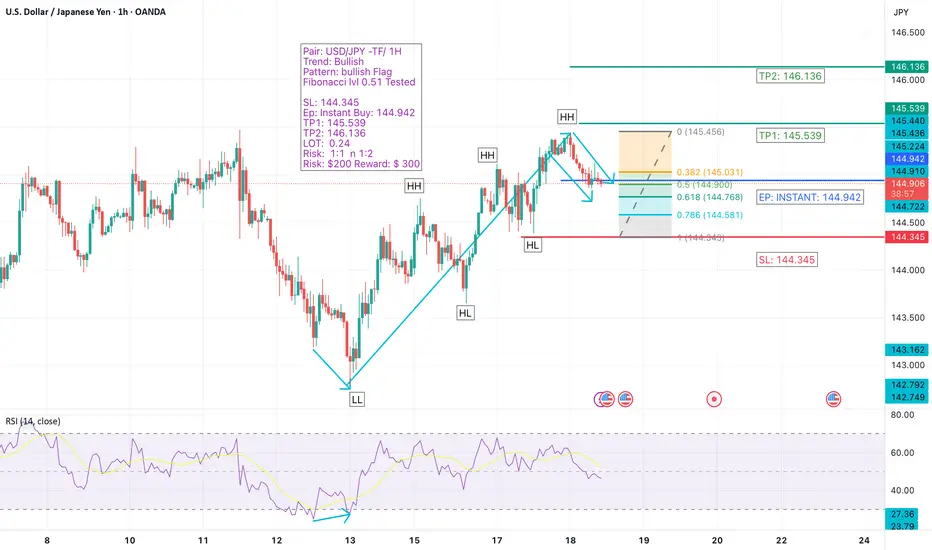
USD/JPY Trade Setup – 1H Timeframe- Wk 9We are currently observing the USD/JPY pair on the 1-hour chart, and the trend remains strongly bullish. There is no divergence present, which confirms trend continuation. A bullish flag pattern has formed, suggesting a potential breakout to the upside.
The pair has recently completed a healthy retracement and tested the 0.5 Fibonacci level, which further supports our bullish bias. Based on this setup, we are executing an instant buy trade with a well-calculated risk-to-reward strategy.
🔹 Pair: USD/JPY
🔹 Trend: Bullish
🔹 Pattern: Bullish Flag
🔹 Fibonacci Level: 0.5 Tested
🔹 Entry Point: 144.942 (Instant Buy)
🔹 Stop Loss: 144.345
🔹 Take Profit 1: 145.539
🔹 Take Profit 2: 146.136
🔹 Lot Size: 0.24
🔹 Risk/Reward Ratio: 1:1 and 1:2
🔹 Risk: $200
🔹 Potential Reward: $300
🎯 Outlook: Expecting bullish continuation.
📌 #USDJPY #ForexSignals #BullishFlag #TechnicalAnalysis #PriceActionTrading #FibonacciRetracement #BreakoutSetup #ForexStrategy #RiskRewardRatio #ForexTradeIdea #1HChart #ForexMarket #FXTrading #SmartMoneyConcepts
Market Analysis: USD/JPY Recovers Above 145.00Market Analysis: USD/JPY Recovers Above 145.00
USD/JPY is rising and might gain pace above the 145.50 resistance.
Important Takeaways for USD/JPY Analysis Today
- USD/JPY climbed higher above the 144.00 and 145.00 levels.
- There is a key bullish trend line forming with support at 144.80 on the hourly chart at FXOpen.
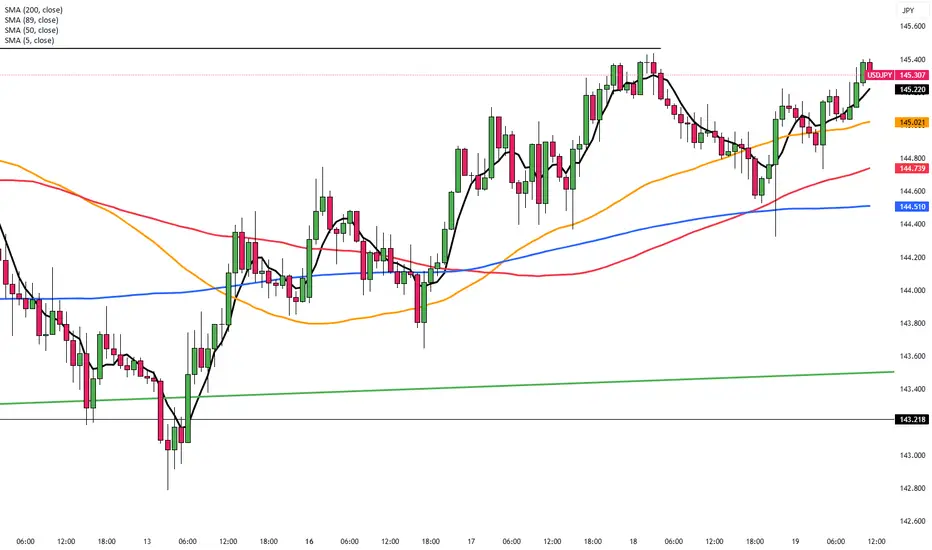
USD/JPY Technical Analysis
On the hourly chart of USD/JPY at FXOpen, the pair started a fresh upward move from the 142.80 zone. The US Dollar gained bullish momentum above 143.40 against the Japanese Yen.
It even cleared the 50-hour simple moving average and 144.00. The pair climbed above 145.00 and traded as high as 145.43 before there was a downside correction. It is now moving lower toward the 23.6% Fib retracement level of the upward move from the 142.79 swing low to the 145.40 high.
The current price action above the 144.50 level is positive. There is also a key bullish trend line forming with support at 144.80. Immediate resistance on the USD/JPY chart is near 145.40.
The first major resistance is near 146.20. If there is a close above the 146.20 level and the RSI moves above 60, the pair could rise toward 147.50. The next major resistance is near 148.00, above which the pair could test 148.80 in the coming days.
On the downside, the first major support is 144.80 and the trend line. The next major support is visible near the 144.40 level. If there is a close below 144.40, the pair could decline steadily.
In the stated case, the pair might drop toward the 143.40 support zone and the 76.4% Fib retracement level of the upward move from the 142.79 swing low to the 145.40 high. The next stop for the bears may perhaps be near the 142.80 region.
This article represents the opinion of the Companies operating under the FXOpen brand only. It is not to be construed as an offer, solicitation, or recommendation with respect to products and services provided by the Companies operating under the FXOpen brand, nor is it to be considered financial advice.

The Day Ahead - Fed rate decision day 🇺🇸 US
Housing & Jobless Data: Signs of slowdown could boost rate cut bets and weaken the USD. Strong numbers may do the opposite.
TIC Flows: Shows foreign demand for US assets—important for long-term USD strength.
🇬🇧 UK
May Inflation (CPI): A hot reading could delay Bank of England rate cuts and strengthen the pound. A weak reading would do the opposite.
🇯🇵 Japan
Trade & Machinery Orders: Weak data could weaken the yen further.
🇳🇿 New Zealand
Q1 GDP: Poor growth could drag the NZD lower. A surprise beat might boost it.
🇸🇪 Sweden
Riksbank Rate Decision: No change expected, but any dovish hints may weaken the krona.
🇪🇺 Eurozone
ECB Speakers (Lane, Villeroy, etc.): Markets are watching for clues on whether more rate cuts are coming. Dovish talk could push the euro lower.
Trading Themes Today:
Watch UK inflation for big GBP moves.
US data could shift Fed expectations and USD direction.
NZD and JPY sensitive to economic data.
EUR direction depends on ECB tone.
This communication is for informational purposes only and should not be viewed as any form of recommendation as to a particular course of action or as investment advice. It is not intended as an offer or solicitation for the purchase or sale of any financial instrument or as an official confirmation of any transaction. Opinions, estimates and assumptions expressed herein are made as of the date of this communication and are subject to change without notice. This communication has been prepared based upon information, including market prices, data and other information, believed to be reliable; however, Trade Nation does not warrant its completeness or accuracy. All market prices and market data contained in or attached to this communication are indicative and subject to change without notice.

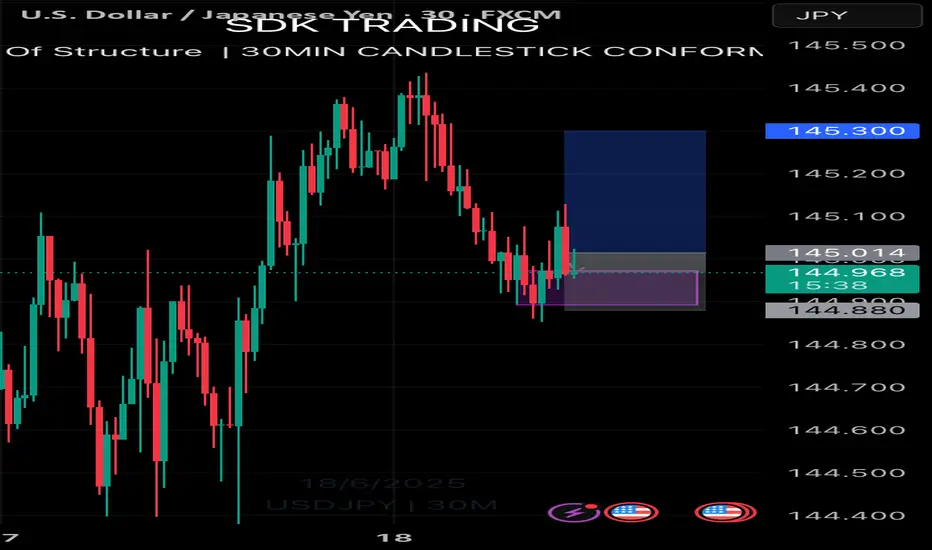
USDJPY LongPrice hit an Area on interest on the 30 min timeframe. There is also a break of structure on the 30min timeframe and and orderblock that price retested. Takeprofit and stop loss are indicated on the chart.
Break out and retest strategyOn the 4 hour time frame shows an uptrend, of which it has provided the third touch marking a buy. And it has been in an uptrend that has been creating higher lows. It has provided a breakout on the H4, and on the 30 minute timeframe it gave a support level markin a buy set up amd entry. Sculping to take first take profit and second

Yen Holds Ground as BoJ Stays CautiousThe yen held near 145.1 per dollar on Wednesday following three consecutive sessions of losses, weighed down by soft economic data and trade uncertainty. Japan’s exports declined in May for the first time in eight months, alongside drops in machinery orders and manufacturing sentiment. The Bank of Japan left rates unchanged and maintained a cautious tone, though Governor Ueda signaled future hikes remain possible. Trade talks between Prime Minister Ishiba and President Trump at the G7 summit showed no progress on tariffs.
Resistance is at 145.30, while support stands near 142.50.

USDJPY 1H – 5-WaveHello awesome traders!
USDJPY (1H) is shaping up beautifully with a textbook 5-wave structure into a potential reversal zone.
After completing the 5th wave at 145.442, we’re seeing a controlled pullback targeting the TARGET ZONE 1, which aligns perfectly with:
127% Fib Extension of the last impulse
161.8% Full Projection
200 SMA Dynamic Support
We’re watching closely for price to reach this high-confluence area (144.471 – 144.207), which also aligns with the previous Wave 4 region and the trendline break. If buyers step back in with strong price action, we’ll look to long from this zone toward a retest of 145.255, and possibly beyond if structure shifts bullish again.
Key Outlook:
🔸 Short-term retracement into value
🔸 Bullish continuation possible from PCZ
🔸 Patience pays — let the setup complete
We'll monitor the TARGET ZONE 1 for signs of accumulation and a fresh breakout setup.
🔥 Structure. Patience. Execution.
🟠 Follow for more clean structural setups and trade-ready charting ideas
TradeChartPatternsLikeThePros.

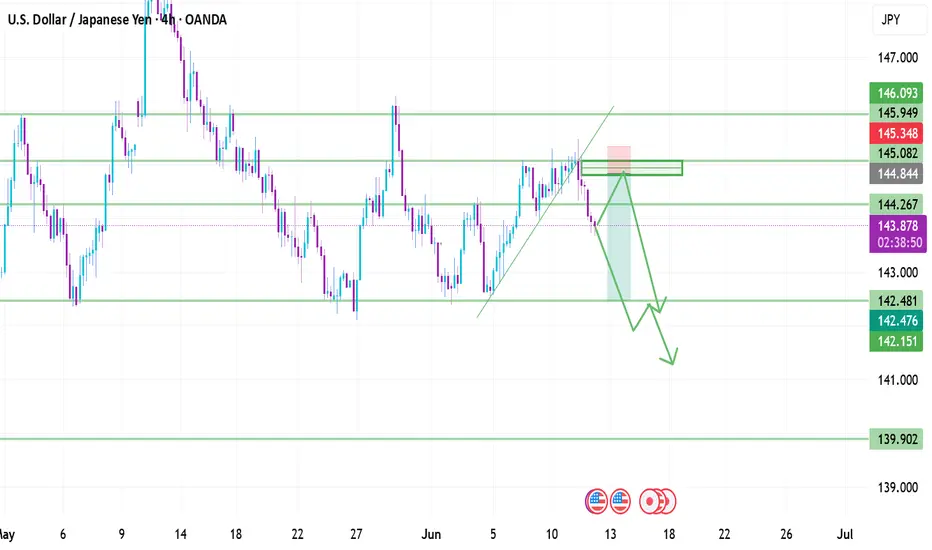
USD/JPYIn my previous analysis, I held a long bias on USD/JPY; however, recent geopolitical tensions and market-moving news have shifted the outlook. The pair has now broken below a key trendline, forming new lower lows, suggesting a potential change in structure.
At this point, two possible scenarios could unfold:
Scenario 1: USD/JPY may retest the breakout zone around the 145.000 level before continuing its move downward.
Scenario 2: The pair may continue its bearish momentum, break through the next significant support at 142.480, and potentially offer a shorting opportunity following a confirmed retest of that level.
Although the chart has shown mixed signals with both bullish and bearish formations, I’m reminded of an insightful quote I read this morning by Mihai_Iacob: “Trade the chart, respect the world around it.”
With that in mind, I will continue to focus on technical structure while remaining mindful of external factors such as geopolitical events and high-impact news that could influence volatility and market direction.
USD/JPY Follow the ascending bullish from demand zone 143.000FX:USDJPY Analysis – 1H Timeframe
The pair continues to respect its bullish ascending channel, gaining strong momentum from the key demand zone at 143.000.
🔹 Technical Targets Ahead:
🔸 1st Target: 144.100 – Minor Supply Zone
🔸 2nd Target: 144.900 – Key Supply Zone
🔸 3rd Target: 145.900 – Strong Resistance Level
Momentum remains in favor of buyers as long as price holds above 143.000. Watch for reactions at each target zone for potential short-term pullbacks or breakout continuation.
📊 Trade smart – manage your risk!
👇 Like, follow, drop a comment, and join us for real-time updates & setups!
— Livia 💹😜

Could the price bounce from here?USD/JPY is falling towards the pivot which is an overlap support and could bounce to the 1st resistance which which acts as a pullback resistance.
Pivot: 144.34
1st Support: 142.98
1st Resistance: 146.15
Risk Warning:
Trading Forex and CFDs carries a high level of risk to your capital and you should only trade with money you can afford to lose. Trading Forex and CFDs may not be suitable for all investors, so please ensure that you fully understand the risks involved and seek independent advice if necessary.
Disclaimer:
The above opinions given constitute general market commentary, and do not constitute the opinion or advice of IC Markets or any form of personal or investment advice.
Any opinions, news, research, analyses, prices, other information, or links to third-party sites contained on this website are provided on an "as-is" basis, are intended only to be informative, is not an advice nor a recommendation, nor research, or a record of our trading prices, or an offer of, or solicitation for a transaction in any financial instrument and thus should not be treated as such. The information provided does not involve any specific investment objectives, financial situation and needs of any specific person who may receive it. Please be aware, that past performance is not a reliable indicator of future performance and/or results. Past Performance or Forward-looking scenarios based upon the reasonable beliefs of the third-party provider are not a guarantee of future performance. Actual results may differ materially from those anticipated in forward-looking or past performance statements. IC Markets makes no representation or warranty and assumes no liability as to the accuracy or completeness of the information provided, nor any loss arising from any investment based on a recommendation, forecast or any information supplied by any third-party.

CHECK USDJPY SIGNAL READ CAPTAINTrade Setup Details (USD/JPY):
Entry Price: 144.965 (marked in grey)
Current Price: 144.934
Stop Loss: 145.330🔻
Take Profit Levels:
TP1: ~144.350
TP2: ~144.880
Last Target: 143.290 🎯

ANOTHER DAY ANOTHER DOLLAR.So we are in the midst of an international crisis. Middle eastern tensions are always bound to shake up the market so even with all the information; economic data and technical analysis. We should always expect surprises.
With that being said let's jump right into analysis of the dollar v yen pair.We have been range bound for the past two months in a wide range between 148.00and 141.00.I don't expect price jumping out of that range unless there is a very strong catalyst. This week's price range has seen lows of 143.90 and highs of 145.40 and this is the data we will use today to set our targets.A break lower for the dollar will subsequently mean lower targets for the dollar yen while a reverse in the dollar will take us to monthly high targets @ 146.00 and 147.00.
