USDJPY InsightHello to all our subscribers.
Please share your personal opinions in the comments. Don’t forget to like and subscribe.
Key Points
- The armed conflict between Israel and Iran has continued for five days. However, geopolitical risks in the Middle East have eased as Iran reportedly conveyed its willingness to agree to a ceasefire indirectly to the United States.
- U.S. President Trump stated on Truth Social, "Iran should have signed the 'deal' I told them to sign, and everyone must immediately leave Tehran, the capital of Iran."
- The Bank of Japan kept its benchmark interest rate unchanged at 0.5% and announced it will reduce long-term government bond purchases from the current 400 billion yen to 200 billion yen starting April next year.
Key Economic Events This Week
+ June 17: BOJ Interest Rate Decision, U.S. May Retail Sales
+ June 18: U.K. May Consumer Price Index, Eurozone May CPI, FOMC Meeting Results
+ June 19: BOE Interest Rate Decision
USDJPY Chart Analysis
There hasn’t been any major movement around the 144 level yet, but a clear trend is expected to emerge soon. An upward move is anticipated, and in that case, a peak is likely to form near the 148 level. Further direction will be determined once that zone is reached.
USDJPY_SPT trade ideas

Fundamental Market Analysis for June 17, 2025 USDJPYThe Japanese yen (JPY) continues to experience significant pressure against the US dollar (USD), showing a three-day decline and trading above the key psychological level of 145.000. This weakening is largely due to growing market expectations that the Bank of Japan (BoJ) may delay raising rates until the first quarter of next year. The main reason for this delay is said to be the continuing uncertainty surrounding future US tariff policy, which could have a significant impact on global trade flows and Japan's economic growth. Moderate but steady growth in the US dollar is also contributing to the strengthening of the USD/JPY position, pushing the pair to new highs during the Asian trading session.
However, market participants are cautious about aggressive bearish bets against the yen ahead of the upcoming Bank of Japan monetary policy meeting. This meeting is seen as a critical event that could provide additional signals about the central bank's long-term policy outlook. Any hints of a change in tone or new assessments of the economic situation will be carefully analyzed by traders.
In addition to central bank decisions, growing geopolitical tensions in the Middle East may help limit deeper losses for the Japanese yen. As a traditional “safe haven,” the yen typically attracts investors during periods of global instability, which may offset some of the negative impact of interest rate differentials. In addition, the outlook for the USD/JPY pair is influenced by the growing recognition that the US Federal Reserve (Fed) may lower borrowing costs in 2025. Expectations of future Fed rate cuts could hinder further strengthening of the US dollar and thus limit the upside potential of the USD/JPY pair. Overall, the market remains in anticipation of key decisions that will determine the future trajectory of one of the world's most actively traded currency pairs.
Trading recommendation: SELL 144.550, SL 145.000, TP 143.600

Price action Usdjpy has failed swing low change of character where the green line is price filling the gaps and neve fell below red line all those are bullish characteristics

Bearish breakout off major support?USD/JPY is reacting off the pivot which acts as an overlap support and a breakout of this level could lead the price to drop to the 1st support.
Pivot: 144.51
1st Support: 143.74
1st Resistance: 145.22
Risk Warning:
Trading Forex and CFDs carries a high level of risk to your capital and you should only trade with money you can afford to lose. Trading Forex and CFDs may not be suitable for all investors, so please ensure that you fully understand the risks involved and seek independent advice if necessary.
Disclaimer:
The above opinions given constitute general market commentary, and do not constitute the opinion or advice of IC Markets or any form of personal or investment advice.
Any opinions, news, research, analyses, prices, other information, or links to third-party sites contained on this website are provided on an "as-is" basis, are intended only to be informative, is not an advice nor a recommendation, nor research, or a record of our trading prices, or an offer of, or solicitation for a transaction in any financial instrument and thus should not be treated as such. The information provided does not involve any specific investment objectives, financial situation and needs of any specific person who may receive it. Please be aware, that past performance is not a reliable indicator of future performance and/or results. Past Performance or Forward-looking scenarios based upon the reasonable beliefs of the third-party provider are not a guarantee of future performance. Actual results may differ materially from those anticipated in forward-looking or past performance statements. IC Markets makes no representation or warranty and assumes no liability as to the accuracy or completeness of the information provided, nor any loss arising from any investment based on a recommendation, forecast or any information supplied by any third-party.

big swing buy on a weak yenweak cpi and aggressive inflation. no wage increases. moderate yen. moderate your buys and pay attention to weekend news with middle east and conflicting USA involvement. this is a swing purchase stop loss below 138 with a profit pull outlook above 180. goodluck

Missed the UJ Entry in Hope of Retest!USDJPY Recently gave a fakeout of the triangle pattern in downside traping the seller, as trend is bullish and we see JPY is getting weaker.
Now we can look for the Buy entry at retest of trend line.

USDJPY Short 2025-06-17Price is currently within the known resistance zone.
Looking forward on BOJ interest rate announcement which will likely give a boost on JPY.
A short scalp is likely the way to go!

USDJPY Wave Analysis – 16 June 2025
- USDJPY reversed from the support zone
- Likely to rise to the resistance level 146.00
USDJPY currency pair recently reversed from the support zone surrounding the pivotal support level 142.50, which has been reversing the price from the start of August.
The upward reversal from the support level 142.50 created the daily Japanese candlesticks reversal pattern Piercing Line.
USDJPY currency pair can be expected to rise to the next resistance level 146.00 (top of the previous correction 2 from last month).

USDJPY – Triangle Complete? Wave (v) Setup BuildingWave (iv) appears to be ending with an (e) wave tag into the 0.764 retracement.
📉 Price remains capped within the contracting triangle — watching closely for breakdown confirmation.
If this plays out, wave (v) of C could now begin unfolding with initial focus on 140.00 and below.
🧩 Structure: (a)-(b)-(c)-(d)-(e) triangle complete
📏 Final wave (e) aligns with 0.764 retracement and structural resistance
⚠️ RSI divergence + weakening momentum support the bearish scenario

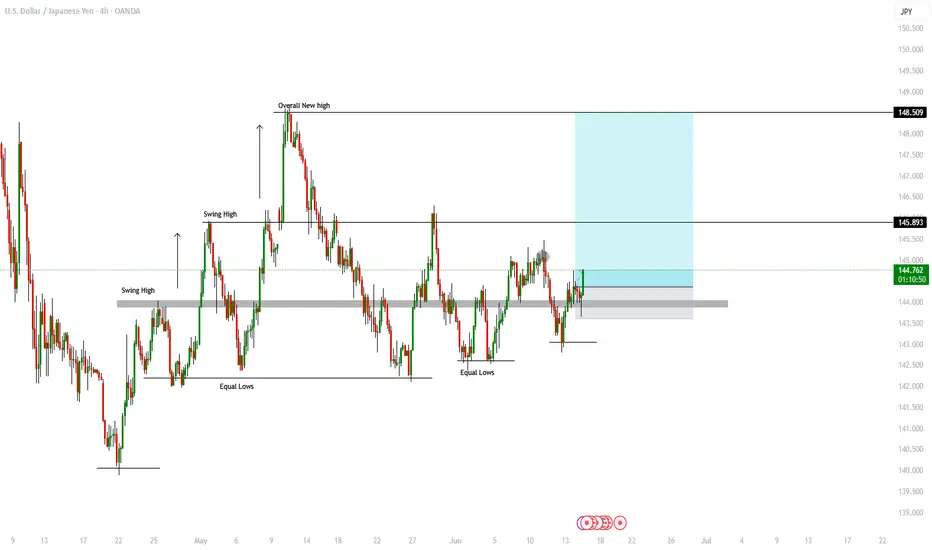
OANDA:USDJPY Buys SetupThe market has recently rebounded from a key support zone, showing strong bullish momentum and forming higher lows—a classic sign of accumulating demand. Price action suggests a potential breakout to the upside, possibly driven by liquidity resting above recent swing highs. If history is any guide, this pattern could signal further continuation in the direction of the trend.
Trade Setup (Risk Parameters):
Entry: 144.372
Stop Loss: 143.599
Target Levels:
Take Profit 1: 145.889
Take Profit 2: 148.508
This setup offers a favorable risk-to-reward ratio, aligning with recent market structure and momentum. As always, manage risk appropriately and monitor price action closely.
Let me know your thoughts in the comments. If this analysis resonates with your trading style, consider giving it a boost and follow for more high-probability setups. Stay disciplined and trade safe!
USDJPY Looking Very Strong sideUSD/JPY Poised for Breakout: Bullish Momentum Ahead?
USD/JPY to be gearing up for a significant breakout. Based on current market data, we are observing strong bullish momentum, suggesting the potential for a major upward move.
Key Observations:
Technical Structure: Pattern seems to be forming a breakout pattern rather than a breakdown, indicating that upward price movement is more likely the U.S dollar remains one of the strongest global currencies, supported by robust economic data and interest rate differentials.
Resistance zone 148.500
Support Levels 143.000
you may find more details in the chart thanks you and Good luck Ps Support with like and comments for more insights.

Bullish FlagHello traders! 👋
We've just spotted a classic Bullish Flag breakout on USDJPY (30m chart) — one of the cleanest continuation patterns in price action trading.
After a strong impulse leg to the upside, price formed a downward-sloping flag — a textbook consolidation pattern. The breakout above 144.749 confirms buyer control and sets the stage for continuation toward 145.42, the 1.618 Fibonacci extension.
📌 Pattern: Bullish Flag
📌 Breakout Level: 144.749
📌 Target: 145.42
📌 Stop: Below 143.60 (flag low / invalidation zone)
🧠 Structure Note:
The symmetry of the flag is clean, with measured move projection aligning with the extension target. This setup shows clear impulsive energy, consolidation, and breakout — ideal continuation behavior.
🎯 Trading Plan:
If price holds above 144.75, we’re looking at a move toward 145.00 first, with extended continuation to 145.42. If price fails and drops back below the flag, the setup is invalidated — as always, risk management first.
Let the structure guide you, not your emotions. Stay disciplined.
—
📈 Trade Chart Patterns Like The Pros


USDJPY - Bearish Trend Continuation Story : USDJPY is forming a series of LH and LL (Bearish Trend). market has retraced to a Fib level of 50 Percent of long rally - thus forming a Bearish Flag Pattern. There is no divergence on the chart therefore we are not looking for any Harmonic or trend reversal patterns.
Anticipate : It is anticipated that market will follow a bearish trend
Plan: we plan our entry on the break of neckline which is our entry point and we keep our Stop loss as defined in the charts (above HH)
Our TP1 would be as defined in the chart (which is also projection based on continuation pattern) - TP1 would respect the support level of 121.680
Our TP2 would be as defined on the chart.

USDJPY Ready to Lift Off from Demand Zone – Breakout Brewing?The Dollar-Yen pair is trading at 144.05, showing signs of strength after bouncing off a strong daily demand zone around 140.55. Price has respected this zone several times since May, suggesting a solid base for a bullish move.
🟠 Key Demand Zone (Support): 140.55 – 141.00
🔵 Major Resistance Ahead:
• 150.63 (mid-range key level)
• 155.70 – 157.00 (supply zone & previous highs)
📈 Bullish Outlook:
If price holds above 140.55, we could see a breakout of the minor range consolidation heading into July. First target sits at 150.63, and further upside could see a retest of the supply zone around 156.
📉 Bearish Risk:
Failure to hold above 140.55 opens up room for a deeper correction — but strong demand and historical bullish reactions favor the bulls for now.
🔍 Why This Matters:
• Clean demand zone reaction
• Low volatility = possible expansion phase ahead
• JPY fundamentals remain weak, giving USD strength tailwind
💡 Watch for a breakout candle above recent consolidation highs to confirm the next leg upward.
📅 Timeframe: Daily (1D)
🧠 Tools: LuxAlgo Supply & Demand Visible Range
🚀 Will USDJPY rally toward 150+ or stall at mid-resistance? Let’s talk setups👇
#USDJPY #ForexSetup #SmartMoney #DailyChart #SupplyDemand #PriceAction #BreakoutTrade #TradingView #FrankFx #YenWatch #LuxAlgo

USD/JPY – Bullish Breakout Setup (1H Timeframe)I’m currently monitoring the USD/JPY pair on the 1-hour chart. The pair was in a bearish trend earlier, but after forming a Bullish Divergence, it has started to print a series of Higher Highs (HHs) and Higher Lows (HLs) — a classic sign of trend reversal and strength.
I’m planning a Buy Stop entry above the most recent Higher High. If the breakout occurs, I’ll execute the trade based on this bullish continuation setup.
🧠 Technical Confluences:
✅ Bullish Divergence observed — signals momentum shift.
✅ Market Structure shifting to HHs and HLs.
✅ Entry planned above recent HH to confirm breakout.
📊 T rade Setup:
Pair USD/JPY
Timeframe 1H
Trend: Bullish
Entry: Buy Stop @ 144.789
Stop Loss: 143.834
Take Profit 1: 145.744
Take Profit 2: 146.699
Lot Size: 0.15
Risk–Reward 1:1 and 1:2
Risk $200
Reward $300
📌 Trade will be activated only upon confirmation — a break above the previous high. Stick to proper risk management.
🔖 Hashtags:
#USDJPY #Forex #ForexTrading #TechnicalAnalysis #PriceAction #BullishBreakout #ForexSetup #TradeIdeas #MarketStructure #ForexSignals #BuySetup #DivergenceTrading #1HChart #FXMarket #RiskManagement

USD/JPY SELLERS WILL DOMINATE THE MARKET|SHORT
Hello, Friends!
USD-JPY uptrend evident from the last 1W green candle makes short trades more risky, but the current set-up targeting 144.203 area still presents a good opportunity for us to sell the pair because the resistance line is nearby and the BB upper band is close which indicates the overbought state of the USD/JPY pair.
Disclosure: I am part of Trade Nation's Influencer program and receive a monthly fee for using their TradingView charts in my analysis.
✅LIKE AND COMMENT MY IDEAS✅

USDJPY;;;;;; STRONG SELL AND HOLDThe wait was on the volume imbalance at 146...to be test, now that the market has tested it, it gives us the idea of how strong it is, therefore the market will continue to go downward in search of a strong support... so you can have your tp1 at 142 and tp2 at140

Stronger Dollar Pressures Yen on Geopolitical RisksThe Japanese yen fell past 144.2 per dollar on Monday, marking a second day of losses, as the U.S. dollar strengthened on increased safe-haven demand. This followed renewed conflict between Israel and Iran, with both sides targeting energy facilities and pushing oil prices higher. The rise in energy costs may reduce the chances of a near-term Fed rate cut as inflation and trade risks persist. Meanwhile, focus turns to the Bank of Japan’s upcoming policy meeting, where it is expected to keep rates unchanged while assessing the inflation impact of rising oil prices amid global uncertainty.
Resistance is at 145.30, while support stands near 142.50.

USDJPY Long potential setupWhat's going on?
USDJPY – Reload Zone Marked. If They Take Me Out, I’ll Be Waiting Lower.
Discipline means you don’t chase. You wait where the market must return.
Currently in 2 buys, one is an added position, then I moved my stop in from the purple line— but if those get wicked out, I’m hunting the next key demand zone just beneath 144.10. Where we'll have a textbook spring setup!
🧠 What I See:
We're forming a potential micro accumulation structure.
If the current position gets taken out, I’ll reload lower at the spring aligned with the prior reaction low + liquidity sweep zone.
🎯 Next Area of Interest:
Zone: 144.00 – 144.10
📌 Target Remains:
144.76 → 145.36
1.618 extension aligns with supply inefficiencies & range completion
---
> “Stop loss isn’t failure. It’s recon. The second entry — that’s where pros feast.”
I’m not trading emotion. I’m trading plan + precision + execution.

USD/JPY...1h chart pattern..Here's a quick summary of MY USD/JPY trade setup:
---
Trade Idea: SELL USD/JPY @ 144.000
Entry Point: 144.000
Target 1 (TP1): 143.400 → +60 pips
Target 2 (TP2): 142.400 → +160 pips
Suggestions:
Stop Loss (SL): Consider setting a stop loss above recent resistance (e.g., 144.500 or 144.800) to manage risk.
Risk/Reward Ratio:
For TP1: 1:1 with SL @ 144.600
For TP2: ~2.6:1 with SL @ 144.600
Key Technical Zones:
Watch for support near 143.400 (TP1); possible bounce or consolidation.
142.400 is a deeper move — stronger confirmation needed (e.g., a break below 143.400 with volume).
Let me know if you’d like a chart analysis or updates on news that could impact this trade.

USDJPY my analysis Another buy setup for #USDJPY:
- Buy price: 144.000
- Targets:
1. 144.100
2. 144.200
3. 144.300
- Stop Loss (SL): 143.700
You're bullish on USDJPY again! Let's see if it reaches those targets. What's your market outlook – do you expect a strong upward trend?

Potential bullish reversal?USD/JPY is reacting off the pivot and could rise from this level to the 1st resistance.
Pivot: 143.79
1st Support: 139.64
1st Resistance: 148.91
Risk Warning:
Trading Forex and CFDs carries a high level of risk to your capital and you should only trade with money you can afford to lose. Trading Forex and CFDs may not be suitable for all investors, so please ensure that you fully understand the risks involved and seek independent advice if necessary.
Disclaimer:
The above opinions given constitute general market commentary, and do not constitute the opinion or advice of IC Markets or any form of personal or investment advice.
Any opinions, news, research, analyses, prices, other information, or links to third-party sites contained on this website are provided on an "as-is" basis, are intended only to be informative, is not an advice nor a recommendation, nor research, or a record of our trading prices, or an offer of, or solicitation for a transaction in any financial instrument and thus should not be treated as such. The information provided does not involve any specific investment objectives, financial situation and needs of any specific person who may receive it. Please be aware, that past performance is not a reliable indicator of future performance and/or results. Past Performance or Forward-looking scenarios based upon the reasonable beliefs of the third-party provider are not a guarantee of future performance. Actual results may differ materially from those anticipated in forward-looking or past performance statements. IC Markets makes no representation or warranty and assumes no liability as to the accuracy or completeness of the information provided, nor any loss arising from any investment based on a recommendation, forecast or any information supplied by any third-party.
