USD/JPY 1H ShortUSD/JPY 1H – Analysis
🔍 1. Context: Macro Fundamentals
BOJ (Bank of Japan) remains dovish, showing little intention of raising rates significantly.
USD strength continues due to sticky inflation and delayed rate cuts from the Federal Reserve.
Geopolitical risks and U.S. economic resilience further strengthen the dollar.
This macro backdrop supports bearish JPY bias, hence a long USD/JPY setup aligns with the fundamentals.
🧠 2. Structure and Liquidity Analysis
Price recently swept sell-side liquidity (marked by the dip into demand zone).
Strong bullish reaction from a demand block confirms interest from smart money.
The market has now printed a short-term higher low, signaling a possible intent to create a new leg up.
📌 3. Entry, Stop Loss, Target (SMC-Based)
✅ Entry:
At 144.180–144.250 (refinement inside the lower bullish reaccumulation zone).
This zone represents a mitigation of a lower imbalance and offers a favorable risk-reward long.
❌ Stop Loss:
Below 143.880, beneath the refined demand zone and last liquidity sweep — if broken, the bullish narrative is invalidated in this leg.
🎯 Target 1 (Partial):
145.400 — first major supply zone where prior imbalance sits and price previously reversed. Could see first reaction here.
🎯 Target 2 (Final TP):
146.280 – 146.400 — a higher timeframe buy-side liquidity pool and previous distribution origin.
Risk-to-reward is well-optimized at 1:4+, depending on execution precision.
🔄 4. Price Action Expectations
Price may retest the 144.200–144.250 zone (demand).
If order flow remains bullish, expect a clean break of internal high at 145.180.
Watch for reaction at 145.400, but holding partials for a liquidity run toward 146.280+ is justified.
📉 5. Invalidation Scenario
If price breaks and closes below 143.880, we consider:
The demand was not institutional.
A deeper mitigation into the lower demand block near 142.100–141.800 may be required.
✅ Final Outlook
“USD/JPY has completed a sweep of liquidity and is now forming bullish internal structure. With macro favoring USD strength, and current order flow signaling institutional positioning, a long from 144.200 toward 146.280 is a high-probability setup — provided price protects the latest demand block.”
USDJPY_SPT trade ideas

USD/JPY(20250616)Today's AnalysisMarket news:
Trump: The United States may still intervene in the Iran-Israel conflict. If Iran launches an attack on the United States, the United States will "fight back with all its strength on an unprecedented scale." Iran and Israel should reach an agreement.
Technical analysis:
Today's buying and selling boundaries:
143.79
Support and resistance levels:
145.47
144.84
144.43
143.15
142.74
142.12
Trading strategy:
If the price breaks through 144.43, consider buying in, the first target price is 144.84
If the price breaks through 143.79, consider selling in, the first target price is 143.15

USDJPY - Technical AnalysisThere is a possibility to open a short position in this pair.
By analysing the pair on higher timeframes and using a 45-period exponential moving average along with two simple moving averages of 70 and 95 periods (supported by a Parabolic SAR), a selling opportunity arises.
Although the pair has shown a strong bullish move on the monthly timeframe, I believe it will reach the price level of 139.885 again.
This prediction is based on the fact that in April a strong bearish candle was formed, followed in May by a bullish candle that failed to sustain a strong move, unlike what happened previously.
This does not mean the pair won’t continue its bullish trend, but I expect the bullish momentum to strengthen after it reaches the 139.885 level again, possibly with a stronger upward move.
It is important to note that, despite this technical analysis, attention should be paid to news, economic data, and any other factors that may influence this pair, as this is purely a technical perspective.
The short position tool shown on the chart is only meant to support the entry decision for the trade.

USDJPY UPSIDE STREAK SOON TO BE BUILT There seems to be a lot of liquidity downside and since I see the upcoming quarter upside for the USD its clear that the USP against JPY will go stronger.

USD/JPY Approaching Key Buy Zone
USD/JPY is trading above a potential demand zone between 143.827 and 143.449, following a recent bounce. This zone aligns with prior structure support and could act as a re-entry level for bullish momentum.
If price retests and holds this area, a move toward the 144.490 resistance could unfold. A clean break above that level might open the door toward 145.138.
However, a confirmed break below 143.449 would invalidate the bullish idea and signal a potential shift in short-term sentiment.

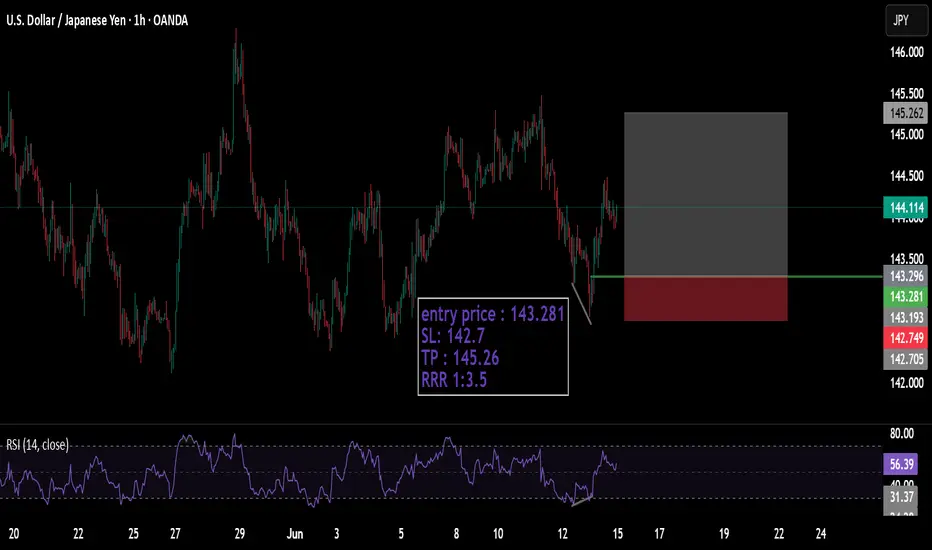
Bullish bounce off 61.8% Fibonacci support?USD/JPY is falling towards the support level which is a pullback support that aligns with the 61.8% Fibonacci retracement and could bounce from this level to our take profit.
Entry: 143.43
Why we like it:
There is a pullback support level that aligns with the 61.8% Fibonacci retracement.
Stop loss: 142.88
Why we like it
There is a pullback support level that lines up with the 61.8% Fibonacci projection.
Take profit: 144.38
Why we like it:
There is an overlap resistance level.
Enjoying your TradingView experience? Review us!
Please be advised that the information presented on TradingView is provided to Vantage (‘Vantage Global Limited’, ‘we’) by a third-party provider (‘Everest Fortune Group’). Please be reminded that you are solely responsible for the trading decisions on your account. There is a very high degree of risk involved in trading. Any information and/or content is intended entirely for research, educational and informational purposes only and does not constitute investment or consultation advice or investment strategy. The information is not tailored to the investment needs of any specific person and therefore does not involve a consideration of any of the investment objectives, financial situation or needs of any viewer that may receive it. Kindly also note that past performance is not a reliable indicator of future results. Actual results may differ materially from those anticipated in forward-looking or past performance statements. We assume no liability as to the accuracy or completeness of any of the information and/or content provided herein and the Company cannot be held responsible for any omission, mistake nor for any loss or damage including without limitation to any loss of profit which may arise from reliance on any information supplied by Everest Fortune Group.

USDJPY Technical Brief: Structure Points Lower
💴 USDJPY: Structure suggests further downside
The upward movement from April 22 to May 12 appears to be corrective — I label it as a double zigzag.
The segment from May 12 to May 27, on the other hand, is highly likely to be an impulse.
After that, the price moved into a range, the boundaries of which are gradually narrowing. This gives reason to assume the formation of a contracting triangle (cT).
If this scenario plays out, we may see:
🔸 a break of the 142.108 low
🔸 a drop toward the 139.883 zone
🔸 an overall potential decline within the 140.8–138.0 range
📎 Link to my long-term FX:USDJPY OANDA:USDJPY FOREXCOM:USDJPY scenario:

USDJPY TRADE SETUPWait for retest the entry level then take a trade for Sell otherwise skip this setup

USDJPY - Medium term prediction - 16/06/25For USD/JPY at 144.11, weighing the daily range (139.58–148.65) and recent price action, I’d estimate roughly:
Slide below 139.58 first ~60%
Rally above 148.65 first ~40%
Reasoning
Range position: We’re in the upper half of a well-defined 139.58–148.65 band—mean regression favors a move back toward the lower boundary.
Failed rallies: Price has tried three times (Feb, Apr, May) to breach 148.65 and faltered, suggesting that resistance remains firm.
Momentum: Recent advances lack conviction—the daily candles are indecisive with wicks on both ends, hinting at exhaustion.
Bearish longer‐term tilt: From last summer’s high (~162), USD/JPY has carved lower highs, putting the overall bias slightly skewed to the downside until a clean break above 148.65.

USDJPY – 4H . [[ TRIANGLE PATTERN ]]Technical Breakdown:
Symmetrical triangle pattern clearly formed with clean ABCDE wave structure.
The price has broken out from the upper resistance (trendline), confirming a bullish breakout scenario.
Next key area to watch is the supply zone near 145.800 – 146.200, where price may either:
Face resistance and retrace,
Or break through for continuation.
---
🔍 Key Levels:
Support Base (Retest zone): ~143.000
Breakout Entry Trigger: Above 144.200
Supply Zone Target: 145.800 – 146.200
Invalidation Level (Break Below Triangle): <142.500
---
🧠 Analysis Insight:
This is a classic triangle consolidation breakout, with price respecting both ascending and descending boundaries before thrusting upward.
Look for possible pullback retest entries before continuation to the supply zone.
Volume and momentum confirmation on breakout is key for sustainability.
---
🎯 Strategy Note:
Use low-risk entry setups on breakout retest.
Ideal for scalp to swing trades, with strong risk-reward structure.

USD/JPY) Bearish trend analysis Read The ChaptianSMC trading point update
Technical analysis iUSD/JPY on the 30-minute timeframe, showing a rejection from resistance zones and a potential move toward lower support levels.
---
Analysis Breakdown
Technical Components:
1. Resistance Zones:
Primary Resistance: Near 145.500 (upper yellow box), which has previously been rejected multiple times (red arrows).
FVG (Fair Value Gap) Resistance Level: Around 144.400, also acting as strong resistance, especially near the EMA 200.
2. Downtrend Line:
The price is moving below a downward trendline, respecting bearish structure.
Last rejection from both the trendline and FVG zone confirms selling pressure.
3. EMA 200 (144.075):
Price is hovering around this level, showing indecision.
Bearish bias remains unless price breaks and holds above it.
4. Target Zone:
A clearly marked support level around 142.543, shown as the bearish target.
Includes multiple event markers (potential news catalysts or key dates), suggesting added volatility.
5. RSI (14):
Currently near 55.23, with a prior rejection from higher RSI levels.
Bearish divergence not clear, but no overbought conditions.
---
Bearish Idea Summary:
Thesis: Rejection from resistance zones + trendline + EMA suggests continuation to downside.
Expecting: Price to either:
Retest the upper resistance zone (around 145.000–145.500) and reject again, or
Break below current levels and continue lower toward 142.543.
---
Trade Idea Concept:
Entry Option 1: Sell on confirmed rejection from FVG zone or upper resistance.
Entry Option 2: Sell on break and retest below 144.000.
Target: 142.543 (support zone).
Stop Loss: Above the resistance zone or trendline (e.g., >145.600).
Mr SMC Trading point
Risks to Watch:
Invalidation: Clean break and close above 145.500 would invalidate the bearish setup.
News Impact: Note the icons near the target zone – monitor economic releases around that time.
---
Please support boost 🚀 this analysis)

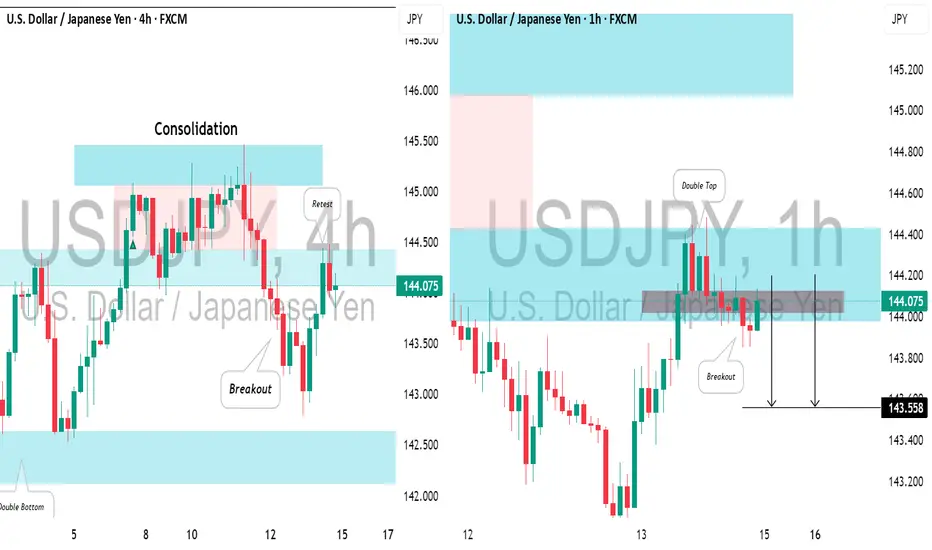
USDJPY: Intraday Bearish ConfirmationIn the middle of last week, I spotted a valid confirmed structure breakout on 📉USDJPY on a 4-hour timeframe.
Currently, the pair is retesting the broken structure, and the price has formed a strong bearish confirmation on the hourly chart.
I see a double top pattern and a violation of its neckline.
With high probability, the price will fall and reach the 144.02 level.
USDJPY Bearish WeekThis is is USDJPY going into the new week. Last week we saw sharp declination in USD price especially after the inflation news. Price may rise a little to create Weekly highs and continue to fall

USDJPY| Bull vs Bear at Key ZoneUpdated the chart and noticed both bullish and bearish order blocks near current price — classic tug-of-war setup, and USDJPY does this often.
Structure is still developing, and the direction will be confirmed through how price reacts on the entry timeframes. Whichever side mitigates first with intent gives the trade.
Until then, it’s observation mode — watching closely and letting price reveal the path.
— Inducement King 👑
Bless Trading!

USDJPY| Bearish Structure in FocusUSDJPY broke a major lower high on the 4H, creating new external liquidity that has yet to be swept. This shift opened the door for potential bearish continuation.
On the 30-minute, I confirmed bearish intent with a major low taken. Structure aligns, but patience is key — I’m only interested in entries within premium pricing.
Now watching for buy-side liquidity to be swept into my marked order block. That reaction will be the signal for possible downside continuation.
Setup is clear. Execution comes with precision.
— Inducement King 👑
Bless Trading!

USDJPYWhat do you think about this? For me I think we should wait for price to clearly move out of the price range to either ways before looking to trade it.

Re-defining Trading Psychology: A Functional ApproachRethinking Trading Psychology: A Functional Definition
Trading psychology is often misunderstood or overly simplified in trading discourse. Psychology, by definition, is the scientific study of the mind and behavior. When applied to trading, trading psychology should be defined as the study of how our mental processes directly influence market structure through behavior—specifically through the act of placing trades.
The Facts: How Humans Influence the Market
Traders interact with the market in only a few meaningful ways:
Placing entries
Setting stop losses
Setting take-profit (target) levels
Though external variables such as news events can impact decision-making, they only affect where we choose to interact with the market—they do not directly move price. Price only responds to order flow , and all order flow originates from trader decisions. Therefore, these three actions—entries, stops, and targets—are the only real mechanisms through which psychology influences price action.
Entry: The Initiator of Market Movement
Entries are typically based on structural cues like engulfing candles or order blocks —price zones where a shift in momentum is visible. These areas act as high-probability triggers that prompt traders to take action in a particular direction.
When enough buy orders are placed at a bullish signal, we see that reflected in the strength and size of bullish candles. Conversely, strong bearish signals generate concentrated sell-side pressure. This collective order flow initiates price movement—entries are the impulse drivers of the market.
Stop Losses: The Creation of Liquidity Pools
Once a position is opened, traders generally place stop losses behind significant structure—often just beyond the order block or engulfing pattern that prompted the entry. These zones become liquidity pools —clusters of pending orders that, when triggered, cause mass exits and reallocation of capital.
When price returns to these zones, it forces traders out of the market, often resulting in sharp movements or false breakouts. This behavior is not coincidental; it is a byproduct of shared psychological behavior manifesting as clustered risk management.
Take-Profits: Delayed Exit Pressure
Alongside stop losses, traders also define target levels where they plan to close their trades. These levels can be calculated based on fixed R-multiples (2R, 3R, etc.) or drawn from contextual zones like previous highs/lows or supply and demand areas.
As price moves into profit and hits these levels, traders begin to exit en masse. This diminishes order flow in the direction of the trade, often leading to hesitation or minor reversals—much like stop losses do when they are hit.
Conclusion: Market Movement vs. Market Stalling
To summarize:
Entries drive market movement
Stop losses and target levels stall or reverse movement
This dynamic defines how human behavior—guided by psychological patterns—actually shapes price. In this framework, engulfments represent entry logic , while liquidity zones represent collective exit logic .
Redefining Trading Psychology
Contrary to popular belief, trading psychology isn’t just about “staying disciplined” or “keeping emotions in check.” While emotional control matters, it’s secondary to understanding how trader behavior creates cause-and-effect loops in price action.
Having a trading plan is important—but deviating from that plan is not always due to emotion alone. It can stem from overconfidence, impulsivity, cognitive bias, or poor conditioning. These are psychological behaviors that affect execution, and thus, affect market movement.
What’s Next
In my next writing, I will explore how the sheer volume of market participants leads to herding behavior —the collective patterns that emerge from mass psychology and their role in creating consolidation zones, liquidity traps, and false breakouts.

USDJPY 1W forecast until September 2025A huge inverted Head&Shoulders has been started. Volatility chop-chop. Left shoulder is ready and the price is heading up to the base at 145.188
In the middle of June we will see a fast fall to print Head bottoming at 138.75
Before printing Right shoulder the price has to visit the base again in the beginning of August 2025
What will happen in September? I will keep posting and updating (if I see necessity) 1W chart here. For 1D weekly updates check 'Also on' in my Profile.

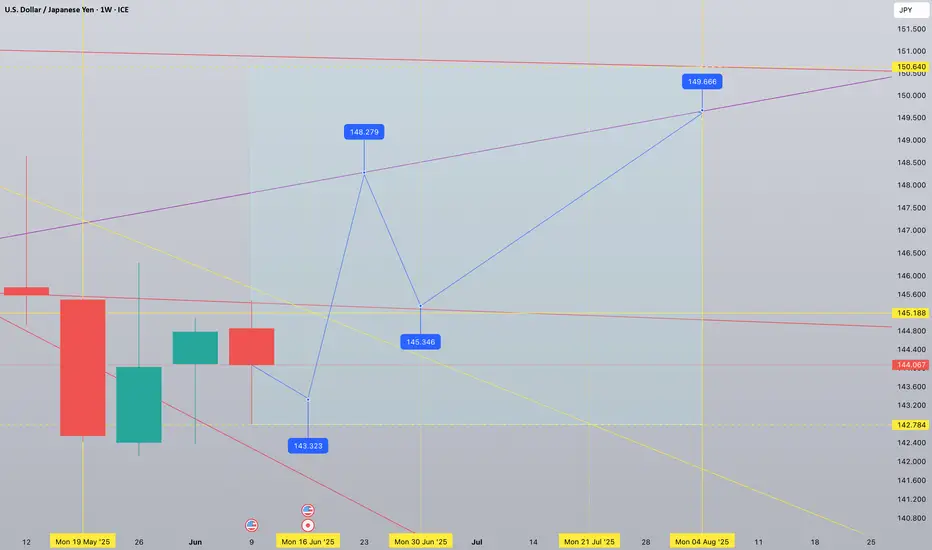
USDJPY 1W tf forecast until August 2025 Current midterm bias is bullish. 150,64 and 142,78 are extreme levels to be respected by the price action. One more week of red week of sideways movement will actually form a reversal pattern followed by a strong upward spike. A powerful breakout to 148,27 is to be retested at 145,34 - healthy retest. July will show an organic growth topping at 149.66 in the beginning of August 2025
USDJPY COT and Liquidity AnalysisHey what up traders welcome to the COT data and Liquidity report. It's always good to go with those who move the market here is what I see in their cards. I share my COT - order flow views every weekend.
🎯 Non Commercials added significant longs and closed shorts at the same time. So for that reason I see the highs as a liquidity for their longs profits taking.
📍Please be aware that institutions report data to the SEC on Tuesdays and data are reported on Fridays - so again we as retail traders have disadvantage, but there is possibility to read between the lines. Remember in the report is what they want you to see, that's why mostly price reverse on Wednesday after the report so their cards are hidden as long as possible. However if the trend is running you can read it and use for your advantage.
💊 Tip
if the level has confluence with the high volume on COT it can be strong support / Resistance.
👍 Hit like if you find this analysis helpful, and don't hesitate to comment with your opinions, charts or any questions.
Analysis done on the Tradenation Charts
Disclosure: I am part of Trade Nation's Influencer program and receive a monthly fee for using their TradingView charts in my analysis.
"Adapt what is useful, reject what is useless, and add what is specifically your own."
— David Perk aka Dave FX Hunter ⚔️

USDJPY: A SELL SETUPOANDA:USDJPY : I'm shorting from the current market price, targeting 140.720 price level.

USDJPY Trading RangeUSDJPY saw some corrections late on Friday. Overall, the pair remains sideways in a wide range of 143,000-145,100 and has yet to establish a clear continuation trend.
The wider band in the sideways trend is extended at 146,000 and 142,000.
The trading strategy will be based on the band that is touched.
Pay attention to the breakout as it may continue the strong trend and avoid trading against the trend when breaking.
Support: 143,000, 142,000
Resistance: 145,000, 146,000
