USDJPY IdeaGuys we got tight sl and huge rr so guys wait for market structure form on low tf then enter from the given zone .
I as well inform when i take order in thegroup.
Please follow to support me . Thank you !
USDJPY_SPT trade ideas

USD/JPY Technical Analysis – Wave 5 Upside Target at 144.67USD/JPY is currently consolidating around the 144.00 level, suggesting the end of wave 4 within a 5-wave impulsive structure. Price action indicates potential for wave 5 to begin, with a projected target near 144.67.
Wave 1 to 3 appears clean and impulsive, with wave 3 extending strongly — a common trait in trending markets.
Wave 4 seems to be forming a flat or shallow zigzag correction, respecting typical retracement territory (between 23.6%–38.2% of wave 3).
If wave 4 holds above 143.80 (your stop), this level serves as the ideal invalidator for the current bullish structure.
Wave 5 would likely aim for 144.67, aligning with the 100% or 123.6% Fibonacci extension of wave 1, projected from wave 4's bottom.
Momentum indicators on lower timeframes are stabilizing, supporting the idea that downside pressure is waning and that the next leg higher may be imminent.
A break above 144.20–144.30 could confirm the wave 5 initiation. As long as price holds above 143.80, the risk-reward remains favorable toward the upside.

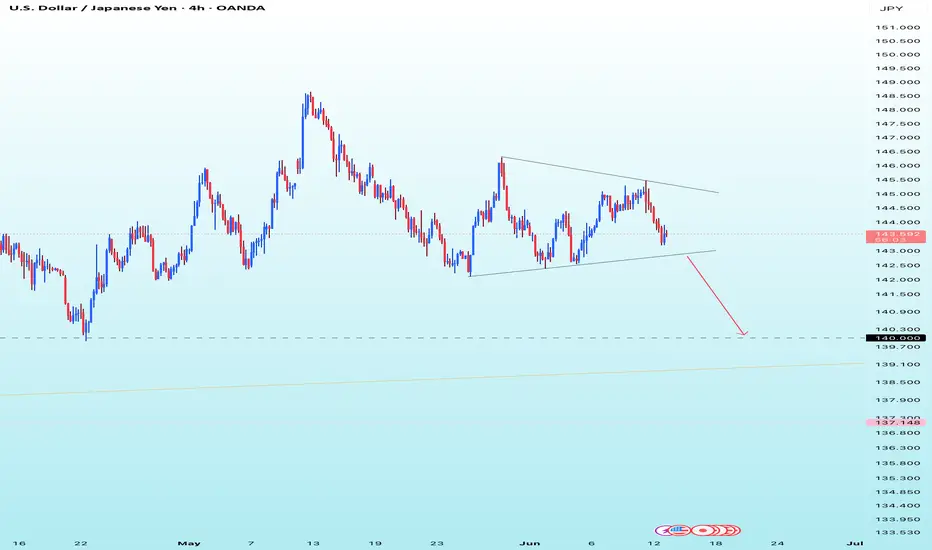
ResellWe are seeing a loss of bullish momentum and we hope that with this analysis the price will resume its downward movement.

USDJPY - BEARISH MOVE!Hello Traders !
The USDJPY failed to create a new higher high!
The price broke the higher low (Change of character).
So, I expect a bearish move📉
________________
TARGET: 142.650🎯

Dollar Momentum Fades | Can 143.07 Hold as Support?USDJPY – Dollar Momentum Fades | Can 143.07 Hold as Support?
🌍 Fundamental & Macro Outlook
USDJPY has faced strong downside pressure recently as risk-off sentiment boosts demand for the Japanese Yen, following escalating tensions between Israel and Iran.
The US Dollar Index (DXY) rallied on geopolitical concerns but is struggling to sustain momentum near the 98.30 resistance zone.
Despite the Bank of Japan's ultra-loose monetary policy, JPY is acting as a safe haven in current global risk conditions.
Traders are awaiting next week’s monetary policy decisions from both the Federal Reserve and the Bank of Japan. Both central banks are expected to keep rates unchanged, but forward guidance could spark major volatility.
According to UOB Group, the dollar's recovery potential is weakening, and further downside toward 142.20 is possible, unless price reclaims the 144.60–144.95 resistance zone.
📉 Technical Analysis – H1 Chart
🔸 Trend Structure
USDJPY remains in a mild downtrend, but price has bounced from the 143.074 key support zone.
A recovery towards 144.624 is in play, but that zone must be cleared for bullish continuation.
🔸 EMA Outlook
Price is currently testing the EMA 89 and 200 — a rejection from this area could trigger another move down.
EMA 13 & 34 are now acting as short-term dynamic support.
🔸 Key Price Zones
Resistance: 144.60 – 145.26
Support: 143.07 – 142.20
🧠 Market Sentiment
Risk aversion continues to dominate as geopolitical headlines drive sentiment.
The Yen is benefitting from capital protection flows despite Japan’s dovish stance.
Large funds may be starting to hedge by rotating into JPY from elevated USD levels.
🎯 Trading Scenarios for June 13
📌 Scenario 1 – Short Setup (Rejection at Resistance)
Entry: 144.60 – 144.90
Stop-Loss: 145.30
Take-Profit: 143.60 → 143.07 → 142.50
📌 Scenario 2 – Long Setup (Rebound from Support)
Entry: 143.10 – 143.20
Stop-Loss: 142.70
Take-Profit: 144.00 → 144.60
✅ Wait for confirmation at key levels — avoid trading in the middle of the range when volatility is headline-driven.
✅ Conclusion
USDJPY remains trapped between strong resistance at 145.26 and buying interest at 143.07. If risk sentiment persists, the Yen may continue to strengthen. However, central bank decisions next week (Fed & BoJ) will be the major catalysts for any medium-term breakout.

USDJPY Strong support formed. Excellent buy opportunity.The USDJPY pair is trading within a Channel Down since the start of the year but following the April 22 Low, it has been rising on Higher Lows. Today that trend-line was tested and again produced a rebound (so far).
Since the April 22 Low was very close to the 139.600 Support (from the September 16 2024 Low), there are higher probabilities that we will have a trend change to bullish, at least for the medium-term.
The natural Resistance now is the 1D MA200 (orange trend-line), so we will target just below it at 148.675 (Resistance 1).
-------------------------------------------------------------------------------
** Please LIKE 👍, FOLLOW ✅, SHARE 🙌 and COMMENT ✍ if you enjoy this idea! Also share your ideas and charts in the comments section below! This is best way to keep it relevant, support us, keep the content here free and allow the idea to reach as many people as possible. **
-------------------------------------------------------------------------------
Disclosure: I am part of Trade Nation's Influencer program and receive a monthly fee for using their TradingView charts in my analysis.
💸💸💸💸💸💸
👇 👇 👇 👇 👇 👇

USDJPY Bull I believe we will have a bullish move before a continuation to the downside. Possibly of reversing at 148.500.


Yen Rallies as Risk Aversion ReturnsThe Japanese yen strengthened to approximately 143 per dollar, marking a third consecutive day of gains as investors turned to safe-haven assets following Israel’s preemptive strike on Iran. The operation, aimed at nuclear facilities, heightened global risk aversion. Adding to market uncertainty were renewed U.S. tariff threats by Trump. Meanwhile, BoJ Governor Ueda reiterated the bank’s readiness to raise interest rates if inflation nears the 2% target.
Resistance is at 145.30, while support stands near 142.50.

CHECK USDJPY SIGNAL READ CAPTAIN Trade Setup Details (USD/JPY):
Entry Price: 143.750 (marked in grey)
Current Price: 143.837
Stop Loss: 143.400 🔻
Take Profit Levels:
TP1: ~144.100
TP2: ~144.400
Last Target: 144.700 🎯

CHECK USDJPY SIGNAL READ CAPTAINusdjpy buy now ✅
entry point (143.600) (143.700)
TAKE PROFIT 1: (144.000)
TAKE PROFIT 2: (144.400)
LAST TARGET (144.800)
STOP LOSS (143.250)

USDJPY Daily Analysis – Bullish Opportunity Brewing USDJPY has bounced off the strong demand zone (orange box) multiple times, signaling solid buyer interest near 140.550 – 141.855. Price is currently reacting bullishly after testing this zone again, forming a potential higher low—a classic bullish continuation signal.
🔵 The 150.635 resistance remains a mid-term target, but a clean break above it could open the way toward the major supply zone around 160.606 where heavy institutional interest may come in.
🟨 Notice how price has respected this demand zone since late 2023, forming a possible accumulation range. With upcoming U.S. economic data (highlighted by the flag icons), volatility is expected—traders should be prepared for a strong breakout move.
---
📌 Trade Idea:
Buy Limit: 141.800 (inside demand zone)
SL: 139.800 (below support structure)
TP1: 150.635
TP2: 160.000+
✅ Risk-Reward: Favorable
📈 Trend: Bullish on confirmation of higher low
---
🔍 Watchlist Add-On: If price fails to hold above 140.550, sellers might retest 137.000 zones. Manage risk accordingly.
📅 Upcoming Events: Watch for NFP, CPI, and BoJ pressers—high volatility expected.
---
💬 Drop your thoughts in the comments—Bullish or Bearish bias on USDJPY?
📌 Don’t forget to LIKE and FOLLOW for daily FX setups! 🔔
#USDJPY #ForexTrading #PriceAction #SmartMoney #SupplyAndDemand #FXSetup #TradingView #TechnicalAnalysis #LuxAlgo #FrankFx14

USDJPYThe USDJPY has weakened as US yields fall and the Fed signals a dovish tilt, while the BoJ holds steady.
The pair is likely to remain under pressure if US yields continue to decline and the Fed moves closer to rate cuts, narrowing the US-Japan yield gap further.
#USDJPY

Price action Usdjpy as I had previously mentioned is currently bullish break of structure at this point

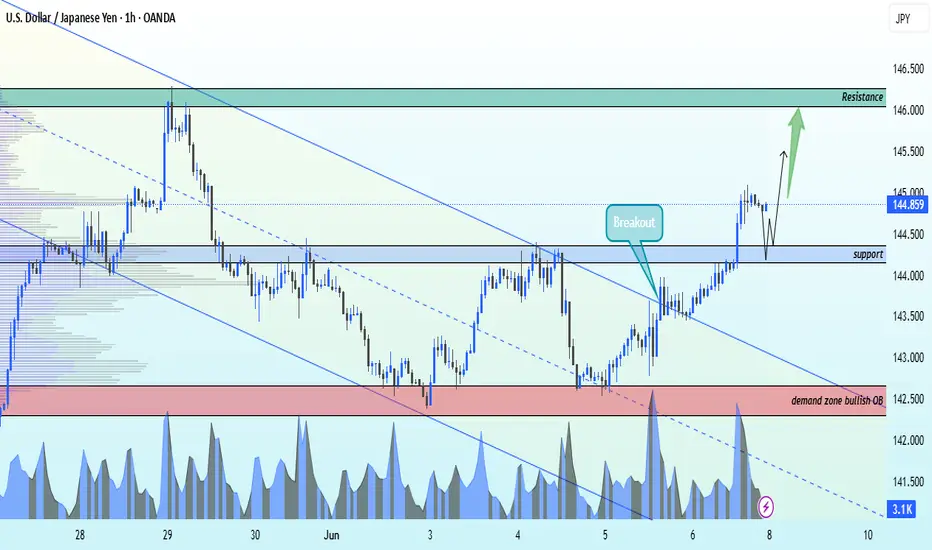
USDJPY has breakout the descending channel bullish strong nowFX:USDJPY Alert – Bullish Breakout in Play!
1H Timeframe | Descending Channel Breakout
📈 Entry: 144.300
🎯 Target 1: 146.000 (Key Resistance)
🛡️ Stop Loss: 142.700 (Demand Zone / Bullish OB)
After a clean breakout above the descending channel, USDJPY is showing strong bullish momentum. Price action confirms a potential move toward the next resistance level.
🔍 Technicals are lining up. Risk managed. Eyes on the prize.
✨ Like, Follow, Comment & Join us for more real-time setups and updates!
📊 Let’s trade smart. Let’s trade together.
#USDJPY #ForexTrading #BreakoutSetup #TechnicalAnalysis #LiviaTrades 😜📉📈
USD/JPY(20250613)Today's AnalysisMarket news:
The number of initial jobless claims in the United States for the week ending June 7 was 248,000, higher than the expected 240,000, the highest since the week of October 5, 2024. The monthly rate of the core PPI in the United States in May was 0.1%, lower than the expected 0.30%. Traders once again fully priced in the Fed's two interest rate cuts this year.
Technical analysis:
Today's buying and selling boundaries:
143.73
Support and resistance levels:
145.09
144.58
144.25
143.21
142.88
142.37
Trading strategy:
If the price breaks through 143.73, consider buying in, the first target price is 144.25
If the price breaks through 143.21, consider selling in, the first target price is 142.88

trend lineUSD/JPY Technical Analysis – 1H Chart
Price is currently testing a key confluence support zone formed by the ascending channel's lower boundary and the horizontal level at 142.78. A bullish rejection candle suggests a potential rebound toward the 143.88 resistance level. If this level breaks, further upside toward the upper channel boundary is likely. However, a confirmed break below 142.78 could signal bearish continuation. Monitor price action closely for confirmation.

Bearish drop?USD/JPY has rejected off the pivot which is an overlap resistance and could drop to the 1st support.
Pivot: 143.94
1st Support: 142.68
1st Resistance: 144.52
Risk Warning:
Trading Forex and CFDs carries a high level of risk to your capital and you should only trade with money you can afford to lose. Trading Forex and CFDs may not be suitable for all investors, so please ensure that you fully understand the risks involved and seek independent advice if necessary.
Disclaimer:
The above opinions given constitute general market commentary, and do not constitute the opinion or advice of IC Markets or any form of personal or investment advice.
Any opinions, news, research, analyses, prices, other information, or links to third-party sites contained on this website are provided on an "as-is" basis, are intended only to be informative, is not an advice nor a recommendation, nor research, or a record of our trading prices, or an offer of, or solicitation for a transaction in any financial instrument and thus should not be treated as such. The information provided does not involve any specific investment objectives, financial situation and needs of any specific person who may receive it. Please be aware, that past performance is not a reliable indicator of future performance and/or results. Past Performance or Forward-looking scenarios based upon the reasonable beliefs of the third-party provider are not a guarantee of future performance. Actual results may differ materially from those anticipated in forward-looking or past performance statements. IC Markets makes no representation or warranty and assumes no liability as to the accuracy or completeness of the information provided, nor any loss arising from any investment based on a recommendation, forecast or any information supplied by any third-party.

usd/jpyTRADE 1 i belive price will drop to the take profit mark and we will see i belive price will still go on the up as i still belive the market is bullish but if it brekas the surport line and retraces and uses the surport as resitance i belive there could be a new bearish pattern

Potential bearish drop?USD/JPY is rising towards the resistance level which is a pullback resistance that aligns with the 38.2% Fibonacci retracement and could drop from this level to ur take profit.
Entry: 144.11
Why we like it:
There is a pullback resistance level that lines up with the 38.2% Fibonacci retracement.
Stop loss: 145.07
Why we like it:
There is a pullback resistance level that lines up with the 78.6% Fibonacci retracement.
Take profit: 142.00
Why we like it:
There is a pullback support level that is slightly below the 78.6% Fibonacci projection.
Enjoying your TradingView experience? Review us!
Please be advised that the information presented on TradingView is provided to Vantage (‘Vantage Global Limited’, ‘we’) by a third-party provider (‘Everest Fortune Group’). Please be reminded that you are solely responsible for the trading decisions on your account. There is a very high degree of risk involved in trading. Any information and/or content is intended entirely for research, educational and informational purposes only and does not constitute investment or consultation advice or investment strategy. The information is not tailored to the investment needs of any specific person and therefore does not involve a consideration of any of the investment objectives, financial situation or needs of any viewer that may receive it. Kindly also note that past performance is not a reliable indicator of future results. Actual results may differ materially from those anticipated in forward-looking or past performance statements. We assume no liability as to the accuracy or completeness of any of the information and/or content provided herein and the Company cannot be held responsible for any omission, mistake nor for any loss or damage including without limitation to any loss of profit which may arise from reliance on any information supplied by Everest Fortune Group.

USDJPY: Bottom formation successful. Strong buy.USDJPY is neutral on its 1D technical outlook (RSI = 46.191, MACD = -0.020, ADX = 12.744) as it is consolidating around the 1D MA50. This is the bottom formation process straight after rebounding on the S1 Zone. The wider pattern is a Descending Triangle and the bottom formation suggests that the new bullish wave is about to be initiated. Go long and target the 0.618 Fibonacci level (TP = 153.500).
## If you like our free content follow our profile to get more daily ideas. ##
## Comments and likes are greatly appreciated. ##

USDJPY is forming a bear flag since march2022, it will dumpUSDJPY is inside of a bear flag since march2022 with very strong signs of selling , bearish divergences in the high timeframes alongside with the DXY that aswell is showing strong bearish signs it could reach the lower side of the bear flag at the 140,000 lows and if can't hold there, it will possibly go to the next strong level between 130,000 and 120,000.
