USDJPY
Over the past year, the yen has appreciated significantly against the dollar.
Interest Rate Decisions
Federal Reserve (Fed):
The Fed’s policy rate remains at 4.25–4.50%, with markets increasingly expecting a rate cut as US inflation data cools and labor market data softens.
Bank of Japan (BoJ):
The BoJ’s short-term policy rate is set at 0.5% (unchanged since March 2025), and the central bank continues a cautious approach, with no recent hikes or major policy shifts.
10-Year Government Bond Yields
US 10-Year Treasury Yield:
Recently declined to around 4.348% after softer US inflation data, reflecting expectations of Fed easing.
Japan 10-Year Government Bond Yield:
Stands at approximately 1.45%, having edged lower amid strong demand at recent bond auctions and the BoJ’s continued yield curve control.
Implications for USDJPY
The narrowing yield differential between US and Japanese 10-year bonds (now roughly 2.93%) is a key driver of the yen’s recent strength against the dollar.
As US yields fall on expectations of Fed rate cuts, the appeal of the dollar over the yen diminishes, supporting further yen appreciation.
The BoJ remains cautious, but with inflation in Japan still below target and growth subdued, there is little pressure for rate hikes, keeping the policy gap wide but shrinking as the Fed pivots dovish.
Conclusion
The USDJPY has weakened as US yields fall and the Fed signals a dovish tilt, while the BoJ holds steady.
The pair is likely to remain under pressure if US yields continue to decline and the Fed moves closer to rate cuts, narrowing the US-Japan yield gap further.
#USDJPY
USDJPY_SPT trade ideas

Possible bullish outlook Seeing a break f it's previous minor structure, I would be watching this level for a possible bullish rentry aiming to take out the 4h major high

The US dollar retreats as the Japanese yen stages a resurgence.The USD/JPY has continued to decline, hitting a low of around 143.50 during the European session, marking a new weekly low. In terms of exchange rate dynamics, the key support level lies at 142.500, which has withstood multiple tests recently without being breached. A valid break below this level would open up further downward space, with the next support to be monitored at 141.78 (lower Bollinger Band). On the upside, resistance is seen near 145.500, a level that has repeatedly formed phased highs and suppressed price rebounds.
Humans need to breathe, and perfect trading is like breathing—maintaining flexibility without needing to trade every market swing. The secret to profitable trading lies in implementing simple rules: repeating simple tasks consistently and enforcing them strictly over the long term.

USD/JPY bounces off trend but risks tilted to downsideWith equity markets well off their earlier lows, the USD/JPY is also bouncing back, although it is not out of the woods yet with risks remaining tilted to the downside amid signs of weak inflation data and Trump's tariff threats.
Technically, the USD/JPY has been in consolidation mode, but a potential break of the trend line could trigger a sharp drop towards 142.00 and then 140.00.
For now, the trend line is providing support, but with the dollar slumping against other currencies, the USDJPY could also take a tumble should we see renewed weakness in stocks.
Resistance comes in at around 144.00.
By Fawad Razaqzada, market analyst with FOREX.com

usdjpy bias analysis expecting this tap and fall on uj as dxy continues to fall. However fundamental reasons are also indicating a reversal in this strong bearish trend dxy has be following.
USDJPY MULTI TIME FRAME ANALYSISHello traders , here is the full multi time frame analysis for this pair, let me know in the comment section below if you have any questions , the entry will be taken only if all rules of the strategies will be satisfied. wait for more price action to develop before taking any position. I suggest you keep this pair on your watchlist and see if the rules of your strategy are satisfied.
🧠💡 Share your unique analysis, thoughts, and ideas in the comments section below. I'm excited to hear your perspective on this pair .
💭🔍 Don't hesitate to comment if you have any questions or queries regarding this analysis.

CHECK USDJPY SIGNAL READ CAPTAINuadjpy buy now ✅
entry point (143.750) (143.650)
TAKE PROFIT 1: (144.000)
TAKE PROFIT 2: (144.300)
LAST TARGET (144.600)
STOP LOSS (143.300)

USD/JPY) bearish Technical Analysis Read The captionSMC trading point update
Technical analysis of USD/JPY (U.S. Dollar vs. Japanese Yen) on the 4-hour timeframe. Here's a breakdown of the analysis:
---
Trend & Price Action
The chart shows a descending trendline connecting recent lower highs, indicating a downtrend.
Current price: 143.548
Price has recently rejected off the trendline and started to fall, suggesting continued bearish momentum.
A red arrow marks the rejection point, emphasizing a key resistance area.
---
Technical Indicators
EMA 200 (Exponential Moving Average): At 144.459 — the price is currently below the EMA, reinforcing the bearish outlook.
RSI (Relative Strength Index):
RSI (14) values: around 35.45, which is near the oversold threshold (30) but not quite there yet.
Indicates increasing bearish momentum but no reversal signal yet.
---
Support Levels Identified
1. Support Level (Target 1): ~142.280
First target point for bears. Likely to see some reaction or consolidation here.
2. Big Support Level (Target 2): ~140.382
A stronger, more significant support zone and a deeper bearish target if the first support breaks.
---
Bearish Target Scenario
The projected path (in black lines) suggests:
A further drop into the 142.280 zone.
If that breaks, a continuation toward the 140.382 level.
This suggests a swing trade setup favoring short positions if the price respects the current rejection zone.
Mr SMC Trading point
---
Conclusion
Bias: Bearish
Resistance Confirmed: Rejection from descending trendline and below EMA200.
Bearish Targets:
Short-term: 142.280
Medium-term: 140.382
Risk Management: Watch RSI for potential bullish divergence near the second support zone, which could indicate reversal or consolidation.
---
Please support boost 🚀 this analysis)

Fundamental Market Analysis for June 12, 2025 USDJPYThe Japanese Yen (JPY) is strengthening for the second day in a row against a weakened US Dollar (USD) and is moving further away from the two-week low reached the day before. The market's initial reaction to news of trade talks between the US and China faded rather quickly after US President Donald Trump threatened new tariffs. This, along with rising geopolitical tensions, curbs investors' appetite for risky assets and maintains the yen's status as a safe-haven currency.
In addition, the yen is further supported by expectations that the Bank of Japan (BoJ) may tighten monetary conditions amid signs of rising inflation in Japan. On the other hand, the US Dollar looks vulnerable near one-month lows as weaker US consumer inflation data released on Wednesday confirmed expectations that the Federal Reserve (Fed) will resume its rate-cutting cycle in September. This, in turn, led the USD/JPY pair to fall below 143.50 in the last hour.
Trade recommendation: SELL 143.30, SL 144.30, TP 141.30

USDJPY Will Go Up From Support! Long!
Please, check our technical outlook for USDJPY.
Time Frame: 1h
Current Trend: Bullish
Sentiment: Oversold (based on 7-period RSI)
Forecast: Bullish
The market is approaching a key horizontal level 143.827.
Considering the today's price action, probabilities will be high to see a movement to 144.499.
P.S
We determine oversold/overbought condition with RSI indicator.
When it drops below 30 - the market is considered to be oversold.
When it bounces above 70 - the market is considered to be overbought.
Disclosure: I am part of Trade Nation's Influencer program and receive a monthly fee for using their TradingView charts in my analysis.
Like and subscribe and comment my ideas if you enjoy them!

CHECK USDJPY SIGNAL READ CAPTAIN Key Levels:
Entry Point: Around 143.950
Stop Loss: Approximately 143.800
Take Profit 1: Close to 144.100
Take Profit 2: Around 144.300
Last Target: About 144.500

USD/JPY H1 | Bearish downtrend to extend deeper?USD/JPY is rising towards a pullback resistance and could potentially reverse off this level to drop lower.
Sell entry is at 144.10 which is a pullback resistance that aligns with the 23.6% Fibonacci retracement.
Stop loss is at 144.80 which is a level that sits above the 61.8% Fibonacci retracement and an overlap resistance.
Take profit is at 143.37 which is a pullback support.
High Risk Investment Warning
Trading Forex/CFDs on margin carries a high level of risk and may not be suitable for all investors. Leverage can work against you.
Stratos Markets Limited (tradu.com ):
CFDs are complex instruments and come with a high risk of losing money rapidly due to leverage. 63% of retail investor accounts lose money when trading CFDs with this provider. You should consider whether you understand how CFDs work and whether you can afford to take the high risk of losing your money.
Stratos Europe Ltd (tradu.com ):
CFDs are complex instruments and come with a high risk of losing money rapidly due to leverage. 63% of retail investor accounts lose money when trading CFDs with this provider. You should consider whether you understand how CFDs work and whether you can afford to take the high risk of losing your money.
Stratos Global LLC (tradu.com ):
Losses can exceed deposits.
Please be advised that the information presented on TradingView is provided to Tradu (‘Company’, ‘we’) by a third-party provider (‘TFA Global Pte Ltd’). Please be reminded that you are solely responsible for the trading decisions on your account. There is a very high degree of risk involved in trading. Any information and/or content is intended entirely for research, educational and informational purposes only and does not constitute investment or consultation advice or investment strategy. The information is not tailored to the investment needs of any specific person and therefore does not involve a consideration of any of the investment objectives, financial situation or needs of any viewer that may receive it. Kindly also note that past performance is not a reliable indicator of future results. Actual results may differ materially from those anticipated in forward-looking or past performance statements. We assume no liability as to the accuracy or completeness of any of the information and/or content provided herein and the Company cannot be held responsible for any omission, mistake nor for any loss or damage including without limitation to any loss of profit which may arise from reliance on any information supplied by TFA Global Pte Ltd.
The speaker(s) is neither an employee, agent nor representative of Tradu and is therefore acting independently. The opinions given are their own, constitute general market commentary, and do not constitute the opinion or advice of Tradu or any form of personal or investment advice. Tradu neither endorses nor guarantees offerings of third-party speakers, nor is Tradu responsible for the content, veracity or opinions of third-party speakers, presenters or participants.

BUY USDJPYUSDJPY should continue the journey up from this demand area. We saw price quickly escalate beginning of this month, yesterday, we sent out a sell setup you can refer to, it has hit tp and now it is time to move up again. The double bottom is confirms the possible bullish continuation.
Bullish Hourly double bottom CoChCOCH just whispered — that uply move isn’t just flexin’. We flipped the tone, and now it’s dancing its way up, snatching those inefficiencies clean. No cap, it's heading to hourly supplies like it owes them money. Just sit back and let it fill up that imbalance buffet. Only real ones see it before the chart admits it. I set also a pendin order as i enter 0.5% and anoter 0.5% below to reinforce.

UJ Finally Showing Bearish Momentum After 2 Weeks of Patience
After nearly two weeks of waiting and watching price consolidate around key levels, bearish movement is finally emerging.
Structure suggests that this downtrend could continue into the end of the week. Staying disciplined pays off — now let’s see if price continues respecting the setup.

usd/jpytrade 1 continue the trade on the bearish and wait for new levels to be hit as u can see its already in the green from our last trade so we really just conituing the move

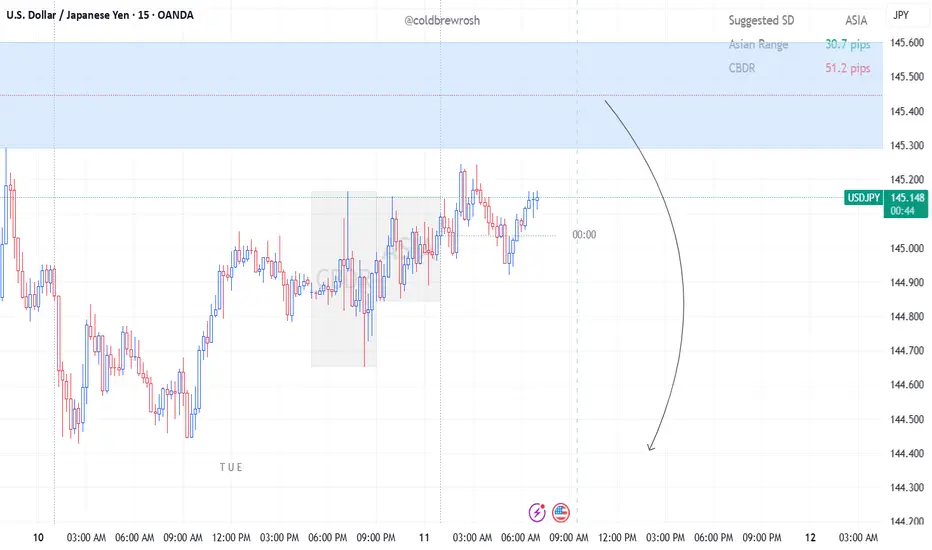
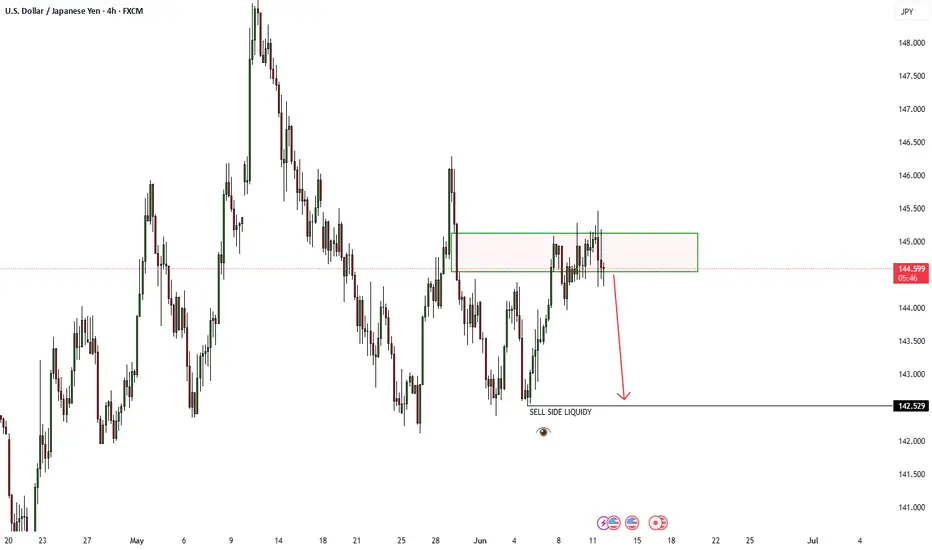
USDJPY 11/06/2025 - Sell side liquidity on 4HRUSDJPY 11/06/2025 - Sell side liquidity on 4HR
Price stuck in bearish 4HR FVG, potential downtrend towards sell side liquidity marked.
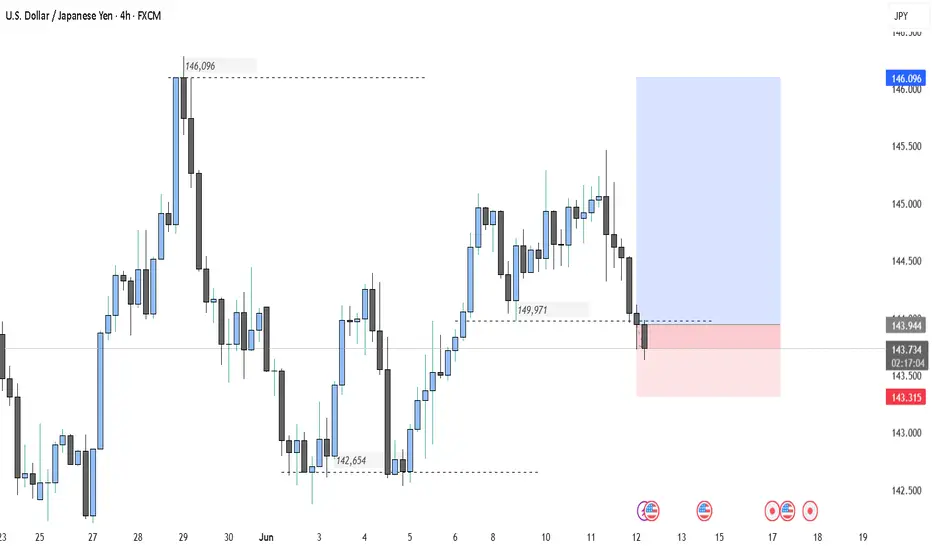
Potential bearish drop?USD/JPY has reacted off the resistance level which is a pullback resistance and could drop from this level to our take profit.
Entry: 144.74
Why we like it:
There is a pullback resistance level.
Stop loss: 145.46
Why we like it:
There is a pullback resistance level.
Take profit: 143.94
Why we like it:
There is an overlap support level that lines up with the 50% Fibonacci retracement.
Enjoying your TradingView experience? Review us!
Please be advised that the information presented on TradingView is provided to Vantage (‘Vantage Global Limited’, ‘we’) by a third-party provider (‘Everest Fortune Group’). Please be reminded that you are solely responsible for the trading decisions on your account. There is a very high degree of risk involved in trading. Any information and/or content is intended entirely for research, educational and informational purposes only and does not constitute investment or consultation advice or investment strategy. The information is not tailored to the investment needs of any specific person and therefore does not involve a consideration of any of the investment objectives, financial situation or needs of any viewer that may receive it. Kindly also note that past performance is not a reliable indicator of future results. Actual results may differ materially from those anticipated in forward-looking or past performance statements. We assume no liability as to the accuracy or completeness of any of the information and/or content provided herein and the Company cannot be held responsible for any omission, mistake nor for any loss or damage including without limitation to any loss of profit which may arise from reliance on any information supplied by Everest Fortune Group.

USD/JPY – Short-term bullish structure within a larger downtrendThe USD/JPY pair has been in a well-established downtrend on the daily timeframe, showing consistent weakness over recent weeks.
Daily timeframe
The pair recently bounced from a significant and well-respected support zone around the $140.00 level. This area has historically provided a strong base for price, and once again, it appears to be holding as reliable support. Although the overall daily trend remains bearish, this bounce introduces the potential for a short-term retracement or consolidation phase.
Clear Rising Trendline on the 4H Chart
Zooming into the 4-hour timeframe, the price action shows a notable shift in momentum. A clear rising trendline has formed, acting as a dynamic support level and guiding the pair higher in the short term. As long as this trendline remains intact and unbroken, the bullish bias on the 4H remains valid. This upward move suggests a corrective phase within the broader daily downtrend, supported by increasing demand at higher lows.
Approaching Key Resistance — FVG and 0.786 Fibonacci Level
The pair is currently approaching a key resistance area near the $145.50 level. This zone aligns with the 4-hour Fair Value Gap (FVG) left by the previous strong downward move and coincides with the 0.786 Fibonacci retracement level, measured from the most recent swing high to swing low. A few days ago, price action briefly tested the lower boundary of this FVG but failed to fully fill the imbalance. Given the current momentum, another attempt to fill the entire FVG and test the 0.786 Fibonacci level is likely. This confluence of technical factors creates a strong resistance zone that could trigger significant price reactions, potentially resuming the broader downtrend.
Target Levels — Where to Look for Reversal or Profit-Taking
A sensible short-term target would be the previous lower high around the $144.00 level. This zone may serve as an initial resistance or take-profit area before price challenges the $145.50 resistance region. Additionally, if the pair breaks below the rising trendline on the 4H, this $144.00 zone could become a support level from which the pair might attempt another move higher.
Conclusion
To summarize, the USD/JPY pair remains in a broader daily downtrend but has shown signs of short-term strength after bouncing from the $140.00 support zone. On the 4-hour timeframe, bullish momentum is evident, supported by a rising trendline and upward movement toward a significant resistance area. Traders should closely watch the $145.50 zone, as it represents a confluence of the FVG and 0.786 Fibonacci retracement — both of which could act as a strong ceiling for price. Until the rising trendline breaks, the short-term outlook remains cautiously bullish, but the medium-term bias leans bearish if resistance holds and selling pressure resumes.
Disclosure: I am part of Trade Nation's Influencer program and receive a monthly fee for using their TradingView charts in my analysis.
Thanks for your support.
- Make sure to follow me so you don't miss out on the next analysis!
- Drop a like and leave a comment!


Bullish usdjpyAfter being rejected at the 144.3 it’s mostly like price will try and retest 146.00 to have a clear direction
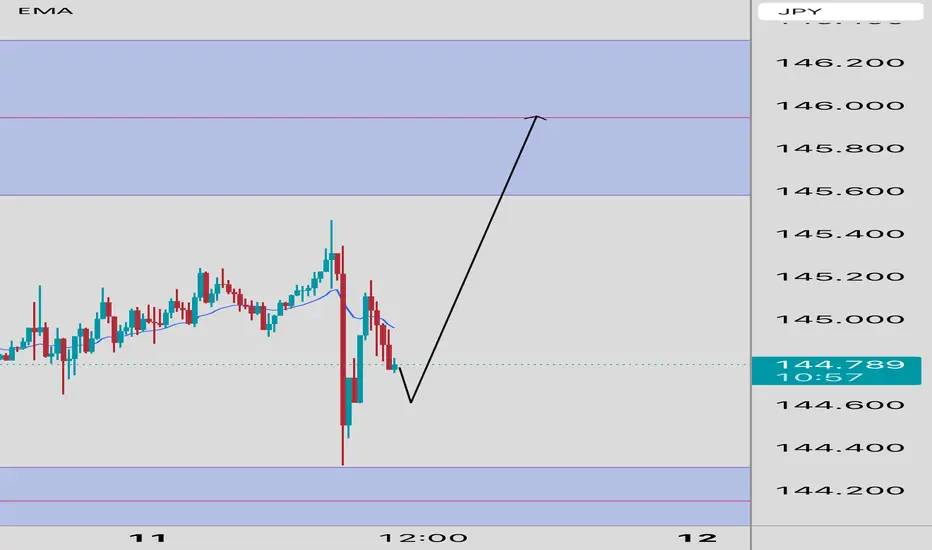
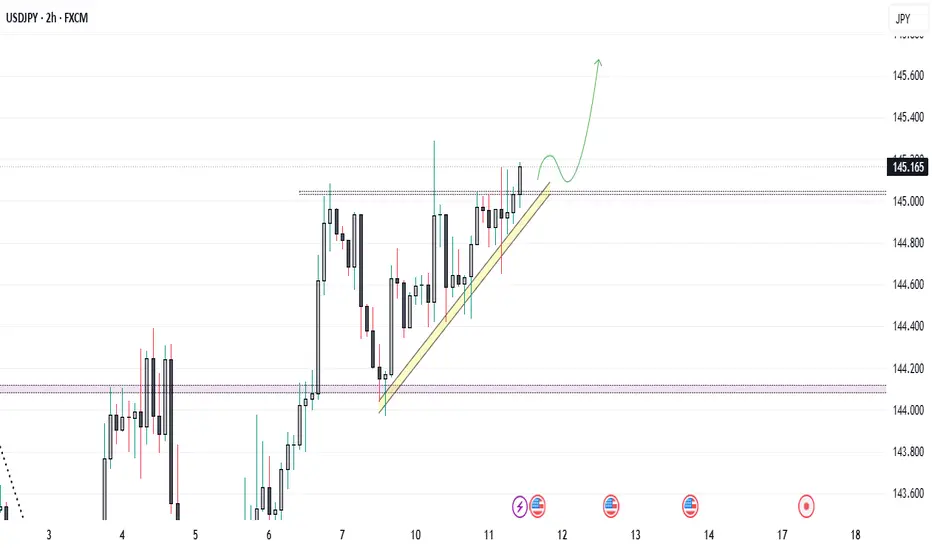
USD/JPY Gearing Up for Breakout ? Watch 145.20...USD/JPY Technical Setup – Bullish Continuation in Play?
USD/JPY is currently respecting a short-term ascending trendline, indicating sustained buying interest. The price consolidates just below a key resistance zone around 145.20, suggesting a potential breakout setup.
🔍 Key Technical Highlights:
* 📈 Trendline Support: Price has consistently respected this ascending trendline, forming higher lows—a strong bullish signal.
* 🔲 Resistance Zone: The 145.15–145.20 level has acted as a rejection zone previously. A breakout above this could invite momentum buying.
* 🕐 Consolidation Range: The market is coiling tightly just below resistance—watch for a volatility expansion.
* 🔮 Projection : If the price holds above the trendline and breaks 145.20 convincingly, we could see a bullish move towards 145.60+.
⚠️ Invalidation: A clean break below the trendline and 144.80 could shift the short-term bias back to neutral or bearish.
Sell attempt on USDJPY ahead of the news.We're going for a sell attempt ahead of the news on USDJPY.
Our idea is that we sell at market with a stop loss at 146.14.
That will give us a risk to reward of 1 to 1.7 (not that great). But we will calculate our position (1% risk) based on these levels.
After the news volatility has ended entirely we will then put our stop back to where it would normally be, above the high of the last 1hr green candle, after which our risk to reward will then turn into something around 1 to 5!
