USDJPY 15MIt seems you've uploaded a chart image. This is a TradingView chart showing the U.S. Dollar/Japanese Yen (USD/JPY) pair on a 15-minute timeframe. The chart includes a potential sell setup based on a descending trendline and shows a target price zone with a directional arrow indicating a potential price drop.
Would you like to discuss this chart in more detail, or do you have specific questions about it?
USDJPY_SPT trade ideas

USDJPY Analysis Today: Technical and Order Flow !In this video I will be sharing my USDJPY analysis today, by providing my complete technical and order flow analysis, so you can watch it to possibly improve your forex trading skillset. The video is structured in 3 parts, first I will be performing my complete technical analysis, then I will be moving to the COT data analysis, so how the big payers in market are moving their orders, and to do this I will be using my customized proprietary software and then I will be putting together these two different types of analysis.

USDJPY - MR.GRINGO ThinkingsHello everybody.
Today, we have some discussion about this pair but only with using Technical ways.
The pair right now is very long, maybe 80 days' time period in trouble situation. I mean, the bears have the market of it...
As we see, this 80 day was so strong bearish range, but it's great try for bulls now!
We may have a hope, the price will go up with this next side of the acceding triangular figures.
We may open long position on the price 143.603 or Just make entry for long now.
If you will follow this trading idea, there we will have "the main" resistance levels.
They are...
1. 145.735
2. 146.892
3. 148.048 yes. so I recommend this price levels, because the market will check it maybe later... For sure if you think buy.
Have a profit maker day! :) ^)

USDJPY: Strong Intraday Bullish Price Action 🇺🇸🇯🇵
On the today's live stream, we discussed a very bullish setup
on USDJPY.
The price retested a recently broken horizontal resistance.
A resistance line of a falling wedge pattern was violated with
a strong bullish movement then.
We see its retest at the moment.
I think that the price will resume growth soon and reach 145.25 level.
❤️Please, support my work with like, thank you!❤️
I am part of Trade Nation's Influencer program and receive a monthly fee for using their TradingView charts in my analysis.

#USDJPY: +2000 PIPS Big Swing Move! Do not miss outThe cryptocurrency’s price is currently experiencing bearish pressure, and the current trading price is pivotal for determining its future trajectory. A smooth downtrend is anticipated, potentially propelling the price to 124 in the long term. The US dollar is likely to remain bearish, potentially reaching 95 in the US currency index. Three potential target sets are envisaged, and further updates will be provided based on price developments.
Best of luck and ensure safe trading practices.
Team Setupsfx_

USDJPY BREAKDOWNUSDJPY has a potential fail of H4 structure and probably building volume for an M style structure. Now I'm looking for H1 2 touch with 15M IE LONG. Unless it respect the 123 on h1 and give a short term sell/ go further down invalidating a potential pre M style long.

USDJPY BUY OPPORTUNITY Price is trending bullish on the H1 timeframe. We can clearly tell that price is moving and respecting the trendline. I anticipate bullish price action to develop away from the current price. Target profit level is at 146.000
Take advantage of this opportunity

Usd/Jpy intra-day Analysis 10-Jun-25Sharing the possible scenarios we could have on Usd/Jpy.
Keeping in mind that the Volume is still slow since start of the week, and investors are waiting for the next set of important economic data which is starting tomorrow with the US CPI (inflation number).
Disclaimer: easyMarkets Account on TradingView allows you to combine easyMarkets industry leading conditions, regulated trading and tight fixed spreads with TradingView's powerful social network for traders, advanced charting and analytics. Access no slippage on limit orders, tight fixed spreads, negative balance protection, no hidden fees or commission, and seamless integration.
Any opinions, news, research, analyses, prices, other information, or links to third-party sites contained on this website are provided on an "as-is" basis, are intended only to be informative, is not an advice nor a recommendation, nor research, or a record of our trading prices, or an offer of, or solicitation for a transaction in any financial instrument and thus should not be treated as such. The information provided does not involve any specific investment objectives, financial situation and needs of any specific person who may receive it. Please be aware, that past performance is not a reliable indicator of future performance and/or results. Past Performance or Forward-looking scenarios based upon the reasonable beliefs of the third-party provider are not a guarantee of future performance. Actual results may differ materially from those anticipated in forward-looking or past performance statements. easyMarkets makes no representation or warranty and assumes no liability as to the accuracy or completeness of the information provided, nor any loss arising from any investment based on a recommendation, forecast or any information supplied by any third-par ty.

USDJPY Is Going Up! Long!
Here is our detailed technical review for USDJPY.
Time Frame: 2h
Current Trend: Bullish
Sentiment: Oversold (based on 7-period RSI)
Forecast: Bullish
The market is approaching a significant support area 144.671.
The underlined horizontal cluster clearly indicates a highly probable bullish movement with target 145.501 level.
P.S
The term oversold refers to a condition where an asset has traded lower in price and has the potential for a price bounce.
Overbought refers to market scenarios where the instrument is traded considerably higher than its fair value. Overvaluation is caused by market sentiments when there is positive news.
Disclosure: I am part of Trade Nation's Influencer program and receive a monthly fee for using their TradingView charts in my analysis.
Like and subscribe and comment my ideas if you enjoy them!

Loong 1Hwe be are bullish in major structure this was a corretion mmove confirmed criterial for long demand tap on the 5min sniper entry

CHECK USDJPY SIGNAL READ CAPTAIN Setup Summary:
Current Price: 144.730
Entry Zone: Around 144.650 (highlighted in purple)
Stop Loss: 144.300 (red zone)
Take Profit Levels:
TP1: Near 145.000
TP2: Around 145.250
Final Target (Last Target): 145.500

USDJPY Analysis: MMC Resistance vs Major BOS (Technical View)🔍 Chart Summary:
The USDJPY pair is currently trading around 144.58, showing strong signs of structural buildup as it approaches a critical inflection point. This analysis leverages MMC (Market Mapping Concept) and price action structure to identify two possible directional outcomes — each grounded in key technical levels.
🧠 Key Technical Highlights:
📌 1. Expanding Wedge Pattern:
Price previously formed an expanding structure, signaling volatility and accumulation.
Expansion typically precedes major directional breakouts — either trend continuation or reversal.
📌 2. Downtrend Break Test:
A long-standing descending trendline has now been tested multiple times.
A confirmed breakout would be significant, indicating a major shift in market momentum.
📌 3. Resistance Zones:
Minor Resistance Zone around 158.00–160.00 marks a key supply area.
Watch for price action behavior if this level is tested — possible rejection or breakout continuation.
📌 4. Major Support Zone:
Support near 139.00–140.00, where price previously bounced, represents a solid floor and demand zone.
📌 5. BOS (Break of Structure):
Two BOS levels are marked:
Minor BOS (Around 146.00): Immediate reaction level to watch.
Major BOS (Around 149.00–150.00): If broken, could lead to sharp bullish continuation.
🔮 MMC Forecast Scenarios:
✅ Condition 1: Bullish Breakout Scenario
Price breaks above the descending trendline and clears the Minor BOS.
Target zone: 158.00–160.00 resistance.
Structure confirms bullish dominance if Major BOS is cleanly broken and retested.
⚠️ Condition 2: Bearish Rejection Scenario
Price rejects from current trendline or Minor BOS and reverses.
Potential drop toward Major Support around 140.00.
Watch for reversal confirmation with bearish engulfing candles or re-entry into expanding zone.
🧭 MMC Outlook Summary:
The chart is setting up for a key decision point. The market will either validate a bullish breakout structure or revert back into bearish continuation. These scenarios align with the MMC mapping method, providing clear conditions for traders to follow without bias.

Price action This usdjpy might be a bit tricky since the liquidity below and a break of structure with the order block but it's bound to push up either way


USDJPY Long then Short: inverse H&SThis is a follow-up to the USDJPY idea that I posted yesterday. I am seeing an inverse H&S setup that is broken as the video is being recorded.

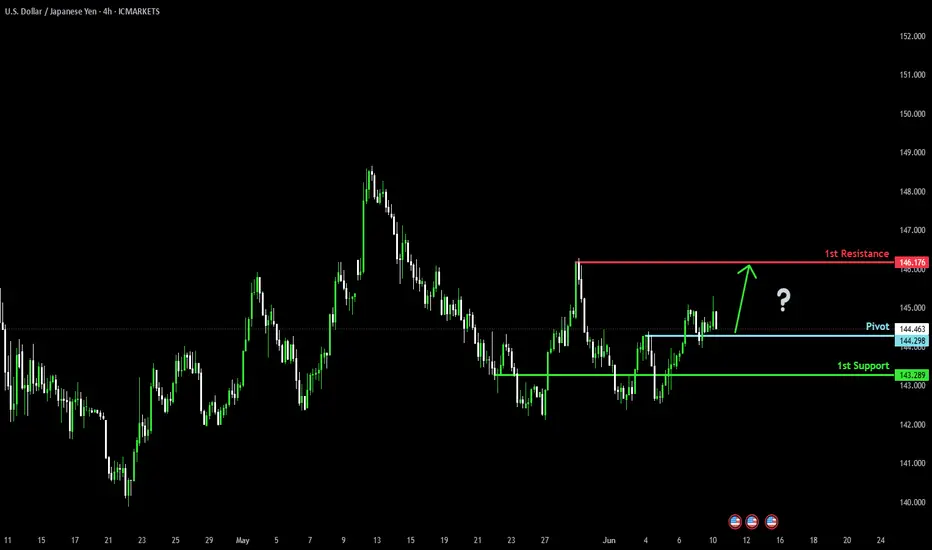
Potential bullish rise?USD/JPY has bounced off the pivot and could rise to the 1st resistance, which acts as a pullback resistance.
Pivot: 144.29
1st Support: 143.28
1st Resistance: 146.17
Risk Warning:
Trading Forex and CFDs carries a high level of risk to your capital and you should only trade with money you can afford to lose. Trading Forex and CFDs may not be suitable for all investors, so please ensure that you fully understand the risks involved and seek independent advice if necessary.
Disclaimer:
The above opinions given constitute general market commentary, and do not constitute the opinion or advice of IC Markets or any form of personal or investment advice.
Any opinions, news, research, analyses, prices, other information, or links to third-party sites contained on this website are provided on an "as-is" basis, are intended only to be informative, is not an advice nor a recommendation, nor research, or a record of our trading prices, or an offer of, or solicitation for a transaction in any financial instrument and thus should not be treated as such. The information provided does not involve any specific investment objectives, financial situation and needs of any specific person who may receive it. Please be aware, that past performance is not a reliable indicator of future performance and/or results. Past Performance or Forward-looking scenarios based upon the reasonable beliefs of the third-party provider are not a guarantee of future performance. Actual results may differ materially from those anticipated in forward-looking or past performance statements. IC Markets makes no representation or warranty and assumes no liability as to the accuracy or completeness of the information provided, nor any loss arising from any investment based on a recommendation, forecast or any information supplied by any third-party.
Complete Market Structure: Order Flow and Multiple TimeframesUnderstanding Market Structure: A Simplified Breakdown
Market structure can seem complex at first glance. But when you break it down piece by piece, it becomes much simpler to understand. At its core, price action is a visual representation of human emotion and logistic balance. It’s both calculated and unpredictable. To truly grasp price action, we must begin by understanding the foundations of the market.
1. Sentiment
In the beginning, there was just a single bar — whether on the 1-minute, 1-hour, 1-day, or 1-week chart. That one bar only had one defining trait: direction. At this early point, there was no trend, no supply or demand zones — only bullish or bearish sentiment. Over time, as more bars formed, sentiment shifted. What was once bullish became bearish, or vice versa. This shift gave rise to a new phenomenon: engulfment .
2. Engulfment
An engulfment occurs when one candle overtakes the previous one, signifying a strong shift in sentiment. When this happened for the first time, it created what we now call an order block around the engulfed candle. The engulfment generated a gap, which led to an imbalance in the market. Naturally, price tends to return to fill this gap to regain balance. Often, price will later engulf back in the original direction, continuing the cycle.
3. Order Flow / Sequence
As more bars appeared, patterns began to form. Series of bullish bars created bullish order flow, and bearish sequences formed bearish order flow. These sequences, when viewed on higher timeframes, appeared as single candles. As these larger candles began to engulf each other, it triggered a new surface-level event: bullish sequences began overtaking bearish ones, and vice versa. This is what I call internal shifting .
4. Internal Shifting
Through internal shifting — where sequences start overtaking each other — the chart begins to display more defined highs and lows. These fluctuations deepen as order flow keeps switching back and forth. Eventually, the structure is no longer just internal. Highs and lows start breaking, and broader, more visible structures form.
5. Highs, Lows, and Breaks of Structure (BoS)
As this cycle continues, the external structure of a timeframe emerges. Highs get higher, then lower, and this alternation continues. The result is a zigzag pattern — the hallmark of market structure. But this structure is not random. It’s the collective output of sentiment shifts, engulfments, sequences, internal shifts, and breaks of structure, all working together to create the full picture.
6. Multi-Timeframe Principles
In simple terms, the external structure of a smaller timeframe is just a more detailed (fractal) version of its higher timeframe. Likewise, the internal structure of a given timeframe is the external structure of its lower timeframe. This creates multiple perspectives of the same phenomena, depending on scale.
7. Same Concepts, Different Scales
What’s called an order block on a higher timeframe may be known as a supply or demand zone on a lower timeframe. An engulfment on a higher timeframe can appear as a sequential engulfment on a lower one. An internal shift on a lower timeframe might just be a pullback when viewed from above. If you go two timeframes apart — say, from low to medium to high — you’ll notice even more complexity. For instance, a higher timeframe order block becomes a premium/discount zone in the lowest of those three timeframes.
8. Low, Medium, and High Timeframes: The Complete Picture
By analyzing the market using three timeframes in unison, you can establish a complete view of market structure. When you truly understand this approach, trading becomes more strategic. Your setups gain better risk-to-reward ratios, and consistent profitability becomes more achievable.
Market structure is both logically and emotionally driven — simple, yet intricate. And while we’ve covered the logical side, the emotional side lies in trading psychology — a topic I’ll be exploring in detail next.
Want to apply this concept using indicators?
I've developed custom indicators that reflect the principles explained above. If you'd like to see how this theory works in practice, check out my TradingView page : The_Forex_Steward , where you can access these tools.

pattern breakoutThe pattern got broken, so look for the correction, then if any bullish candlestick comes can aim for the long position
USDJPY InsightHello to all our subscribers!
Please feel free to share your personal thoughts in the comments. Don’t forget to hit the boost button and subscribe!
Key Points
- The Bank of Japan has decided to maintain its policy of reducing government bond purchases beyond April next year. It is expected to officially announce the extension of its bond-buying plan during the Monetary Policy Meeting scheduled for June 16–17.
- The United States and China concluded the first day of trade talks in London. U.S. Treasury Secretary Scott Besant described the talks as “positive,” while Commerce Secretary Howard Lutnick said they were “productive.”
- According to the New York Federal Reserve, 1-year inflation expectations fell by 0.4% to 3.2% from the previous month. Expectations for 3-year and 5-year inflation also showed signs of easing, further fueling hopes of interest rate cuts.
Key Economic Events This Week
+ June 11: U.S. May Consumer Price Index (CPI)
+ June 12: U.K. April GDP, U.S. May Producer Price Index (PPI)
+ June 13: Germany May Consumer Price Index (CPI)
USDJPY Chart Analysis
The 142 level has consistently provided strong support, and the pair has since climbed to the upper range around 144. However, resistance near the 146 level remains, making it difficult to confirm a full bullish trend. While we may anticipate a potential rise toward the 149 level, we’ll be keeping a close watch on how the price behaves around 146.

usd/jpyi am just uploading this picture because i belive the market has hit a LEVEL of resistance and this is where i belive it to go TRADE 1

Fresh USDJPY Pitch 9/6/2025Updated USDJPY Pitch based on latest movements. Even though the old pitch broke, there were clear indications this would happen. This pitch also includes some basic potential trade markers.

Usdjpy|| — the next move could be explosiveUSD/JPY
Timeframe: 2H
Strategy: Elliott Wave + Triangle Pattern + Fair Value Gap (FvG)
Formation: Contracting Triangle – Wave (a) to (e)
Risk-Reward: High Conviction Setup
Status: On the verge of breakout
🔍 Technical Breakdown:
The chart shows a classic contracting triangle pattern with completed internal waves (a)-(b)-(c)-(d)-(e).
Price is reacting near wave (e), signaling a potential bullish breakout.
A clean Fair Value Gap (FvG) zone lies just below current price — possible last dip before the breakout surge.
Target zone = 148.874, derived from the triangle's height projected from breakout point.
Strong confluence with liquidity hunt below before expansion move.
🎯 Target: 148.874
🛑 Stop Loss: Below 142.738 (SI Level / structural low)
🟢 Entry Trigger: Breakout above trendline + retest confirmation or Smart Money entry at FvG
This setup aligns with Elliott Wave triangle theory, often seen before sharp impulse waves. Smart Money is likely filling orders in the FvG zone before the upward expansion.

USD/JPY holds key support ahead of US dataThe USD/JPY direction has turned somewhat bullish in recent days as improving risk appetite and optimism over US-China trade talks lifted the dollar and pressurized the safe-haven yen.
The pair held firm above key support at 142.50, with sentiment-driven flows favoring the greenback. This week’s focus shifts to key US data releases—CPI on Wednesday and UoM Consumer Sentiment on Friday—which could influence Fed policy expectations and the USD’s trajectory.
A stronger dollar, supported by macro data and fading trade tensions, may push USD/JPY higher, especially as global equities rally and investor confidence improves.
Short-term resistance is seen around the 145.00 handle. The next upside targets are at 146.00, and then 148.00.
All bullish bets would be off, however, should support at 142.50 give way eventually. At the time of writing price was testing interim support around 144.00.
By Fawad Razaqzada, market analyst with FOREX.com
