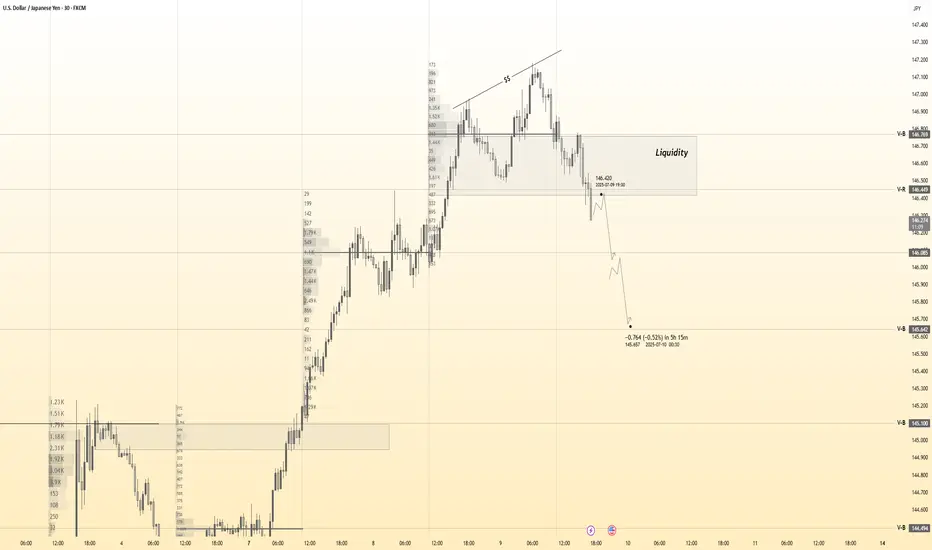
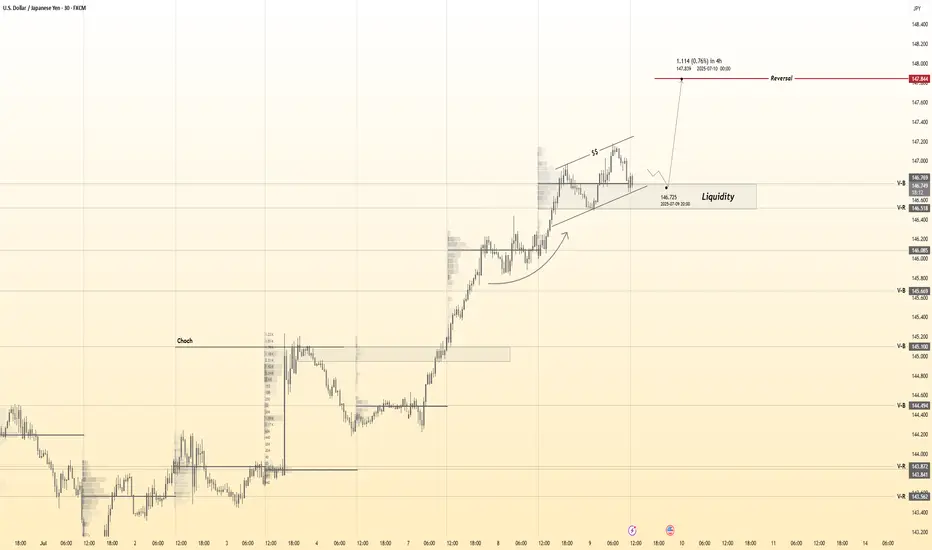
USDJPY 30Min Engaged (Bearish Reversal Entry Detected )➕ Objective: Precision Volume Execution
Time Frame: 30-Minute Warfare
Entry Protocol: Only after volume-verified breakout
🩸 Bearish Reversal From : 146.400
➗ Hanzo Protocol: Volume-Tiered Entry Authority
➕ Zone Activated: Dynamic market pressure detected.
The level isn’t just price — it’s a memory of where they moved size.
Volume is rising beneath the surface — not noise, but preparation.
🔥 Tactical Note:
We wait for the energy signature — when volume betrays intention.
The trap gets set. The weak follow. We execute.
USDJPY_SPT trade ideas
USDJPY 4HR Analysis on a bullish outlookUSDJPY - Short term bullish on DXY - I have my doubts on DXY still being bullish but I do like this scenario.
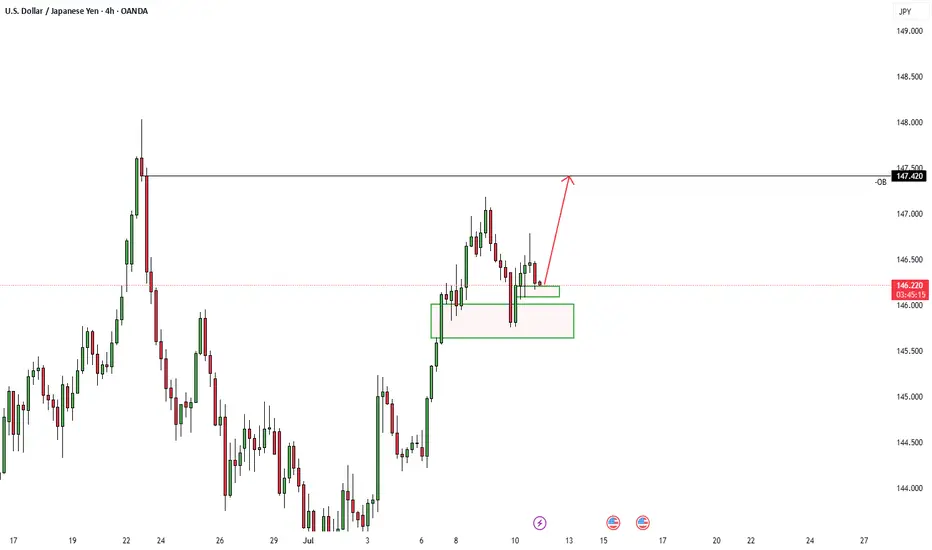
USDJPY Sell Idea Looking to sell between 146.800–147.180, targeting a move down to 145.000 with a stop loss at 147.400 to manage risk. This setup aims to catch a pullback from resistance after the recent rally, expecting the price to drop toward lower support.
As always, watch for bearish confirmation around the entry zone and trade with discipline.
Entry: 146.800 - 147.180
SL: 147.400
TP: 145.000
USDJPY IDEA 08/07/25So we are looking for a Discount Zone with this one. Since we are in a Premium PD Array, we are expecting a short term reversal
USDJPY is currently at 147.724, offering a potential sell opport
major confirmation support is at 145.00 — this is the key level to watch for trend continuation.
As long as price remains below 148.025, the bias remains bearish in the short term.
If the price falls to the 145.00–146.00 zone and shows reversal signs, it could become a buy zone.
Traders may look to take profit near 146.00 initially, and consider adding to positions on a break of 147.00.
The best buy zone lies between 145.00–146.00, ideally after a confirmed bullish reversal pattern appears.
USDJPY is currently at 147.724, offering a potential sell opportunity based on technical resistance.
The immediate resistance level is at 148.025, which can be used as a stop-loss for the short position.
The pair has shown bearish signals near this resistance, suggesting downside momentum.
Initial support is seen at 147.00 — a break below this could confirm further bearish continuation.
The next support level lies at 146.00, where price may pause or consolidate.

USDJPY 30Min Engaged ( Buy & Sell Entrys Detected ) ➕ Objective: Precision Volume Execution
Time Frame: 30-Minute Warfare
Entry Protocol: Only after volume-verified breakout
🩸 Bullish From now Price : 147.350
🩸 Bearish Reversal Price : 147.850
➗ Hanzo Protocol: Volume-Tiered Entry Authority
➕ Zone Activated: Dynamic market pressure detected.
The level isn’t just price — it’s a memory of where they moved size.
Volume is rising beneath the surface — not noise, but preparation.
🔥 Tactical Note:
We wait for the energy signature — when volume betrays intention.
The trap gets set. The weak follow. We execute.

USDJPY IS THE ONLY FALLING h4Price dips below 143.000 support
Attracts breakout sellers
Sharp reversal back toward resistance at 146.500+
Target zone: 147.800 – 149.000

USDJPY M15 Support & Resistance Levels🚀 Here are some key zones I've identified on the 15m timeframe.
These zones are based on real-time data analysis performed by a custom software I personally developed.
The tool is designed to scan the market continuously and highlight potential areas of interest based on price action behavior and volume dynamics.
Your feedback is welcome!

USD/JPY... Long/// 1:1 R:RHello. USD/JPY looks strong on daily time frame. RSI on 4h and 1h very high. GL

Forex Strategy: Long EUR/USD, Long USD/JPY, and Long USD/CHFForex Strategy: Long EUR/USD, Long USD/JPY, and Long USD/CHF
In my Forex strategy, I focus on going long on three key currency pairs: EUR/USD, USD/JPY, and USD/CHF. The core principle of this strategy lies in balancing these positions, with the total units of USD/CHF and USD/JPY equaling the total units of EUR/USD. This approach helps to hedge risks while capitalizing on favorable market conditions for the U.S. dollar.
The rationale behind going long on EUR/USD is based on expected strength in the Euro against the dollar, driven by economic indicators or geopolitical events in the Eurozone. Simultaneously, the USD/JPY long position is placed to benefit from any upward movement in the U.S. dollar against the Japanese yen, often influenced by U.S. interest rate changes or global risk sentiment.
The USD/CHF long position complements the other trades by maintaining a strong U.S. dollar exposure while mitigating potential volatility in other pairs. By ensuring the total units of USD/CHF and USD/JPY match the units in EUR/USD, I aim to maintain a balanced and diversified exposure to the market, minimizing risk while maximizing potential profit.
This strategy is dynamic and continuously adjusted based on market conditions and currency pair correlations.

USDJPY – Tactical Short in Weekly Supply or Bullish Breakout?COT & MACRO FLOW (Commitment of Traders)
USD INDEX
Non-commercials still biased short: Longs 16,208 vs Shorts 20,194 (slightly improved, but still negative).
Commercials remain net long, but the open interest is declining → no strong conviction from smart money.
JPY
Non-commercials added significantly to their short exposure (+6,751), while cutting longs (-4,432).
Commercials also cut long exposure heavily (-20,405).
The structure shows institutional bias is clearly bearish on JPY.
Conclusion: JPY weakness confirmed by both commercial and non-commercial flows. USD slightly weaker, but JPY is weaker → supports USDJPY bullish bias.
SEASONALITY (JULY)
USD/JPY tends to be weak in July across most historical averages (5y, 10y, 15y, 20y).
July is historically bearish for USDJPY, especially in the second half of the month.
This seasonality contrasts with COT flows → mixed bias.
RETAIL SENTIMENT
60% of retail traders are SHORT → supports contrarian long view.
Retail volume shows imbalance in positioning, another contrarian bullish signal.
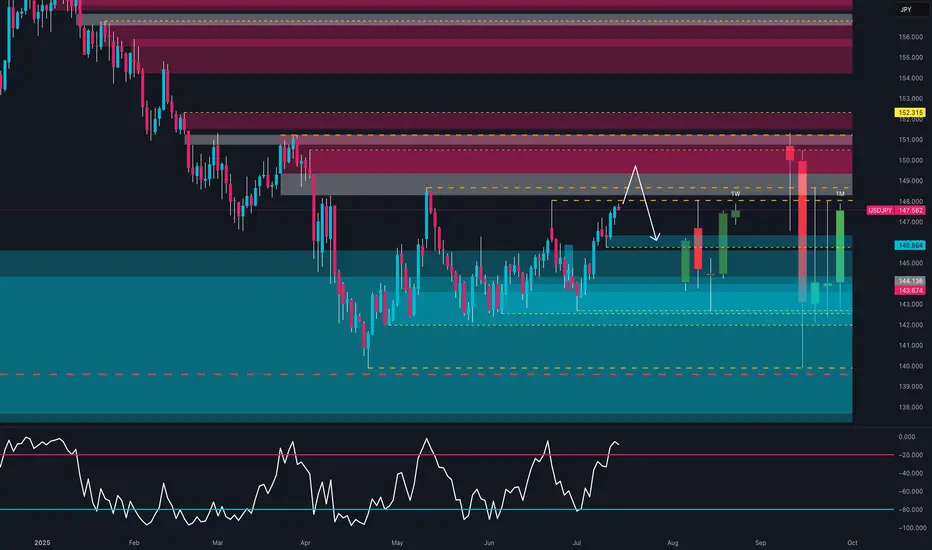
📈 TECHNICAL ANALYSIS (DAILY CHART)
Price is testing a key weekly FVG zone between 148.4 and 149.2.
RSI has re-entered the overbought region, suggesting potential exhaustion.
Price bounced from the monthly bullish order block (143.5–144.0).
A clear move above 149.50 could invalidate short setups.
🧩 TRADE IDEA (SETUP)
Watch for price to retest 148.4–149.50 zone and react.
RSI divergence + seasonality could offer a short opportunity with confirmation (e.g. engulfing on Daily/H4).
If price breaks above 149.5 with volume → look for continuation to 152.00.
✅ FINAL BIAS
Macro and institutional flows remain in favor of USDJPY longs, but:
Seasonality turns bearish in the second half of July
Price is reaching strong resistance
Retail sentiment supports the long thesis
→ Tactical Short from 149-150 only with confirmation. Otherwise, long continuation above 150.
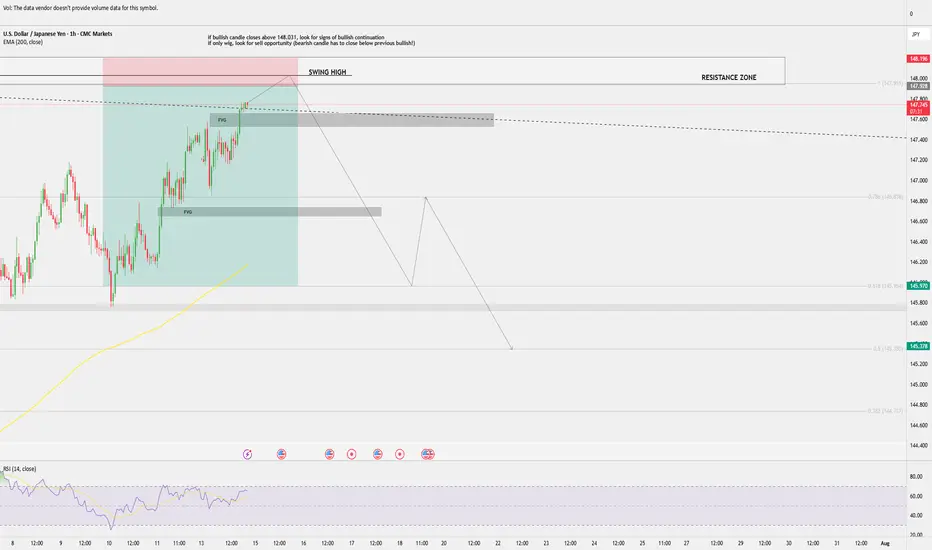
USD/JPY sell opportunity approaching?USD/JPY is approaching previous swing high and resistance zone.
Bullish closure above the swing high (148.031) could indicate further push up.
Failure to close above swing high (bullish candle tapping into it, but only with the wig) and second bearish candle closing below the previous bullish opens sell opportunity.
SELL IDEA
entry: 147.928
SL: 148.196
TP: 145.970 (around 0.618 Fib retracement)
Potential second TP at 145.378 (0.5 Fib retracement).
PLEASE NOTE THIS IS ONLY AN IDEA
I am not a professional trader, but learning to analyse and looking to share ideas and get feedback.

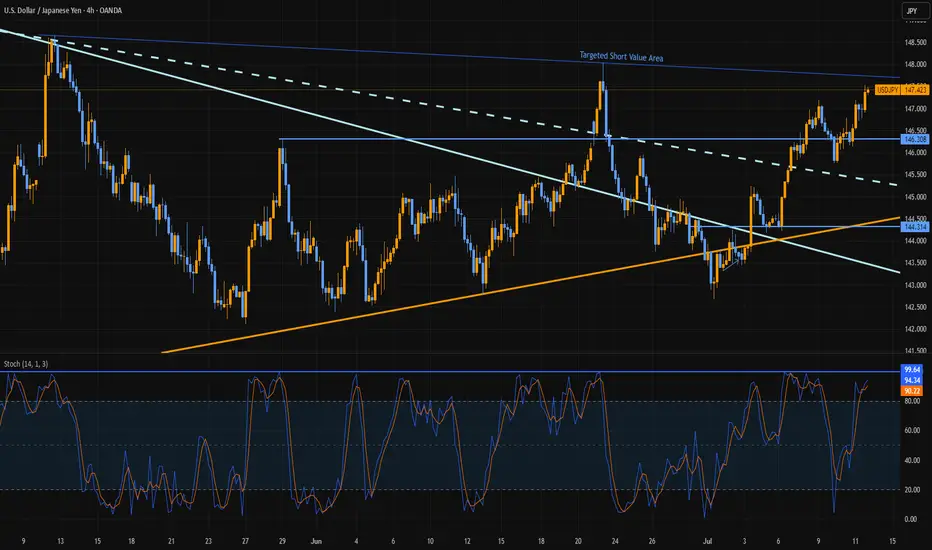
An Emerging ceiling in play for USDJPYCurrent levels are approaching to a multiple potential, and one very big, resistance area. Also move stochastic over these levels are rare. Closing over 147.50 on weekly is not seen since before April moves. But not discounting possibility of this move going over 148.00.
I'm operating with value areas above 147.80 for a short. Stops are well above 149.20. Targeting a pull back 142.80 area.
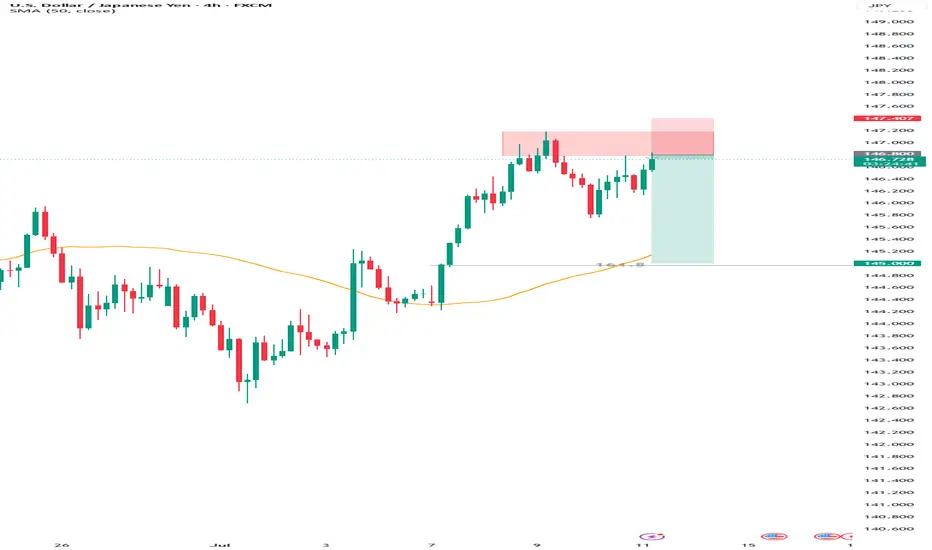
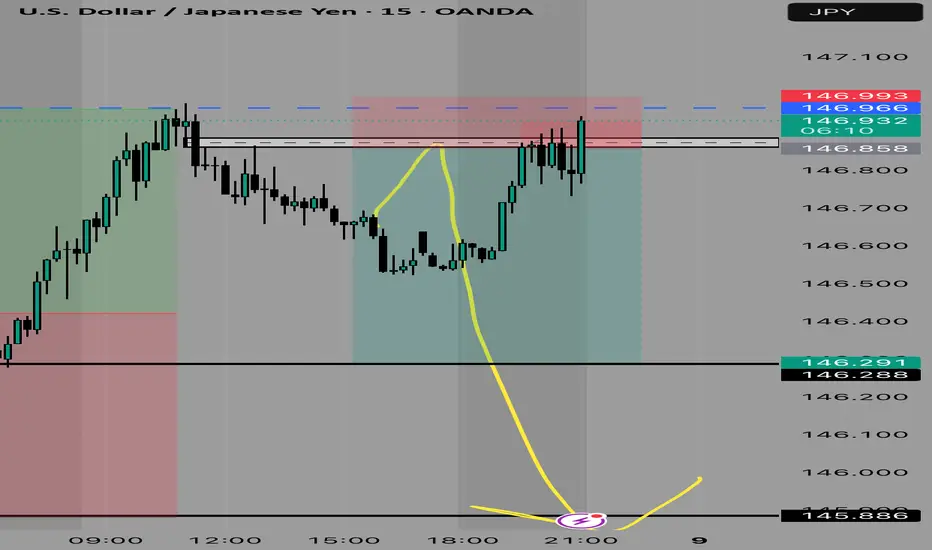
USDJPY Short Setup – Supply Zone Reaction After Structure Break After a clear break of structure (BOS) to the downside around the 145.92 level, USDJPY entered a retracement phase and is now retesting the supply zone created by the last bearish move. This area overlaps with the previous support turned resistance, as well as the dynamic resistance of the moving average, which strengthens the confluence.
We also had a Change of Character (CHOCH) earlier in the structure, marking a shift in momentum from bullish to bearish. The current price action has formed a lower high beneath the supply zone, suggesting that sellers are likely to defend this area.
I'm now watching for rejection signs from this 146.25–146.35 zone, which could confirm the bearish continuation. If price fails to break above this supply and shows weakness (e.g., bearish engulfing or long-wick rejections), I’ll look for entry opportunities to short.
Target:
The first short-term target is a move back to the BOS level at 145.92
A break below that could open the path to 144.09, the next significant support and previous demand zone
Summary:
This setup is based on classic smart money concepts: BOS, supply zone reaction, and a structural lower high. I’ll remain bearish unless the supply is broken cleanly with strong bullish momentum.

USD/JPY: Still a Safe-Haven Tug of WarUSD/JPY had surged past 147 on the back of Trump’s tariff letter to Japan—but quickly pulled back as risk appetite stabilized and Treasury yields softened. Price action now sits around the low-146s.
Technically, the 100-day SMA is providing key support just below 146.00. If bulls hold this level, we could see another push toward 147.20–148.00. On the downside, any surprise from upcoming Fed speakers or Japanese trade negotiations could send the pair testing the 144.00 zone again. Traders are watching Osaka closely, U.S. Treasury Secretary Scott Bessent is expected to meet Japanese officials at the World Expo, which could shape sentiment fast.

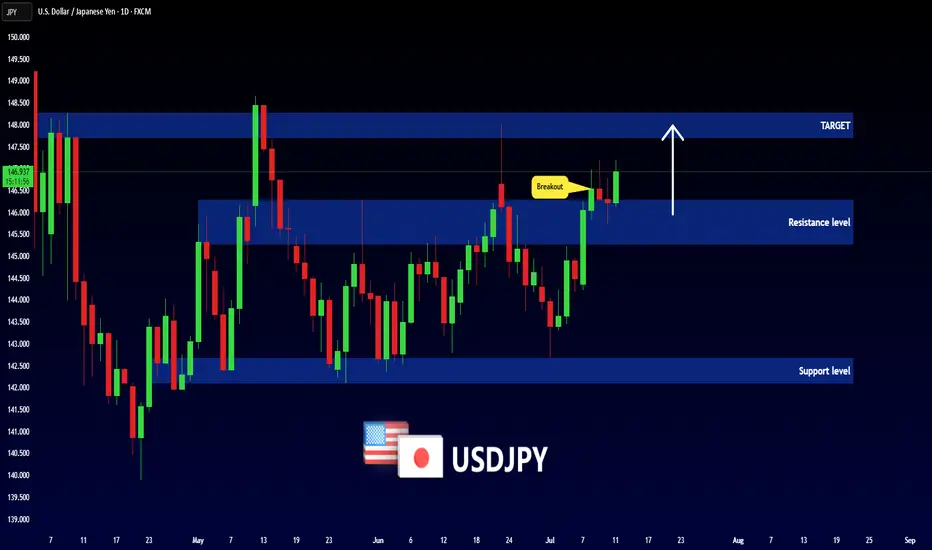
USDJPY - NEW BREAKOUT !Hello Traders !
After a huge bullish move,
The USDJPY broke the resistance level (146.285 - 145.280).
This key level becomes new support!
So, I expect a new bullish move🚀
_______________
TARGET: 147.700🎯
USDJPY - Trade The Range!Hello TradingView Family / Fellow Traders. This is Richard, also known as theSignalyst.
📈USDJPY has been trading within a range between $140 and $150 round numbers and it is currently retesting the upper bound of the range.
📚 As per my trading style:
As #USDJPY is around the red circle zone, I will be looking for bearish reversal setups (like a double top pattern, trendline break , and so on...)
📚 Always follow your trading plan regarding entry, risk management, and trade management.
Good luck!
All Strategies Are Good; If Managed Properly!
~Rich
Disclosure: I am part of Trade Nation's Influencer program and receive a monthly fee for using their TradingView charts in my analysis.

XABCD Double Top
Hello traders! I hope you’ve had a productive trading week.
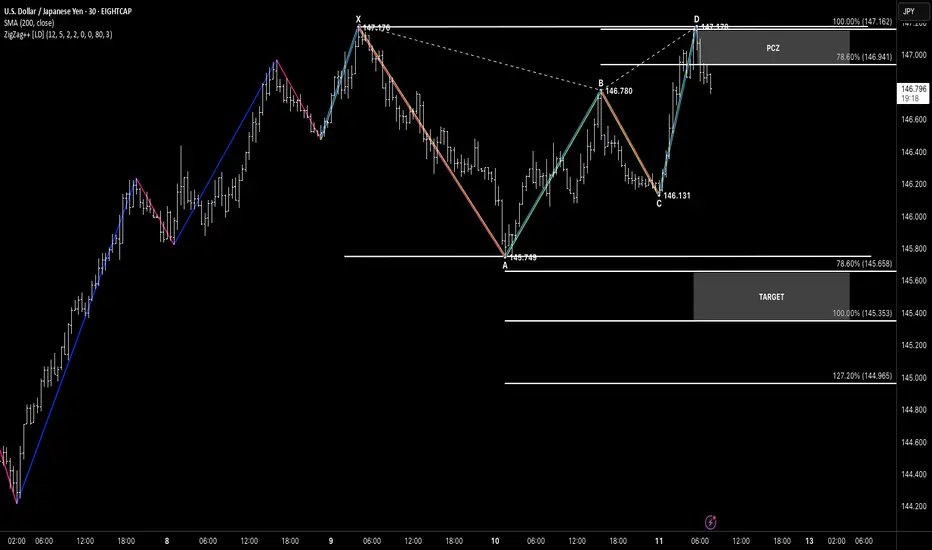
Let’s take a look at USDJPY, where we’re wrapping up the week with a textbook XABCD Double Top formation.
📍 Structure Overview
Price action completed an extended XABCD formation, with D printing a perfect double top around the 147.17 level.
The move from C to D aligns closely with the prior XA leg, showing strong symmetry in price.
D terminates precisely within the PCZ (Potential Completion Zone), aligning with both 78.6% and 100% extensions.
🎯 Bearish Targets Below
If this Double Top confirms with bearish follow-through, the structure offers a clean setup with downside targets:
Target 1: 145.35 (100%)
Target 2: 144.96 (127.2%)
A break below point C (146.13) would further validate the bearish thesis.
🧠 Pattern Highlights
XABCD geometry
Strong price symmetry
Completion into previous high (resistance)
Clear target zone for risk-defined trades

USD/JPY - continue with the UptrendOn USD/JPY , it's nice to see a strong buying reaction at the price of 143.860.
There's a significant accumulation of contracts in this area, indicating strong buyer interest. I believe that buyers who entered at this level will defend their long positions. If the price returns to this area, strong buyers will likely push the market up again.
(FVG) - Fair Value GAP and high volume cluster are the main reasons for my decision to go long on this trade.
Happy trading
Dale

USDJPY 30Min Engaged ( Bullish Entry Detected )➕ Objective: Precision Volume Execution
Time Frame: 30-Minute Warfare
Entry Protocol: Only after volume-verified breakout
🩸 Bullish From now Price : 146.750
➗ Hanzo Protocol: Volume-Tiered Entry Authority
➕ Zone Activated: Dynamic market pressure detected.
The level isn’t just price — it’s a memory of where they moved size.
Volume is rising beneath the surface — not noise, but preparation.
🔥 Tactical Note:
We wait for the energy signature — when volume betrays intention.
The trap gets set. The weak follow. We execute.
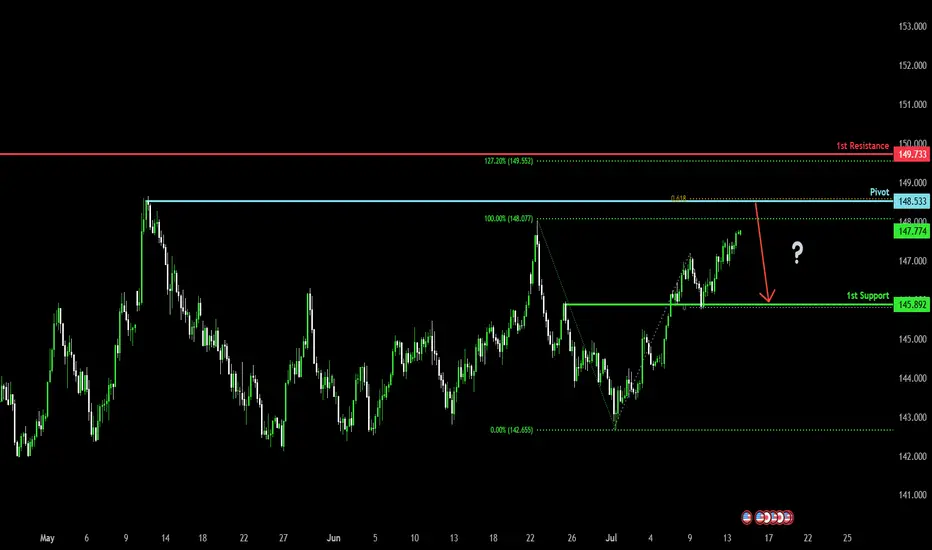
Could the price reverse from here?USD/JPY is rising towards the pivot which is a swing high resistance and could reverse to the 1st support which acts as an overlap support.
Pivot: 148.53
1st Support: 145.89
1st Resistance: 149.73
Risk Warning:
Trading Forex and CFDs carries a high level of risk to your capital and you should only trade with money you can afford to lose. Trading Forex and CFDs may not be suitable for all investors, so please ensure that you fully understand the risks involved and seek independent advice if necessary.
Disclaimer:
The above opinions given constitute general market commentary, and do not constitute the opinion or advice of IC Markets or any form of personal or investment advice.
Any opinions, news, research, analyses, prices, other information, or links to third-party sites contained on this website are provided on an "as-is" basis, are intended only to be informative, is not an advice nor a recommendation, nor research, or a record of our trading prices, or an offer of, or solicitation for a transaction in any financial instrument and thus should not be treated as such. The information provided does not involve any specific investment objectives, financial situation and needs of any specific person who may receive it. Please be aware, that past performance is not a reliable indicator of future performance and/or results. Past Performance or Forward-looking scenarios based upon the reasonable beliefs of the third-party provider are not a guarantee of future performance. Actual results may differ materially from those anticipated in forward-looking or past performance statements. IC Markets makes no representation or warranty and assumes no liability as to the accuracy or completeness of the information provided, nor any loss arising from any investment based on a recommendation, forecast or any information supplied by any third-party.