USDJPY: Weekly OverviewHello traders,
Generally, I think USD tends to be weaker in next weeks
Why 142.879 is a white (No-Trade) zone?
140.729 is a strong reversal point regarding the Weekly timeframe.
Any short trade here is not rational.
It is not suitable for long, because of the bearish trend line.
Other zones are clear!
**********************************************************
The indicated levels are determined based on the most reaction points and the assumption of approximately equal distance between the zones.
Some of these points can also be confirmed by the mathematical intervals of Murray.
You can enter with/without confirmation. IF you want to take confirmation you can use LTF analysis, Spike move confirmation, Trend Strength confirmation and ETC.
SL could be placed below the zone or regarding the LTF swings.
TP is the next zone or the nearest moving S&R, which are median and borders of the drawn channels.
*******************************************************************
Role of different zones:
GREEN: Just long trades allowed on them.
RED: Just Short trades allowed on them.
BLUE: both long and short trades allowed on them.
WHITE: No trades allowed on them! just use them as TP points
USDJPY_SPT trade ideas

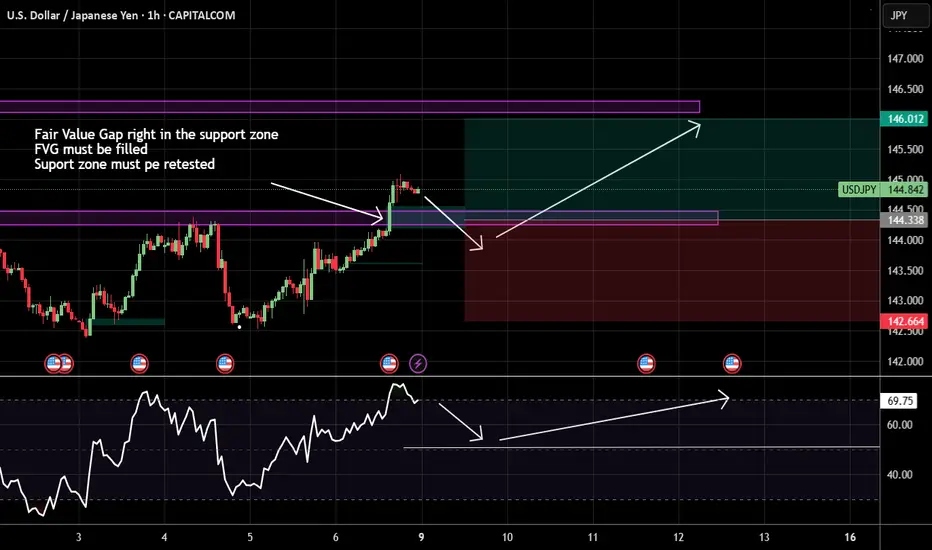
Bullish bounce off pullback support?USD/JPY is falling towards the support level which is a pullback support that os slightly above the 23.6% Fibonacci retracement and could bounce from this level to our take profit.
Entry: 144.27
Why we like it:
There is a pullback support level that is slightly above the 23.6% Fibonacci retracement.
Stop loss: 143.36
Why we like it:
There is an overlap support level that is slightly below the 61.8% Fibonacci retracement.
Take profit: 146.07
Why we like it:
There is a pullback resistance level.
Enjoying your TradingView experience? Review us!
Please be advised that the information presented on TradingView is provided to Vantage (‘Vantage Global Limited’, ‘we’) by a third-party provider (‘Everest Fortune Group’). Please be reminded that you are solely responsible for the trading decisions on your account. There is a very high degree of risk involved in trading. Any information and/or content is intended entirely for research, educational and informational purposes only and does not constitute investment or consultation advice or investment strategy. The information is not tailored to the investment needs of any specific person and therefore does not involve a consideration of any of the investment objectives, financial situation or needs of any viewer that may receive it. Kindly also note that past performance is not a reliable indicator of future results. Actual results may differ materially from those anticipated in forward-looking or past performance statements. We assume no liability as to the accuracy or completeness of any of the information and/or content provided herein and the Company cannot be held responsible for any omission, mistake nor for any loss or damage including without limitation to any loss of profit which may arise from reliance on any information supplied by Everest Fortune Group.

USDJPYPotential swing trade incoming ( Short )
- creating LLs and LHs
- Hitting daily supply line
- 3rd touch off the downwards trendline
- high wick candles on the lower time frames - sellers are stepping in
- SL just above previouse LH
- TP at major demand zone
- overall downwards trend within the market
boost and comment away guys i want to here your take on this trade

The Japanese yen may face further downward pressure.The USD/JPY has trended higher in a volatile manner this week, rising 0.56% on a weekly basis and closing at 144.87 on Friday, marking the second consecutive week of gains. The Japanese yen, as a safe-haven currency, showed weakness this week, reflecting market concerns about Japan's economic outlook and the impact of Trump's tariff policies. The remarks of Kazuo Ueda (Governor of the Bank of Japan) reflected worries about the effects of the trade war. Market expectations indicate that the Bank of Japan is likely to maintain a dovish stance in the short term. If next week's GDP data is weak, the yen may face further downward pressure.
Humans need to breathe, and perfect trading is like breathing—maintaining flexibility without needing to trade every market swing. The secret to profitable trading lies in implementing simple rules: repeating simple tasks consistently and enforcing them strictly over the long term.

USDJPY Is Very Bullish! Buy!
Please, check our technical outlook for USDJPY.
Time Frame: 4h
Current Trend: Bullish
Sentiment: Oversold (based on 7-period RSI)
Forecast: Bullish
The price is testing a key support 144.863.
Current market trend & oversold RSI makes me think that buyers will push the price. I will anticipate a bullish movement at least to 146.013 level.
P.S
The term oversold refers to a condition where an asset has traded lower in price and has the potential for a price bounce.
Overbought refers to market scenarios where the instrument is traded considerably higher than its fair value. Overvaluation is caused by market sentiments when there is positive news.
Disclosure: I am part of Trade Nation's Influencer program and receive a monthly fee for using their TradingView charts in my analysis.
Like and subscribe and comment my ideas if you enjoy them!

Week 23 Hello traders,
Stunning pairs on watch! Diversified as well;
OANDA:DE30EUR
FX:USDJPY
FX:AUDJPY
FX:CHFJPY
FX:EURGBP
FX:USOIL
FX:GBPAUD
CRYPTO:ETHUSD
FX:CADCHF
FX:NZDCHF
CRYPTOCAP:TOTAL2

USDJPY TRADING ROADMAP 09 - 13 JUNI 2025📈 USDJPY TRADING ROADMAP
Trading Plan & Market Outlook
The USDJPY pair is currently in a bullish phase and is expected to continue rising toward the Supply Zone between 146.765 – 147.664, as long as price action holds above the key Demand Zone at 142.273 – 141.426.
🔹 Trading Plan:
Primary Trend: Bullish (price heading to supply zone)
Demand Zone (Support): 142.273 – 141.426
→ This zone acts as the trend validation and risk threshold
Supply Zone (Resistance): 146.765 – 147.664
→ Potential target zone for bullish continuation
Risk Management:
As long as price stays above 141.426, the bullish outlook remains valid.
A break below this level may signal a shift in market direction.
📌 Key Notes:
Wait for price action confirmation near zones before taking entry.
Use proper position sizing and risk-reward ratios.
⚠️ DISCLAIMER ON
This content is for educational purposes only and does not constitute financial advice.
Trading involves substantial risk and may not be suitable for all investors.
Always do your own research and use appropriate risk management.

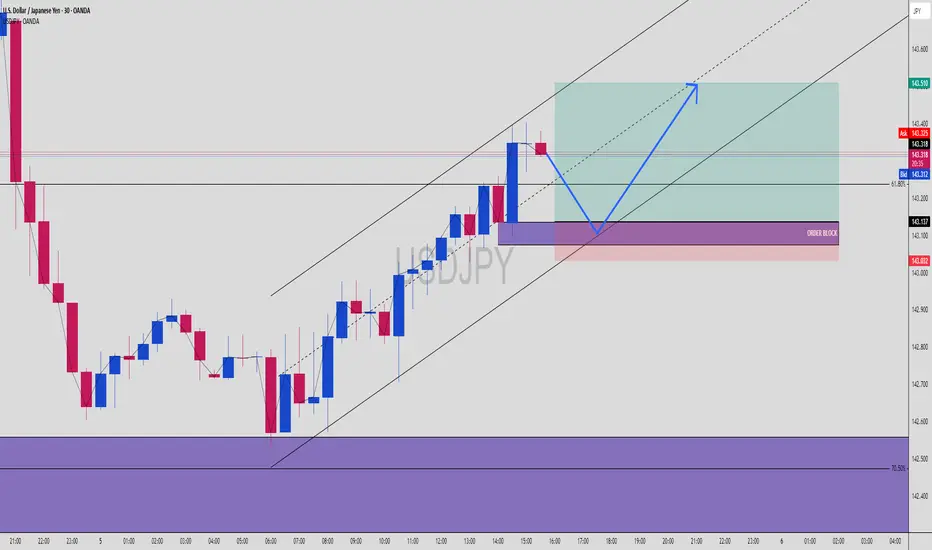
USDJPY Pullback? Watch OB + Fib Confluence for the Next Buy WaveUSDJPY | 30-Min Chart – Smart Money Buy Setup in Progress
After a sharp bullish rally, USDJPY is setting up for a classic retracement buy scenario. We're now watching a key confluence zone between Fibonacci levels, a bullish order block, and internal trend structure — all lining up for a high-probability long setup.
🔍 Trade Breakdown:
📉 Pullback Expected Before Next Rally:
Price rejected near short-term resistance and is retracing from local highs.
Retracement aligns with key OB + 61.8–79% Fib zone = institutional entry zone.
🟣 Order Block (OB) Demand Zone: 143.086 – 142.828
Last bullish candle before explosive rally = demand OB.
OB sits within premium Fib retracement = Smart Money buy zone.
📐 Fibonacci Levels (Swing Low to High):
61.8% ≈ 143.200
70.5% ≈ 143.000
79% ≈ 142.828
This is the kill zone for institutional longs — where Smart Money typically enters before expansion.
🔵 Projected Play:
Retracement to OB/Fib confluence.
Bullish rejection from OB zone.
Impulse move targeting previous highs and beyond.
💡 Target Level: 144.396 (sits just above prior high and aligns with -27% Fib extension)
📉 Current Bias:
Short-term retracement ➝ Mid-term bullish continuation
Expecting price to dip into OB then launch.
🧠 Chart Ninja Entry Plan:
🔹 Entry Zone: 143.086 – 142.828
🔻 SL Below: 142.650 (below OB/Fib + structure wick)
📈 Target: 144.396
⚖️ RRR: 1:3+ — high confluence risk-managed buy
🔍 Technical Confluence Checklist:
✅ OB demand zone
✅ 61.8–79% retracement
✅ Bullish market structure
✅ Internal channel support
✅ Momentum slow before entry
📍 Save this chart — don’t chase, let price come to you
💬 Comment if you're watching this OB too
👣 Follow @ChartNinjas88 for precision-based setups daily

USDJPY Buy Setup! OB + 61.8% Fib + Trend Channel ConfluenceUSDJPY | 30-Min Chart – High Probability Buy Setup in Progress
USDJPY is currently respecting a bullish market structure within a well-defined ascending trend channel. Smart Money Concepts (SMC) traders are watching for a precise reaction at the confluence of a key Order Block (OB), Fibonacci retracement levels, and mid-channel support.
🔍 Trade Breakdown:
Bullish Market Structure
Price has shifted from bearish to bullish after forming a key higher low and continuing with higher highs within the trend channel. The structure is being respected with multiple taps on both upper and lower channel boundaries.
Internal Liquidity & Order Flow:
Price previously swept sell-side liquidity below the recent swing low and sharply reversed, confirming internal liquidity engineering and institutional involvement.
Currently, we’re seeing price stall after rejecting the upper channel and OB zone. A retracement into the discount zone is anticipated before continuation.
🟣 Order Block Zone (OB): 143.032 – 143.137
A clear bullish OB formed after a strong impulsive move, marking the last down candle before the bullish break of structure.
Located just above the 61.8% Fibonacci level — strong confluence.
📐 Fibonacci Levels from Last Swing Low to High:
61.8% = 143.137
70.5% = 143.032
Potential reaction zone aligns perfectly with OB + trendline + psychological round level (143.000 area)
📊 Buy Setup Expectation:
USDJPY is expected to retrace into the OB/Fib confluence zone before a bullish continuation toward the upper boundary of the trend channel and beyond.
🔵 Projected Path:
Price dips into OB → reacts to 61.8–70.5% retracement → bullish reversal → break to fresh highs near 143.510 or higher
🧠 Chart Ninja Entry Plan:
🔹 Entry Zone: 143.032 – 143.137 (OB + 61.8–70.5% Fib)
🔻 SL Below: 143.000 (beneath OB and psychological level)
📈 Target: 143.510 (channel top + previous supply zone)
⚖️ RRR: Approx. 1:3+ — high precision Smart Money entry
💬 Ninja Wisdom:
Patience before profit. Wait for price to return to the zone where institutions left footprints — the OB at equilibrium pricing. Combine OB + Fib + channel and you're trading like the banks.
Retail buys the breakout. Smart Money buys the pullback. 🥷📚
📍 Save this chart before the setup triggers!
🧠 Do you see the same confluence? Comment your entry/TP/SL plans ⬇️
👣 Follow @ChartNinjas88 for more sniper setups on major FX pairs every session!
USDJPYUSDJPY jpy is dropping dxy looking to catch some liquidity plus good news for usd this week coming up i will keep my buy position probably see a pullback for liquidity to then continue with the bullish trend.

USD/JPYthis pair is on a bullish on a weekly to monthly time frame bearish on a daily
so it could go either way im looking for the price right now to hit a ristence like it already has to push down from the 144.859 to 143.999 to either retrace bullish as i do believe overal the market is bullish
HOWEVER
SHOULD The price go even more bearish to break past the 143.999 to furthur hit a major surport line 142.581 i would be waiting for a a big bullish move to head back towards the 144.000 mark i would set a risk to reward at 1:2 again and see where the market takes us

Week 23 USDJPY technical analysis 07062025On the daily time frame, I see price turn from 139.992 which I call support and resistance is 161.593. Market refused to travel up to this price level, making a stop at 158.498 which I can call my new resistance or supply zone. My immediate supply zone or the nearest bus stop price may turn is 148.162. Last week $:USDJPY was pulled back to 142.5 before resuming bullishness hitting the high of the week at 145.
Three scenarios are expected. Using Elliot wave, I can expect the price to do one of the following
Continue its bullish move to the next supply zone of 146.25
Pull back to at least 143.75 using Fibonacci. If dealers break above 145, pull back needs to be recalculated.
Hold price levels at 145 before playing scenario 1 or 2
Is UJ bullish? yes overall.
How to trade the pair? Wait for the pullback before buying. I am betting price may pullback to 143. If it does, I am ready to ride the baby up to 146 (300 pips baby)
If it doesn't pull back, buy stop from 145.1 - 146, stop loss 144.75
If you love my analysis, give it a boost to help others. If you disagree with my analysis, let me know what you think.
Disclaimer: Not a trading advice, educational purposes only.

USD/JPY SHORTI’ve been seeing an accumulation of shorts in the dollar suggesting more weakness in the weeks/months ahead . Also many rejections at certain price levels etc.

USDJPY SLIGHTLY REACTS AT THE SUPPORT! WHAT NEXT?Price reacted at the support by ticking higher right after the NFP report came out "better than expected" last week. could this be a good opportunity to sell USDJPY OR we're likely to see it continue to grow in strength? we'll monitor price next week to get a better idea of how price is going to react

Potential Buy Opportunity on USDJPYReasons I think this pair will rise:
- Price printed a higher low
- Confirmed trend line means harder potential breakout
- RSI was oversold
What do you think?

usdjpy longThe Japanese Yen attracts sellers for the second straight day in reaction to disappointing domestic data. The optimism over the resumption of US-China trade talks further undermines demand for the safe-haven JPY. The divergent BoJ-Fed expectations should limit JPY losses and cap USD/JPY ahead of the US NFP report.

USDJPY: Bullish Outlook For Next Week Explained 🇺🇸🇯🇵
USDJPY completed a consolidation, violating
a resistance line of a horizontal range on a 4H time frame.
I believe that it provides a strong bullish confirmation signal.
The price will most likely go up and reach 146.0 level next week.
❤️Please, support my work with like, thank you!❤️
I am part of Trade Nation's Influencer program and receive a monthly fee for using their TradingView charts in my analysis.

Buying opportunity for next week, USDJPY H1If the price stays above 144.30 and forms H1 candles with higher lows, it may continue towards 145.60–146.00 (upper zone).
RSI still supports the bullish direction (momentum has not been broken).
What do you think?
USD/JPY - early markupstructure, structure, structure
divergence indicates a change in trend, major structure broken , waiting for more data to enter long

USDJPY Short Outlook Interesting to see if USDJPY drops below the lows market at and below the orange line below. Buys are likely to have stops there cause an run on liquidity if prices drop lower. I would expect a fast or aggressive trade lower.
Disclosure: This is only a technical analysis with limited details provided. This view also does not consider any fundamental / economic drivers.
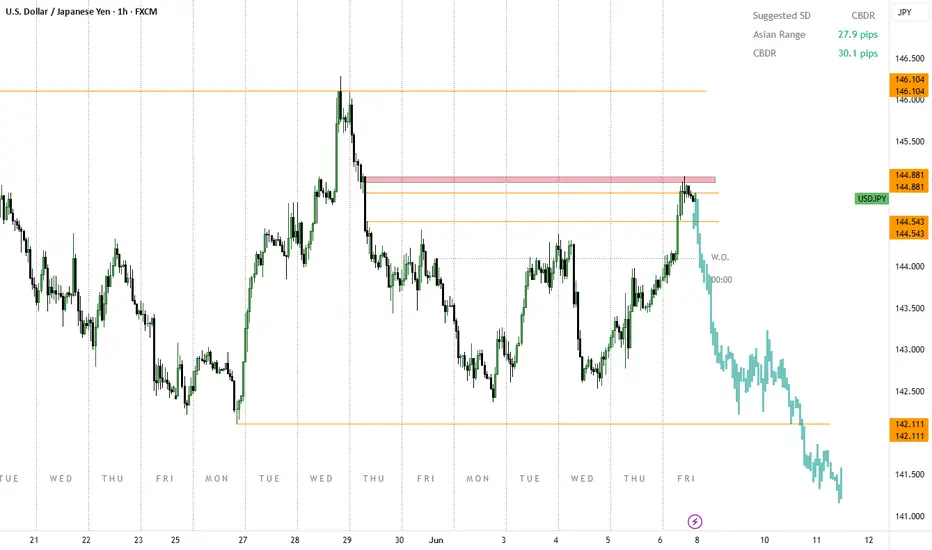
USD/JPY Higher-Low, 142.50 DefenseUSD/JPY continues to exert force on the USD and the past week was no different. Despite an open door for sellers, a higher-low showed with a hold of the same 142.50 support level that was in-play a week prior. That price traded early on Tuesday (Monday night in the states) and then on Thursday (Wed night in the U.S.) buyers came in to hold the low just above that price, illustrating a degree of bullish anticipation.
Reports of slowing pace of bond tapering from the BoJ, and perhaps even smaller reductions to the banks bond buying helped to soften long-term Japanese yields: 40 year JGBs made a move towards the 3% marker after skyrocketing up to 3.7% just a few weeks ago. That helped JPY-weakness to continue against the USD and USD/JPY is back to re-testing the 145.00 handle in the pair.
This remains a key component if a USD turn is nearby, but interestingly working with that turn may be more attractive against the Euro in a pair like EUR/USD as USD/JPY has continued to show traps on both sides of the market for much of 2025 trade. - js

Long Change of character confirmed?after several bounces at the weekly resistanze area we see a break of structure to the upside aided by high impact news today. we should expect an uptrend this week

USD/JPY - Triangle Breakout (06.06.2025)The USD/JPY pair on the M30 timeframe presents a Potential Buying Opportunity due to a recent Formation of a Triangle Pattern. This suggests a shift in momentum towards the upside and a higher likelihood of further advances in the coming hours.
Possible Long Trade:
Entry: Consider Entering A Long Position around Trendline Of The Pattern.
Target Levels:
1st Resistance – 144.94
2nd Resistance – 145.52
🎁 Please hit the like button and
🎁 Leave a comment to support for My Post !
Your likes and comments are incredibly motivating and will encourage me to share more analysis with you.
Best Regards, KABHI_TA_TRADING
Thank you.
Disclosure: I am part of Trade Nation's Influencer program and receive a monthly fee for using their TradingView charts in my analysis.
