USDJPY Forecast for NFP Week | Price at a Critical Turning PointIn this video, I’m diving into the USDJPY setup ahead of a high-impact week filled with major economic news like the NFP, ADP Employment, and speeches from the BoJ Governor.
We’ll walk through the technical zones I’m watching, discuss potential buyer and seller reactions, and outline the key catalysts that could move the market.
🔔 Don’t forget to like the video in support of my work.
Disclaimer:
Based on experience and what I see on the charts, this is my take. It’s not financial advice—always do your research and consult a licensed advisor before trading.
#USDJPY #ForexForecast #NFPWeek #ForexMentor #TechnicalAnalysis #ForexTrading #BoJ #TradeSetups #PriceAction #MarketBreakdown
USDJPY_SPT trade ideas

USDJPY Short: On the Wave 3 Train RideOver in this video, I go through in detail the breakdown of the Elliott Waves and the rationale for counting the waves as I did. In this video, i talk about setting the stop at around 144.10 and the short-term take profit target at around 139.92.
At the end, I remind us of the big picture head-and-shoulders where the longer-term target is around 127.21.
Thank you and Good Luck in your Trading!

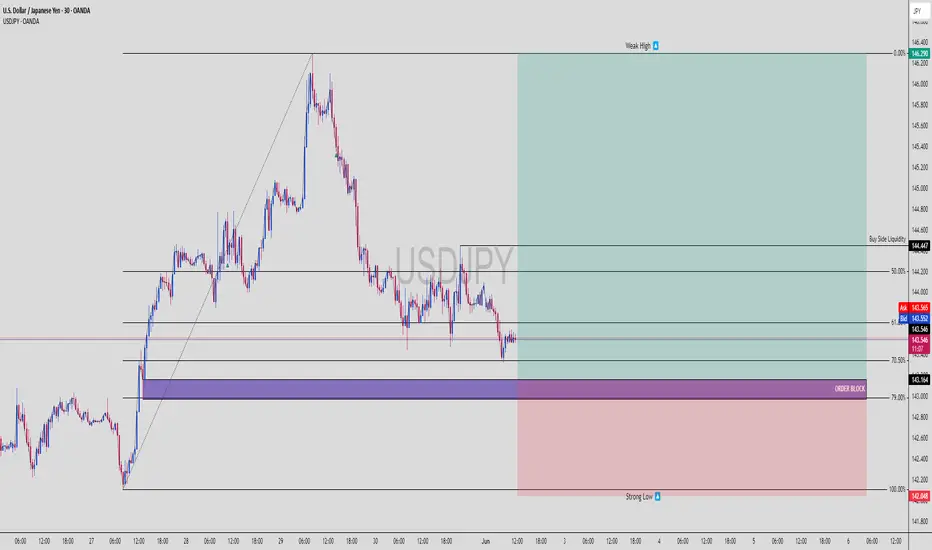
USDJPY Ready to Bounce – Sniper Long from Smart Money OBUSDJPY | 30-Min Bullish Setup – Premium to Discount + Order Block Reaction
USDJPY looks primed for a bullish reversal from a smart money perspective. Let’s walk through why this setup could be the cleanest long of the week 📈🧠
📌 1. Current Market Narrative:
Price retraced deep into discount levels (beyond 70.5%) after a strong bullish leg
Tapped into a refined bullish Order Block (OB) sitting just above a strong low
Multiple liquidity grabs have already occurred, leaving internal structure vulnerable to a reversal
Smart money has likely accumulated below recent lows… ready to pump toward Buy Side Liquidity 🧲
🧠 2. Key Technical Levels:
✅ Order Block Zone (Entry): 143.164
🔻 Strong Low: 142.048 (protected)
🟢 Buy Side Liquidity Target: 144.447
🔼 Weak High (Magnet): 146.290
Entry Point: Within OB (143.1–143.2)
TP Zones: 144.447 (main), 146.290 (stretch target)
SL: Below OB – around 142.048
RR: ~1:4+ — sniper grade 🥷
📊 3. Smart Money Flow:
OB aligned with 70.5–79% Fibonacci discount zone (deep retrace = strong reaction)
Structure shows signs of exhaustion on the sell side
Price may now reverse with displacement toward upside inefficiencies
Buyers likely stepping in aggressively from this level
🚀 4. Execution Plan (LTF Confirmation Entry):
✅ Wait for:
M5–M15 BOS (bullish break of structure)
FVG or mitigation entry confirmation
Maintain tight SL below OB (2–3 pips buffer)
Bonus: If price holds above 143.2 with strong M5 bullish candle close, that’s go-time for smart money longs.
🧨 5. Why This Setup is 🔥:
High probability bounce zone (OB + deep fib retrace)
Clean RR structure with solid target at buy side liquidity
Market structure shift likely as lower highs start breaking
Liquidity swept under recent lows = trap complete
This is the kind of setup that institutional algos are coded to exploit 🤖
💬 Type “USDJPY Long Sniper 🥷💴” in the comments if you’re in this setup too
🔁 Save this for trade journaling or future backtest
📊 Follow @ChartNinjas88 for smart money plays every day!
USDJPY H4 I Bullish Bounce Based on the H4 chart analysis, the price is approaching our buy entry level at 143.08, a pullback support that aligns closely with the 78.6% Fibonacci retracement.
Our take profit is set at 144.02, an overlap resistance.
The stop loss is placed at 142.12, a swing low support.
High Risk Investment Warning
Trading Forex/CFDs on margin carries a high level of risk and may not be suitable for all investors. Leverage can work against you.
Stratos Markets Limited (tradu.com ):
CFDs are complex instruments and come with a high risk of losing money rapidly due to leverage. 63% of retail investor accounts lose money when trading CFDs with this provider. You should consider whether you understand how CFDs work and whether you can afford to take the high risk of losing your money.
Stratos Europe Ltd (tradu.com ):
CFDs are complex instruments and come with a high risk of losing money rapidly due to leverage. 63% of retail investor accounts lose money when trading CFDs with this provider. You should consider whether you understand how CFDs work and whether you can afford to take the high risk of losing your money.
Stratos Global LLC (tradu.com ):
Losses can exceed deposits.
Please be advised that the information presented on TradingView is provided to Tradu (‘Company’, ‘we’) by a third-party provider (‘TFA Global Pte Ltd’). Please be reminded that you are solely responsible for the trading decisions on your account. There is a very high degree of risk involved in trading. Any information and/or content is intended entirely for research, educational and informational purposes only and does not constitute investment or consultation advice or investment strategy. The information is not tailored to the investment needs of any specific person and therefore does not involve a consideration of any of the investment objectives, financial situation or needs of any viewer that may receive it. Kindly also note that past performance is not a reliable indicator of future results. Actual results may differ materially from those anticipated in forward-looking or past performance statements. We assume no liability as to the accuracy or completeness of any of the information and/or content provided herein and the Company cannot be held responsible for any omission, mistake nor for any loss or damage including without limitation to any loss of profit which may arise from reliance on any information supplied by TFA Global Pte Ltd.
The speaker(s) is neither an employee, agent nor representative of Tradu and is therefore acting independently. The opinions given are their own, constitute general market commentary, and do not constitute the opinion or advice of Tradu or any form of personal or investment advice. Tradu neither endorses nor guarantees offerings of third-party speakers, nor is Tradu responsible for the content, veracity or opinions of third-party speakers, presenters or participants.

Bullish bounce?USD/JPY is falling towards the support level which id a pullback support that lines up with the 71% Fibonacci retracement and could bounce from this level to our take profit.
Entry: 143.29
Why we lke it:
There is a pullback support level that aligns with the 71% Fibonacci retracement.
Stop loss:142.36
Why we like it:
There is a pullback support level that lines up with the 61.8% Fibonacci projection.
Take profit: 145.88
Why we like it:
There is a pullback resistance level.
Enjoying your TradingView experience? Review us!
Please be advised that the information presented on TradingView is provided to Vantage (‘Vantage Global Limited’, ‘we’) by a third-party provider (‘Everest Fortune Group’). Please be reminded that you are solely responsible for the trading decisions on your account. There is a very high degree of risk involved in trading. Any information and/or content is intended entirely for research, educational and informational purposes only and does not constitute investment or consultation advice or investment strategy. The information is not tailored to the investment needs of any specific person and therefore does not involve a consideration of any of the investment objectives, financial situation or needs of any viewer that may receive it. Kindly also note that past performance is not a reliable indicator of future results. Actual results may differ materially from those anticipated in forward-looking or past performance statements. We assume no liability as to the accuracy or completeness of any of the information and/or content provided herein and the Company cannot be held responsible for any omission, mistake nor for any loss or damage including without limitation to any loss of profit which may arise from reliance on any information supplied by Everest Fortune Group.

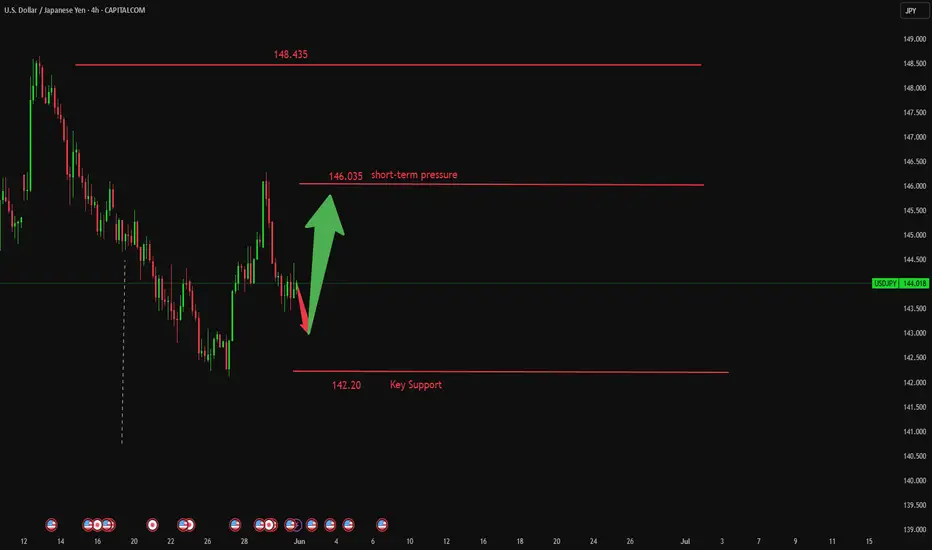
Sunday Start Just a look into what my thoughts are to start this week.
Price points are 144.750 for a buy and 143.450 for a sell. I believe that between those two points will be a lot of consolidation and recommend waiting for an open and close above or beneath before entry.
This is just an idea based off my observations. I'll share ideas based off my indicators and economic reports Monday, Wednesday, and wrap up everything Friday. Saturday, you'll see ideas for next week.

Bullish bounce off pullback support?USD/JPY is falling towards the pivot which acts as a pullback support and could bounce to the 1st resistance.
Pivot: 141.94
1st Support: 140.24
1st Resistance: 148.56
,Risk Warning:
Trading Forex and CFDs carries a high level of risk to your capital and you should only trade with money you can afford to lose. Trading Forex and CFDs may not be suitable for all investors, so please ensure that you fully understand the risks involved and seek independent advice if necessary.
Disclaimer:
The above opinions given constitute general market commentary, and do not constitute the opinion or advice of IC Markets or any form of personal or investment advice.
Any opinions, news, research, analyses, prices, other information, or links to third-party sites contained on this website are provided on an "as-is" basis, are intended only to be informative, is not an advice nor a recommendation, nor research, or a record of our trading prices, or an offer of, or solicitation for a transaction in any financial instrument and thus should not be treated as such. The information provided does not involve any specific investment objectives, financial situation and needs of any specific person who may receive it. Please be aware, that past performance is not a reliable indicator of future performance and/or results. Past Performance or Forward-looking scenarios based upon the reasonable beliefs of the third-party provider are not a guarantee of future performance. Actual results may differ materially from those anticipated in forward-looking or past performance statements. IC Markets makes no representation or warranty and assumes no liability as to the accuracy or completeness of the information provided, nor any loss arising from any investment based on a recommendation, forecast or any information supplied by any third-party.

USDJPY DUMPINGUSDJPY remains under pressure, and top-down analysis suggests continued downside momentum. All signs point to a potential extension of the current bearish move, fingers crossed.

USD/JPY) bullish choch Analysis Read The ChaptianSMC trading point update
Technical analysis of USD/JPY presents a bullish outlook with Smart Money Concepts (SMC)-based logic. Here's a breakdown of the idea and key elements:
---
Chart Summary
Current Market Context
Price: ~144.05
EMA 200: Acting as dynamic resistance at 144.19
Trendline: Broken, signaling a potential shift in market structure
Change of Character (ChoCh): Confirmed around 143.3, marking a bullish transition
---
Key Zones Identified
1. Support Level (Strong Demand Zone)
Around 141.8–142.5
Marked by historical rejections
Possible mitigation of unfilled orders here
2. Fair Value Gap (FVG)
Between 143.0–143.8
Price may return to fill this imbalance before rising
---
Projected Move
Price is expected to:
1. Dip into the FVG or Support Zone to mitigate imbalance
2. Reverse and make a bullish rally
3. Reach the target point near 148.68 (approx. +4.55%)
---
RSI Analysis (14-period)
Current RSI: ~49 (neutral)
No overbought/oversold condition
Room for upside momentum
---
Notable Features
Break of structure (ChoCh) → Bullish signal
EMA crossover potential → Bullish confluence
Multiple FVG fills + support reaction → Entry confirmation opportunities
Economic events marked → Be cautious of volatility spikes
Mr SMC Trading point
---
Trading Idea Summary
Buy Entry Zone: 141.8–143.0 (support or FVG)
Stop Loss: Below 141.5
Target: 148.68
Risk/Reward: Favorable (approx. 1:3+)
Pales support boost 🚀 analysis follow)

USD/JPY) Bullish reversal analysis Read The ChaptianMr SMC Trading point update
Technical analysis for the USD/JPY (U.S. Dollar / Japanese Yen) on the 4-hour timeframe. Here's a detailed breakdown of the idea and strategy:
---
Key Components of the Chart:
1. Strong Support Zone:
The yellow zone is labeled as a “big support level of pullback”, around the 142.00 – 141.20 range.
Price has historically bounced from this zone, suggesting demand and buyer interest.
2. Bullish Structure Setup:
Price is forming a double bottom or potential reversal pattern in the support zone.
A downtrend line is clearly marked, and a break above this trendline would signal bullish continuation.
3. EMA 200 (at 145.020):
The EMA is currently acting as dynamic resistance.
A breakout above the EMA would confirm further bullish momentum.
4. RSI Indicator:
RSI is currently below 30, indicating the market is oversold – a common precursor to a bullish reversal.
5. Target Levels:
Target 1: 145.803 – likely the first resistance level or EMA retest.
Target 2: 148.587 – a prior high and strong resistance area.
6. Projection:
Price is expected to bounce from support, break the trendline, retest, and then rally to higher levels.
---
Trade Idea Summary:
Bias: Bullish
Entry Zone: Near 142.00 – 141.20 (support zone)
Confirmation: Break above the descending trendline + bullish RSI divergence
Targets:
TP1: 145.803
TP2: 148.587
Invalidation: Break and close below 141.00 (support zone broken)
Mr SMC Trading point
---
Risk Management Suggestion:
Use a tight stop-loss below the support zone, considering it's the key reversal area. Also, keep an eye on fundamental factors such as U.S. and Japan interest rate decisions or key economic events (indicated by the icons on the chart).
Pales support boost 🚀 analysis follow)

decline🔹Bearish Targets:
▪️ 1st Target: 143.09(near-term support)
-----------------------------------------
If you find this analysis helpful in your trading journey, feel free to share your thoughts or questions in the comments. Let’s work together to maintain a disciplined, technical approach to the markets.

Is a new round of decline impending?
The latest prices of USD/JPY are fluctuating around the range of 1.43922 to 1.44275, with an average price of 1.43917. The earlier pullback from higher levels indicates some downward pressure. On the upside, the pair may encounter resistance near the 144.20 level, with the next key resistance at around 144.50 and the first major resistance at 145.00. A close above the 145.00 level could lay the foundation for further gains.
Under the above scenario, the pair may even break through the 146.00 resistance level, with the next major target for bulls near the 147.80 resistance level.
Humans need to breathe, and perfect trading is like breathing—maintaining flexibility without needing to trade every market swing. The secret to profitable trading lies in implementing simple rules: repeating simple tasks consistently and enforcing them strictly over the long term.
USDJPY Weekly overview Jun 1, 2025 – Jun 7, 2025The purple line is the optional TP for traders who wants to have 2 steps take profit points. BOJ Gov Ueda Speaks could make market move faster in its direction. avoid trading around his speech.
*******************************************************************
The indicated levels are determined based on the most reaction points and the assumption of approximately equal distance between the zones.
Some of these points can also be confirmed by the mathematical intervals of Murray.
You can enter with/without confirmation. IF you want to take confirmation you can use LTF analysis, Spike move confirmation, Trend Strength confirmation and ETC.
SL could be placed below the zone or regarding the LTF swings.
TP is the next zone or the nearest moving S&R, which are median and borders of the drawn channels.
*******************************************************************
Role of different zones:
GREEN: Just long trades allowed on them.
RED: Just Short trades allowed on them.
BLUE: both long and short trades allowed on them.
WHITE: No trades allowed on them! just use them as TP points

USDJPY - SellExpecting sell on USDJPY. It dropped from Value Area and now building volume to drop down further. I shall wait for 3rd touch on top before selling.

USDJPY starting bullish move?Hello traders, this is a complete multiple timeframe analysis of this pair. We see could find significant trading opportunities as per analysis upon price action confirmation we may take this trade. Smash the like button if you find value in this analysis and drop a comment if you have any questions or let me know which pair to cover in my next analysis.


USDJPY Will Grow! Long!
Here is our detailed technical review for USDJPY.
Time Frame: 8h
Current Trend: Bullish
Sentiment: Oversold (based on 7-period RSI)
Forecast: Bullish
The market is trading around a solid horizontal structure 144.062.
The above observations make me that the market will inevitably achieve 145.457 level.
P.S
We determine oversold/overbought condition with RSI indicator.
When it drops below 30 - the market is considered to be oversold.
When it bounces above 70 - the market is considered to be overbought.
Disclosure: I am part of Trade Nation's Influencer program and receive a monthly fee for using their TradingView charts in my analysis.
Like and subscribe and comment my ideas if you enjoy them!

USDJPY 4H Analysis – Market Dynamics ChangingDear Traders,
Guys, the bearish trend in USDJPY has now shifted into a bullish uptrend. My target level for USDJPY is 146.330. Once it reaches my target, I will share updates under this post.
Friends, every single like from you is my biggest source of motivation when it comes to sharing my analysis.
A huge thank you to everyone who supports me with their likes!

JPYUSD Weekly Analysis (MMC) – Smart Structure & Target Zones🧠 Market Sentiment & Technical Landscape
The JPYUSD currency pair has entered a decisive phase in its multi-week bullish run, driven by structural integrity, smart money behavior, and market psychology. This chart captures a strategic trade progression using the Mind Market Concept (MMC) approach — a hybrid strategy blending curve dynamics, volume imprints, and structural flow to track institutional intent.
We're seeing a powerful alignment of structure, momentum, and volume signals, all pointing to a potential high-probability completion near the upper target/reversal zone.
🔍 In-Depth Technical Breakdown
🔹 1. Curve Support Foundation – The Psychological Bedrock
At the heart of this bullish move lies the Black Mind Curve Support — a dynamic, rounded trendline support based on momentum cycles and structural lows. This curve is not arbitrary; it’s a reflection of where smart money has repeatedly absorbed sell-side liquidity before marking up the price.
Multiple rejections from this zone around 0.00640 – 0.00650 provided confirmation of intent.
The rounded nature of this curve support mimics market accumulation patterns — think of it as a “loading zone” before explosive movement.
🔹 2. Structural Breakout – A Clean Bullish Sequence
Price respected a multi-month resistance line and finally broke out in April–May 2025. The breakout wasn't just technical — it occurred after:
A liquidity sweep below the February-March higher low
A retest of the curve
A sharp bullish engulfing formation on the weekly chart
This combination confirms a high-confidence shift in market structure — transitioning from ranging accumulation to directional markup.
🔹 3. Volume Imprints – Institutional Footprints
The chart highlights a Needed Volume area — this is where previous institutional order blocks likely existed. The strong bullish move into that zone confirms:
Buyers were active and aggressive
The area served as both resistance and a breakout retest
This volume footprint now acts as a supportive launchpad, reaffirming trend continuation logic.
🔹 4. Target + Next Reversal Zone
As price continues climbing, it’s now approaching a critical confluence zone around 0.00720 – 0.00725. This zone is projected using:
Fibonacci extension of the last impulse
Measured move symmetry
Historical supply and resistance (Q3 2024 highs)
This is not just a target — it’s a high-probability reversal area. Expect:
Potential exhaustion candles
Momentum divergence
Institutional profit-taking
📊 MMC Strategy Approach – Trade Blueprint
Parameter Detail
Bias Bullish (until reversal confirmation)
Current Price ~0.00694
Buy Zone 0.00685–0.00690 (pullback entry)
Target Zone 0.00720–0.00725
Curve Support 0.00650–0.00660
Invalidation Clean break below curve or engulfing bear momentum
This MMC-based setup emphasizes patience, psychological precision, and proper confirmation for both entry and exit. The idea is to buy smart (on structure), and exit smarter (at institutional interest zones).
⚠️ Key Trader Insights
Don’t chase — wait for clean entry signals near structure (curve or trendline retest).
Use volume confirmation — don’t trade against low-volume rejections at resistance.
Watch emotional extremes — FOMO at targets often precedes reversal.
Plan for both scenarios:
Continuation → scale partial profits at target
Reversal → shift bias if bearish confirmation aligns with momentum loss
🔖 Summary Outlook
✅ Trend: Bullish continuation, respecting structure
🎯 Immediate Focus: Reaching the 0.0072 Target + Next Reversal Zone
🔄 Actionable Tip: Monitor for rejection/absorption candles in the upper blue zone
💼 Risk Management: Use curve break or engulfing reversal as an exit trigger
This setup reflects high technical confluence and fits into a longer-term institutional roadmap. Whether you're swing trading or intraday scaling within this wave — the logic remains powerful.

USDJPY COT and Liquidity AnalysisHey what up traders welcome to the COT data and Liquidity report. It's always good to go with those who move the market here is what I see in their cards. I share my COT - order flow views every weekend.
🎯 Goal of this ideas is track order flow.
📍Please be aware that institutions report data to the SEC on Tuesdays and data are reported on Fridays - so again we as retail traders have disadvantage, but there is possibility to read between the lines. Remember in the report is what they want you to see, that's why mostly price reverse on Wednesday after the report so their cards are hidden as long as possible. However if the trend is running you can read it and use for your advantage.
💊 Tip
if the level has confluence with the high volume on COT it can be strong support / Resistance.
👍 Hit like if you find this analysis helpful, and don't hesitate to comment with your opinions, charts or any questions.
Analysis done on the Tradenation Charts
Disclosure: I am part of Trade Nation's Influencer program and receive a monthly fee for using their TradingView charts in my analysis.
"Adapt what is useful, reject what is useless, and add what is specifically your own."
— David Perk aka Dave FX Hunter ⚔️

NEXT WEEK USDJPY SELL NOW READ CAPTAIN( USDJPY) SELL zone
( trade satup )
entry point (144.030) to (143.900) 📊
first tp (143.650)📊
2nd target (143.370) 📊
last target (143.00) 📊
stop loss (144.220)❌

4 Hour Gartley PatternUSDJPY possible Gartley Pattern on the 4Hr, with a possible Brk to the downside to 4 hour support before turning Bullish.

We are waiting for the sale.✅ **Clean profit zones** below (no messy consolidations until 142.700 and 141.900).
**bearish scenario is logical and probable** *unless* the market gives a strong reaction above 144.500.
