USDJPY Analysis (prediction)Hi everyone sorry I am sick so just have to bear with me. Please note this is not financial advice and for my own educational purposes. happy trading evertone
USDJPY_SPT trade ideas

USDJPY 15M LAST OPPOTUNITY TO FLYHere where we re-invest THE HALF LOT we close earlier today on the trade that we took yesterday (THE REMAINING HALF STILL RUNNING {https://www.tradingview.com/chart/USDJPY/vYQEgzZy-USDJPY-LAST-LIQUDITY-GRAB-BEFORE-WE-FLY-TO-THE-MOON/} LINK),
Same TARGET OF 149.79 But as usual will keep TAKING PROFIT along the way
Will update every time i change something
Please comment welcome and if you have any question just Halaa :)
All the best and good night

Bullish bounce off pullback support?USD/JPY is falling towards the pivot and could bounce to the 1st resistance, which is a pullback resistance.
Pivot: 142.53
1st Support: 140.78
1st Resistance: 146.72
Risk Warning:
Trading Forex and CFDs carries a high level of risk to your capital and you should only trade with money you can afford to lose. Trading Forex and CFDs may not be suitable for all investors, so please ensure that you fully understand the risks involved and seek independent advice if necessary.
Disclaimer:
The above opinions given constitute general market commentary, and do not constitute the opinion or advice of IC Markets or any form of personal or investment advice.
Any opinions, news, research, analyses, prices, other information, or links to third-party sites contained on this website are provided on an "as-is" basis, are intended only to be informative, is not an advice nor a recommendation, nor research, or a record of our trading prices, or an offer of, or solicitation for a transaction in any financial instrument and thus should not be treated as such. The information provided does not involve any specific investment objectives, financial situation and needs of any specific person who may receive it. Please be aware, that past performance is not a reliable indicator of future performance and/or results. Past Performance or Forward-looking scenarios based upon the reasonable beliefs of the third-party provider are not a guarantee of future performance. Actual results may differ materially from those anticipated in forward-looking or past performance statements. IC Markets makes no representation or warranty and assumes no liability as to the accuracy or completeness of the information provided, nor any loss arising from any investment based on a recommendation, forecast or any information supplied by any third-party.

* No bullish defense yet, and volume is not showing divergence.The probability of continuation **to the downside is still high**, especially if the price closes a strong bearish candle below **143.90** in the next few hours.

Downtrend Slowing – Recovery Opportunity After Correction?USD/JPY: Downtrend Slowing – Recovery Opportunity After Correction?
Hello TradingView community!
Today, let's focus on analyzing the USD/JPY pair, which is showing interesting developments after its recent correction.
🌍 Macro Overview: USD/JPY Under Current Pressures
The market is observing shifts in the dynamics of the USD/JPY pair:
UOB Group's 24-Hour View: The USD experienced a sharp decline from 148.02 on Monday to 144.49, despite being "oversold". This indicates a slowing in the downtrend, though caution remains.
Retest Expected: According to UOB Group, there's a likelihood of USD/JPY retesting the 144.50 level before a more sustained recovery can be expected.
Downside Limited: A drop below 144.50 cannot be ruled out, but based on current momentum, any further weakness is unlikely to reach 144.00.
Resistance Levels: On the upside, resistance levels are noted at 145.20 and 145.55.
Overall, USD/JPY is in a phase of seeking equilibrium after a significant decline.
📊 Technical Analysis & USD/JPY Trading Plan
Based on the USD/JPY chart (H4/M30) you provided:
Overall Trend: The pair has undergone a relatively deep corrective decline after reaching a local peak, but appears to be seeking a strong support zone.
Key Price Levels:
Crucial Resistance (SELL Zone): Clearly at 144.894 - 145.178. This is an confluence area of Fibonacci levels and local highs where selling pressure could emerge strongly.
Important Support (Potential BUY Zone): Around 143.800 - 143.500. This represents a potential bottoming area where demand might be strong enough to push the price higher.
Projected Price Action: After the sharp decline, USD/JPY might retest the 144.50 area. If it holds above key support levels, an upward move towards resistance zones is plausible, as indicated by the arrows on the chart.
🎯 USD/JPY Trading Plan:
BUY ZONE: 143.800 - 143.500
SL: 143.400
TP: 144.000 - 144.200 - 144.500 - 144.800 - 145.000 - 145.200 - 145.500
SELL ZONE: 144.894 - 145.178
SL: 145.300
TP: 144.700 - 144.500 - 144.200 - 144.000 - 143.800 - 143.500
⚠️ Key Factors to Monitor:
US and Japanese Economic Data: Upcoming reports on inflation and employment from both nations could significantly impact Fed and BoJ policy expectations.
BoJ Policy Decisions: Any shifts in the Bank of Japan's stance will create strong volatility for the JPY.
Global Risk Sentiment: Changes in overall market sentiment can also affect JPY crosses.
Trade smart and stay informed! Wishing everyone a successful USD/JPY trading day!

demand zone spotted... LET THE HUNTING BEGIN!!!📉 USD/JPY 4H Analysis – Demand Zone Revisit Expected
The pair is currently in a retracement phase after tapping into a higher-timeframe supply zone. Let's break down the structure and reasoning behind this setup:
1. Market Structure & Smart Money Footprints
• The chart begins with a clear Break of Structure (BOS) to the upside from a prior low, confirming a bullish shift.
• This upward move was supported by multiple Short-Term Supports (SS) that were respected throughout the bullish trend.
• Price has maintained a general uptrend structure, making higher lows and higher highs, but is now showing signs of a correction.
2. Supply and Demand Zones
• Supply Zone (147.288 – 148.000):
This is the last bearish zone before a sharp sell-off, indicating institutional selling pressure. Price tapped into this zone and has since reacted bearishly — a likely area where smart money took profits or initiated shorts.
• Demand Zone (139.740 – 140.728):
Marked from the origin of the bullish impulse and supported by a previous BOS, this is a critical area where institutional buying may resume. It also aligns with a liquidity sweep and previously unmitigated demand — a key confluence zone for potential longs.
3. Current Market Behavior
• Price is currently declining toward the demand zone, and based on structure, this is likely a healthy retracement.
• The chart suggests a buy limit setup at demand, with a tight stop just below 139.740 and a target near the previous supply reaction.
________________________________________
✅ Trade Idea
• Bias: Bullish from demand
• Entry: Around 140.728
• Stop Loss: Below 139.740
• Take Profit: 147.288 (just before the supply zone)
• Risk-to-Reward: Approx. 1:4
This setup assumes price will respect demand and continue the bullish structure, especially after multiple SS validations and a strong institutional reaction in the past.
🧠 Final Thoughts
This setup reflects classic Smart Money Concept principles:
• Structure shift via BOS
• Entry at unmitigated demand
• Exit just before major supply
• Strong confluence from price history and liquidity sweep zones
Wait for confirmation in the demand zone — a bullish engulfing, internal BOS, or FVG fill could give additional confidence to enter long.
NB: x represents previous liquidity sweep
$$ represents liquidity
bos represents break of structure
CHEERS TO WEALTH!!!

Fundamental Market Analysis for June 30, 2025 USDJPYThe USD/JPY pair is attracting some sellers towards 143.85 during the Asian session on Monday. The U.S. dollar (USD) is weakening against the Japanese yen (JPY) amid rising bets for a Federal Reserve (Fed) interest rate cut.
The United States (US) and China are close to a deal on tariffs. However, U.S. President Donald Trump abruptly ended trade talks with Canada, adding uncertainty to the market's positive outlook.
In addition, traders are betting that the U.S. central bank will cut rates more frequently and possibly sooner than previously expected. Markets estimate the probability of a quarter-point Fed rate cut at nearly 92.4%, up from 70% a week earlier.
On the data side, the personal consumption expenditure (PCE) price index rose 2.3% in May, up from 2.2% in April (revised from 2.1%), the U.S. Bureau of Economic Analysis reported Friday. This value matched market expectations. Meanwhile, the core PCE price index, which excludes volatile food and energy prices, rose 2.7% in May, following a 2.6% increase (revised from 2.5%) seen in April.
On the other hand, the Bank of Japan's (BoJ) cautious stance on interest rate hikes could put pressure on the yen and create a tailwind for the pair.
Trade recommendation: SELL 143.50, SL 144.30, TP 142.40

Bearish drop?USD/JPY is reacting off te pivot and could drop t the 1st support.
Pivot: 144.67
1st Support: 143.07
1st Resistance: 145.89
Risk Warning:
Trading Forex and CFDs carries a high level of risk to your capital and you should only trade with money you can afford to lose. Trading Forex and CFDs may not be suitable for all investors, so please ensure that you fully understand the risks involved and seek independent advice if necessary.
Disclaimer:
The above opinions given constitute general market commentary, and do not constitute the opinion or advice of IC Markets or any form of personal or investment advice.
Any opinions, news, research, analyses, prices, other information, or links to third-party sites contained on this website are provided on an "as-is" basis, are intended only to be informative, is not an advice nor a recommendation, nor research, or a record of our trading prices, or an offer of, or solicitation for a transaction in any financial instrument and thus should not be treated as such. The information provided does not involve any specific investment objectives, financial situation and needs of any specific person who may receive it. Please be aware, that past performance is not a reliable indicator of future performance and/or results. Past Performance or Forward-looking scenarios based upon the reasonable beliefs of the third-party provider are not a guarantee of future performance. Actual results may differ materially from those anticipated in forward-looking or past performance statements. IC Markets makes no representation or warranty and assumes no liability as to the accuracy or completeness of the information provided, nor any loss arising from any investment based on a recommendation, forecast or any information supplied by any third-party.

USDJPY 15M BULLS START TO SHOW THERE MUSCLES :))))As we can see we have been rejected @ a VERY STRONG SUPPORT AREA, and small time frame give us good BULLISH FORMATION (Creating LL/HL with DIVERGANCE)
Im looking to hold at list 1 lot, as i believe this could be a bottom for a START OF MASSIVE BULL RUN (ONLY TIME WILL TELL)
As usual will update everything here
Thanks

CHECK USDJPY SIGNAL READ CAPTAINbuy Setup)
Entry Zone: Around 144.800\144.700
Stop Loss: 144.300
Take Profits:
TP1: ~145.100
TP2: ~145.500
Final Target: 145.800

USD/JPY dropping 228 pips towards 141.978!1). Market sentiment is @ 141.9857. 2). Banks are selling. 3). Huge supply liquidity awaits the drop! 4). Market makers like to take-out stops! 5). The dropping sequence needs to complete the wave 5! 6). Price action loves the .728 fib level the most!

USD/JPY) bearish Trand analysis Read The captionSMC trading point update
Technical analysis of USD/JPY on the 3-hour timeframe, highlighting a breakdown from trendline resistance and projecting a move toward a significant downside target.
---
Technical Breakdown
1. Trendline Rejection
Price sharply rejected from the descending resistance trendline near 148.00 (red arrow), forming a potential lower high.
This suggests continuation of the broader downtrend structure.
2. Break Below EMA 200
Price has broken below the 200 EMA (144.752), signaling a shift in momentum from bullish to bearish.
EMA is likely to act as dynamic resistance if price attempts a pullback.
3. Bearish Projection
The chart outlines a measured move downward toward the target point at 139.955, implying a drop of over 5.36% (approximately 770 pips).
The projected path shows lower highs and lower lows, confirming bearish structure.
4. RSI Confirmation
RSI (14) is currently at 29.98, indicating oversold conditions, but this often supports strong momentum in trending markets—suggesting a possible continuation lower after minor retracements.
Mr SMC Trading point
---
Conclusion / Idea Summary
Bias: Bearish
Entry: After trendline rejection and EMA 200 break (~144.75)
Target: 139.955
Invalidation: Break above 148.00 resistance trendline
---
Please support boost 🚀 this analysis)

USDJPY LAST LIQUDITY GRAB BEFORE WE FLY TO THE MOONI took this 15m @ 144.623 i believe this is last LIQUIDITY GRAB before we fly
Risk reward is very good lets hope our probability works
I will hold this till main target or get decline formation
I will update either way, WIN/LOST
Wish me luck
Thanks

Waiting to sell USDJPYWait for price to retest the trendline/resisitence zone then watch for an engulfing bearish candle on 15min or 30 minute chart
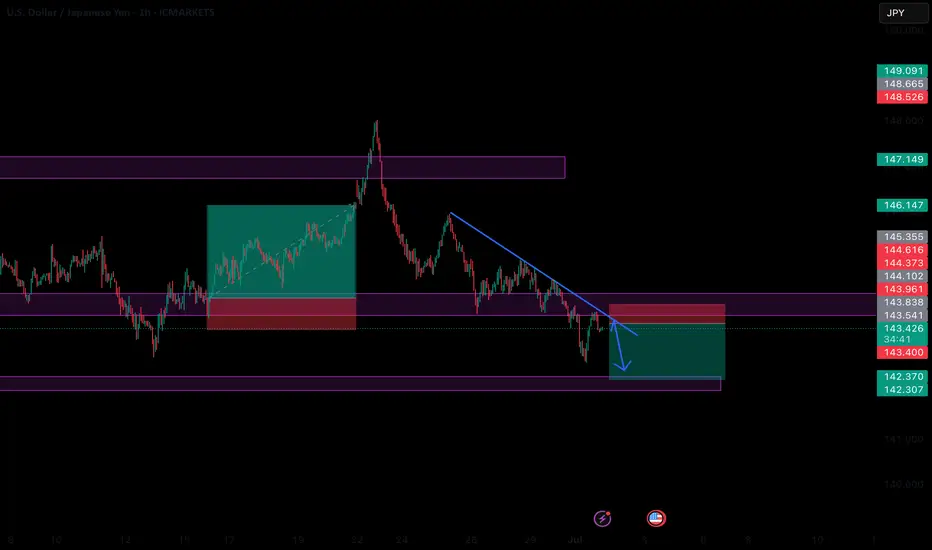
Potential bearish drop?USD/JPY has rejected off the resistance level which is a pullback resistance and could drop from this level to our take profit.
Entry: 144.61
Why we like it:
There is a pullback resistance level.
Stop loss: 146.11
Why we like it:
There is a pullback resistance level.
Take profit: 142.70
Why we like it:
There is a pullback support level that lines up with the 100% Fibonacci projection.
Enjoying your TradingView experience? Review us!
Please be advised that the information presented on TradingView is provided to Vantage (‘Vantage Global Limited’, ‘we’) by a third-party provider (‘Everest Fortune Group’). Please be reminded that you are solely responsible for the trading decisions on your account. There is a very high degree of risk involved in trading. Any information and/or content is intended entirely for research, educational and informational purposes only and does not constitute investment or consultation advice or investment strategy. The information is not tailored to the investment needs of any specific person and therefore does not involve a consideration of any of the investment objectives, financial situation or needs of any viewer that may receive it. Kindly also note that past performance is not a reliable indicator of future results. Actual results may differ materially from those anticipated in forward-looking or past performance statements. We assume no liability as to the accuracy or completeness of any of the information and/or content provided herein and the Company cannot be held responsible for any omission, mistake nor for any loss or damage including without limitation to any loss of profit which may arise from reliance on any information supplied by Everest Fortune Group.

Market next move Disruption of the Bullish USD/JPY Analysis
1. Weak Bullish Momentum
The current bullish attempt is showing small-bodied candles with low follow-through.
Disruption: This suggests a lack of conviction from buyers. If there’s no strong bounce soon, it could indicate distribution rather than accumulation.
2. Volume Imbalance
Notice the recent spike in bearish volume (red bars), especially during the last price drop.
Disruption: Volume is supporting the downtrend, not the rebound. This suggests sellers are still in control.
3. Lower High Structure
The price recently failed to form a higher high and continues forming lower highs and lower lows.
Disruption: This pattern is a classic sign of a continuing bearish trend, contradicting the bullish target.
4. Fundamental Headwinds
The U.S. economic icon (flag) suggests an upcoming high-impact event — likely NFP, GDP, or rate decision.
Disruption: If U.S. data is weak or if there's talk of the Fed pausing rate hikes, USD could weaken, pushing USD/JPY further below 144.000.

USDJPY SHORT Market structure bearish on HTFs 3
Entry at Daily AOi
Weekly Rejection at AOi
Daily Rejection at AOi
Daily EMA retest
Previous Structure point Daily
Around Psychological Level 145.000
H4 EMA retest
H4 Candlestick rejection
H4 Head and Shoulder Pattern, Retest of the neckline
Levels 3.56
Entry 95%
DUE TO H4 I WILL BE GOING 1/2 A % RISK TO SEE IF MY EDGE WILL WORK
REMEMBER : Trading is a Game Of Probability
: Manage Your Risk
: Be Patient
: Every Moment Is Unique
: Rinse, Wash, Repeat!
: Christ is King.

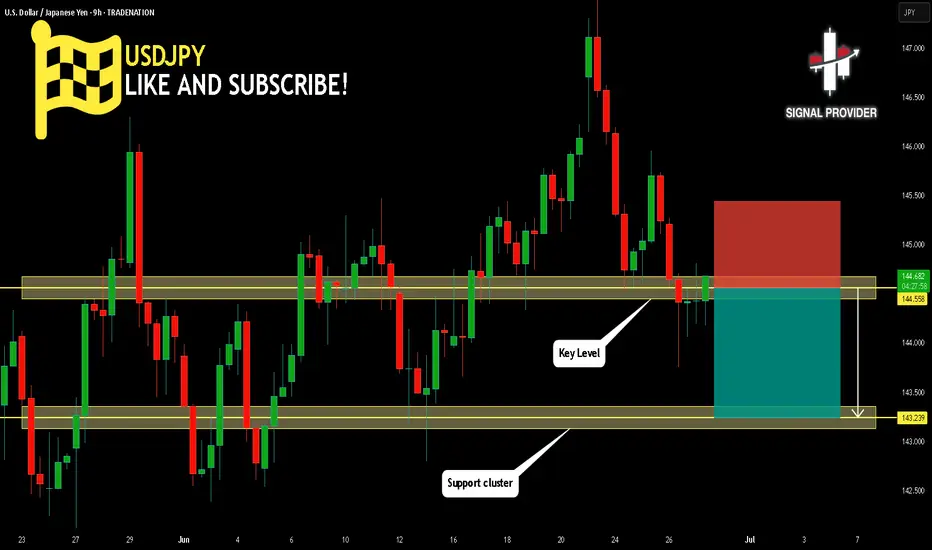
USDJPY Will Go Lower From Resistance! Sell!
Take a look at our analysis for USDJPY.
Time Frame: 9h
Current Trend: Bearish
Sentiment: Overbought (based on 7-period RSI)
Forecast: Bearish
The market is testing a major horizontal structure 144.558.
Taking into consideration the structure & trend analysis, I believe that the market will reach 143.239 level soon.
P.S
Overbought describes a period of time where there has been a significant and consistent upward move in price over a period of time without much pullback.
Disclosure: I am part of Trade Nation's Influencer program and receive a monthly fee for using their TradingView charts in my analysis.
Like and subscribe and comment my ideas if you enjoy them!
USDJPY Poised for a BreakoutUSDJPY Poised for a Breakout
On the 4-hour chart, USDJPY is not yet taking a clear direction. The price is showing the possibility of both movements.
With the current data we can see that USDJPY is forming a triangle pattern and only the breakdown up or down will show the direction of the price.
However, I think the chances are higher for the bullish movement considering that the geopolitical tension in the Middle East is also very high and the USD remains one of the strongest currencies.
Bullish target: 147.90
Bearish target: 140.90
⚠️ Note: If the pattern transforms more than this triangle, then we may be in a different situation and everything may be invalid. The analysis may change over time.
You may find more details in the chart!
Thank you and Good Luck!
❤️PS: Please support with a like or comment if you find this analysis useful for your trading day❤️
Disclosure: I am part of Trade Nation's Influencer program and receive a monthly fee for using their TradingView charts in my analysis.

BUY USDJPYThe price drop on UJ has been wild however price is at a good support zone, we see the ABCD pattern by way of a bullish Fibonacci invasion setup hoping it will give good liquidity. Buy wisely.

USDJPY Daily TF - June 29th, 2025USDJPY Daily Neutral Idea
Monthly - Bullish
Weekly - Bearish
Daily - Bearish
I’m looking at the Daily time frame here as this is the only clear picture for price action in terms of trends. The 4hour looks like price action can’t make a decision so we will wait for price action to get closer to some major zones.
Bearish Continuation - Ideally, we want to see price action touch 147.500 again followed by convincing bearish rejection. Look to target lower toward major support levels if this happens.
Aside from this potential setup we don’t have much to look at here on UJ.

USDJPY 15M BUY FRIDAY DELIGHT LOLEvery pips count Scalping 15m
Reason to buy
Strong SUPPORT 144.22
Lets hope we get PAID @ THIS LOVELY SUNNY LONDON :))))

USD/JPY BEARS ARE GAINING STRENGTH|SHORT
Hello, Friends!
Bearish trend on USD/JPY, defined by the red colour of the last week candle combined with the fact the pair is overbought based on the BB upper band proximity, makes me expect a bearish rebound from the resistance line above and a retest of the local target below at 143.964.
Disclosure: I am part of Trade Nation's Influencer program and receive a monthly fee for using their TradingView charts in my analysis.
LIKE AND COMMENT MY IDEAS
