JPY PAIRS BUY IDEA DEVELOPING will market continue to breakdown or break up and retest the zones ploted for this week
USDJPY_SPT trade ideas

Long Entry Idea 📈 USD/JPY Weekly Swing Setup
🗓️ Bias: Long from Weekly Demand Zone
📍 Context: Price is approaching a higher-timeframe demand block with a strong reaction expected. Structure shows repeated sweeps and rejection near weekly EQ. Looking to catch the macro reversal from the lows before liquidity floods the upside.
🟦 ENTRY ZONE
141.300 – 140.900
Weekly demand + prior structural sweep + inside discount territory
🔻 STOP LOSS
139.700
Below major liquidity shelf + protected weekly low
🧨 Risk: ~160 pips
🛡 Use position sizing accordingly
🎯 TAKE PROFITS
Target Price Reason
TP1 143.951 High chance reclaim to minor resistance
TP2 144.921 Weekly EQ zone
TP3 146.178 Clean inefficiency + OB fill
TP4 149.385 Final premium zone / supply
📌 Trade Narrative
Looking for a long setup off weekly demand between 141.300–140.900.
Expecting bullish reversal and liquidity run through prior highs.
Structure is showing signs of exhaustion on the bearish leg, and weekly CHoCH zones have formed.
TP1 holds ~80% probability as it aligns with daily inefficiency and structure.
Remaining targets scale through unfilled FVGs into premium territory.
🧠 Risk-Reward
SL: 139.700
Entry: 141.300
TP1: 143.951 → ~2.6R
TP4: 149.385 → ~5R+

USD/JPY H4 | Overhead pressures remain?USD/JPY is rising towards a pullback resistance and could potentially reverse off this level to drop lower.
Sell entry is at 143.27 which is a pullback resistance that aligns with the 50.0% Fibonacci retracement.
Stop loss is at 144.42 which is a level that sits above the 23.6% and 78.6% Fibonacci retracements and a swing-high resistance.
Take profit is at 141.96 which is a multi-swing-low support.
High Risk Investment Warning
Trading Forex/CFDs on margin carries a high level of risk and may not be suitable for all investors. Leverage can work against you.
Stratos Markets Limited (tradu.com ):
CFDs are complex instruments and come with a high risk of losing money rapidly due to leverage. 63% of retail investor accounts lose money when trading CFDs with this provider. You should consider whether you understand how CFDs work and whether you can afford to take the high risk of losing your money.
Stratos Europe Ltd (tradu.com ):
CFDs are complex instruments and come with a high risk of losing money rapidly due to leverage. 63% of retail investor accounts lose money when trading CFDs with this provider. You should consider whether you understand how CFDs work and whether you can afford to take the high risk of losing your money.
Stratos Global LLC (tradu.com ):
Losses can exceed deposits.
Please be advised that the information presented on TradingView is provided to Tradu (‘Company’, ‘we’) by a third-party provider (‘TFA Global Pte Ltd’). Please be reminded that you are solely responsible for the trading decisions on your account. There is a very high degree of risk involved in trading. Any information and/or content is intended entirely for research, educational and informational purposes only and does not constitute investment or consultation advice or investment strategy. The information is not tailored to the investment needs of any specific person and therefore does not involve a consideration of any of the investment objectives, financial situation or needs of any viewer that may receive it. Kindly also note that past performance is not a reliable indicator of future results. Actual results may differ materially from those anticipated in forward-looking or past performance statements. We assume no liability as to the accuracy or completeness of any of the information and/or content provided herein and the Company cannot be held responsible for any omission, mistake nor for any loss or damage including without limitation to any loss of profit which may arise from reliance on any information supplied by TFA Global Pte Ltd.
The speaker(s) is neither an employee, agent nor representative of Tradu and is therefore acting independently. The opinions given are their own, constitute general market commentary, and do not constitute the opinion or advice of Tradu or any form of personal or investment advice. Tradu neither endorses nor guarantees offerings of third-party speakers, nor is Tradu responsible for the content, veracity or opinions of third-party speakers, presenters or participants.

# USDJPY H4 MAJOR DEMAND WITH LIQUIDITY # USDJPY H4 Major Demand with Proper BSL & SSL , after LTF Conformation then Enter with Proper sl with Target

Bullish bounce off overlap support?USD/JPY is falling towards the support level which is an overlap support and could bounce from this level to our take profit.
Entry: 142.12
Why we like it:
There is an overlap support level.
Stop loss: 140.16
Why we like it:
There is a pullback support level that is slightly above the 145% Fibonacci extension.
Take profit: 144.58
Why we lik eit:
There is a pullback resistance that aligns with the 38.2% Fibonacci retracement.
Enjoying your TradingView experience? Review us!
Please be advised that the information presented on TradingView is provided to Vantage (‘Vantage Global Limited’, ‘we’) by a third-party provider (‘Everest Fortune Group’). Please be reminded that you are solely responsible for the trading decisions on your account. There is a very high degree of risk involved in trading. Any information and/or content is intended entirely for research, educational and informational purposes only and does not constitute investment or consultation advice or investment strategy. The information is not tailored to the investment needs of any specific person and therefore does not involve a consideration of any of the investment objectives, financial situation or needs of any viewer that may receive it. Kindly also note that past performance is not a reliable indicator of future results. Actual results may differ materially from those anticipated in forward-looking or past performance statements. We assume no liability as to the accuracy or completeness of any of the information and/or content provided herein and the Company cannot be held responsible for any omission, mistake nor for any loss or damage including without limitation to any loss of profit which may arise from reliance on any information supplied by Everest Fortune Group.

Falling towards pullback support?USD/JPY is falling towards the pivot which is a pullback support and could bounce to the 1st resistance which acts as a pullback resistance.
Pivot: 140.70
1st Support: 137.16
1st Resistance: 145.54
Risk Warning:
Trading Forex and CFDs carries a high level of risk to your capital and you should only trade with money you can afford to lose. Trading Forex and CFDs may not be suitable for all investors, so please ensure that you fully understand the risks involved and seek independent advice if necessary.
Disclaimer:
The above opinions given constitute general market commentary, and do not constitute the opinion or advice of IC Markets or any form of personal or investment advice.
Any opinions, news, research, analyses, prices, other information, or links to third-party sites contained on this website are provided on an "as-is" basis, are intended only to be informative, is not an advice nor a recommendation, nor research, or a record of our trading prices, or an offer of, or solicitation for a transaction in any financial instrument and thus should not be treated as such. The information provided does not involve any specific investment objectives, financial situation and needs of any specific person who may receive it. Please be aware, that past performance is not a reliable indicator of future performance and/or results. Past Performance or Forward-looking scenarios based upon the reasonable beliefs of the third-party provider are not a guarantee of future performance. Actual results may differ materially from those anticipated in forward-looking or past performance statements. IC Markets makes no representation or warranty and assumes no liability as to the accuracy or completeness of the information provided, nor any loss arising from any investment based on a recommendation, forecast or any information supplied by any third-party.

USDJPY: A bigger decline is expected in a broader pictureUSDJPY: A bigger decline is expected in a broader picture
On the USDJPY chart I have outlined some strong technical elements:
Key target levels are found near 141,200 and 138,000
Downward momentum is expected to increase, driven by macroeconomic factors related to Trump’s tariffs and the BOJ, which is also facing potential problems and may increase its bond-buying program.
Another topic is related to the BOJ’s interest rates. With the increase in CPI data reported last week, the chances of the BOJ raising rates again are increasing.
The price is currently around 142.55, and a break below the first support area found on the left side of the chart could signal further declines.
You may find more details in the chart!
Thank you and Good Luck!
❤️PS: Please support with a like or comment if you find this analysis useful for your trading day❤️
Disclosure: I am part of Trade Nation's Influencer program and receive a monthly fee for using their TradingView charts in my analysis.

CHECK USDJPY SIGNAL READ CAPTAINusdjpy Trading signals (UsdjpyBuy zone)
TRADE
Entry point 👉 (142.300)
Take profit¹ 142.600
Take profit² 143.000
Take profit³ 143.400
Stop loss ❌141.900
Follow The money Menagment

usdjpymy over all bias is bull. but since last week price keep seeking lower price. waiting patiently to buy at very cheapest price. other factors will be put into consideration as well

USD/JPY Breakdown Incoming? 4 Powerful Signals Say 'Short Now'! The current landscape for USD/JPY signals a potential bearish reversal, supported by a convergence of technical, sentiment, and fundamental factors. Following a strong bullish leg from the 140 zone, price has reached the 146–147 resistance area, where it is currently being rejected. Price action has broken below the ascending channel that began in early April, suggesting a loss of bullish momentum and a possible transition into a deeper corrective phase.
From the COT (Commitment of Traders) perspective, the picture aligns with this bias. Non-commercials on the USD Index (DXY) are aggressively reducing exposure on both long and short sides, resulting in a net position of -615 contracts. This reflects growing uncertainty or waning confidence in dollar strength as U.S. monetary policy enters a potential pivot zone. Meanwhile, JPY futures still show a strong net long position by speculators (194,226 long vs. 21,958 short), even after a significant long liquidation of over 9,700 contracts. Commercial traders, typically positioned opposite to trend, remain heavily net short—hinting at possible strength ahead for the yen.
Seasonality adds further weight: May is historically a bearish month for USD/JPY. The 5, 10, and 15-year averages all show negative returns, with a structural downside tendency, especially in the final two weeks of the month.
Retail sentiment further supports this case. Data shows that 68% of retail traders are currently long USD/JPY. Interpreting this through a contrarian lens, it implies growing downside potential, as over-positioned retail traders often precede a move in the opposite direction.
Lastly, technical analysis (daily timeframe) reinforces the bearish scenario. The break below the bullish channel invalidates the recent structure, and the RSI is trending lower with plenty of room to move down before hitting oversold levels. Immediate support zones lie between 143 and 141. A potential retest of 145.80–146.30 would offer a favorable entry for fresh shorts in line with a developing bearish swing structure.
🎯 Conclusion
All elements—technical structure, COT data, seasonal weakness, and retail sentiment—are converging toward a bearish USD/JPY outlook. Institutional traders are cutting dollar longs, seasonal forces are negative, and retail positioning is overly long. With price structure now broken, the bearish bias is well supported, targeting 143 first and 141 as a deeper move, pending price action confirmation.

USDJPY Just Flipped — Liquidity Has a New Target🧠 Smart Money Breakdown: USDJPY | 15-Min Chart
We’ve got a textbook bearish reversal setup forming right now on USDJPY, and Smart Money traders are paying close attention.
🔄 1. Change of Character (ChoCh)
The first key sign was a ChoCh, which flipped the internal structure from bullish to bearish. This signals a potential shift in market control from buyers to sellers — Smart Money often initiates big moves after such a flip.
🟫 2. Bearish Order Block + Rejection Wick
Price pulled back right into a fresh bearish Order Block (OB) around the 148.056–148.337 zone. This OB lines up perfectly with the upper trendline + internal liquidity area.
Price is now rejecting hard from this level, signaling Smart Money sell-side pressure.
🕳 3. Fair Value Gap (FVG) Below
Below current price lies a clean FVG, serving as a magnet for price. Smart Money often targets these imbalances to rebalance the market.
The gap extends from around 146.200 to 147.400 — with Sell Side Liquidity resting right below at 145.872. That’s the likely kill zone. 💀
📐 4. Trade Setup (R:R Approx. 3.5:1)
🔼 Entry Zone: 147.980–148.050 (inside OB)
❌ Stop Loss: Just above OB: 148.400
✅ Target: 145.872 (Sell Side Liquidity sweep)
Perfect for swing traders and intraday SMC setups.
📊 Strategy:
Look for:
Bearish engulfing candle confirmation
Break of minor internal low (lower TF BOS)
Entry on OB rejection with tight SL above high
Bonus: Enter partials on FVG fill, hold runner to liquidity.
📎 Confluences:
✅ ChoCh confirmed
✅ Bearish OB
✅ Price rejecting from premium zone
✅ FVG below = imbalance magnet
✅ Sell-side liquidity clearly marked
⚠️ Risk Reminder:
Let price show intent before jumping in
Use confirmation, not assumption
Trade what the chart says, not what you hope
🔚 Summary:
Smart Money has flipped the script. With a strong ChoCh, OB rejection, and an FVG inviting price lower, this setup screams bearish continuation.
🔻 Expecting a clean run into liquidity. Stay sharp. 🧠
💬 Drop a “💀” if you’re eyeing the same setup.
📈 Follow for more clean SMC plays weekly.

USDJPY: Smart Money Reloads at Demand ZoneThis pair is showing some next-level institutional behavior right now, and the play is looking ripe for a long position — here's why:
📉 Previous Sell-Off = Liquidity Engineering
USDJPY had a strong downward leg creating a perfect internal liquidity pool, then took out that internal high (marked by triple liquidity tags 💵💵💵) just above a descending channel. That was your classic fakeout / inducement trap.
🎯 Price Tapped Into a Fresh Bullish Order Block
Price dipped deep into a refined OB (purple zone) aligned with the lower channel and then wicked hard out of it. That move created a bullish rejection wick, confirming buyer interest from smart money.
You can see price forming a micro HL structure at the edge of the demand zone — premium setup for continuation.
📍 Key Confluences:
✅ OB sits right around the mid-channel EQ
✅ Demand zone is built on top of a strong low (142.680 area)
✅ Strong risk-to-reward setup aiming for weak high and buy-side liquidity
✅ Rejection aligns with a bullish change of character (ChoCh) from lower timeframes
💥 Targets:
🔹 TP1 - Weak High at 144.400
🔹 TP2 - Buy Side Liquidity sweep at 145.514
🔹 Extended Target - Ride it to channel top / HTF imbalance fill above 146.000
📈 Trade Idea Summary:
Entry Zone: Anywhere in the OB range from 143.554 to 143.189
Stop Loss: Below 143.000 or the strong low
Risk-Reward: Easily 1:5+ if targeting full range move
🚨 Why It Matters:
This chart screams smart money accumulation at the bottom of a channel. Retail traders might still be shorting the retracement — but smart money is loading longs while price consolidates at demand.
If price clears the weak high, it could ignite a bullish rally into the upper supply zones where liquidity lies.
💬 Comment "UJ MOVE" if you're entering this sniper long!
🔁 Repost this if you’re tracking it with your team!

USDJPY 4HFollowing last week’s analysis , the 143.82 target was reached and the bearish trend is continuing.
However, a pullback up to 144.5 is possible, which may offer a better price for selling.
Next downside targets are:
141.83
140.32
139.00
And further down: 136.15, where we expect a strong bullish reaction and a possible buy opportunity.
Longer-term targets like 130.00 and even below 124.40 are also in the picture, but we move step by step.
The analysis will be updated with new data.

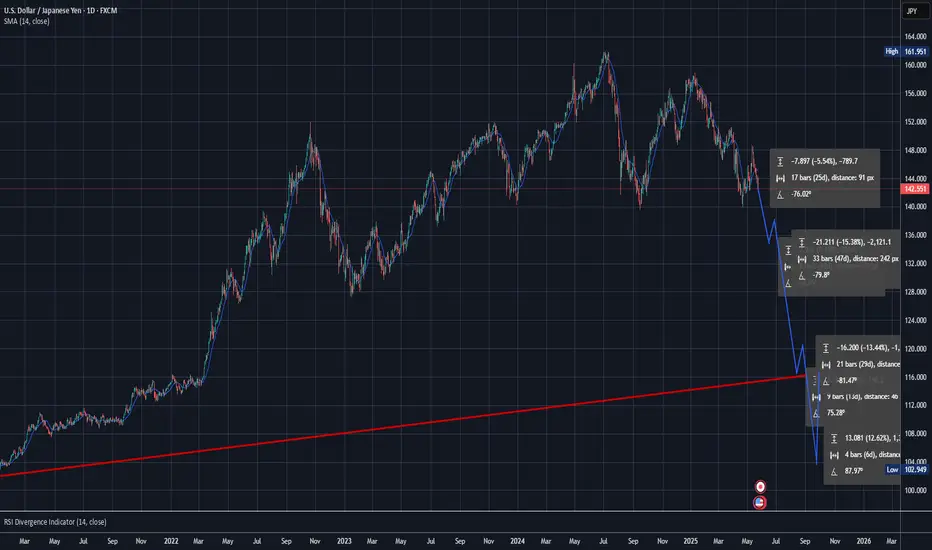
USDJPY SHORTLooking at USDJPY i am seeing the possibility for some price correction near the support zone that was created in 2021. With the Dollar index showing weakness around this time, it is very likely we will see the USDJPY pair trading under $100 again soon.
#usdjpy
USD-JPY Free Signal For Monday! Buy!
Hello,Traders!
USD-JPY is about to retest
A horizontal support level
Around 142.000 and after
The retest on Monday we
Will be able to go long on
The pair with the Take
Profit of 143.331 and the
Stop Loss of 141.939
Buy!
Comment and subscribe to help us grow!
Check out other forecasts below too!
Disclosure: I am part of Trade Nation's Influencer program and receive a monthly fee for using their TradingView charts in my analysis.


USD/JPY "The Gopher" Forex Bank Bullish Heist Plan (Swing Trade)🌟Hi! Hola! Ola! Bonjour! Hallo! Marhaba!🌟
Dear Money Makers & Robbers, 🤑 💰💸✈️
Based on 🔥Thief Trading style technical and fundamental analysis🔥, here is our master plan to heist the USD/JPY "The Gopher" Forex Market. Please adhere to the strategy I've outlined in the chart, which emphasizes long entry. Our aim is to escape near the high-risk Yellow MA Zone. Risky level, overbought market, consolidation, trend reversal, trap at the level where traders and bearish robbers are stronger. 🏆💸"Take profit and treat yourself, traders. You deserve it!💪🏆🎉
Entry 📈 : The vault is wide open! Swipe the Bullish loot at any price - the heist is on!
Place buy limit orders most recent or swing, low level for Pullback entries.
Stop Loss 🛑:
📍 Thief SL placed at the recent/swing low level Using the 4H timeframe (138.500) Day/Swing trade basis.
📍 SL is based on your risk of the trade, lot size and how many multiple orders you have to take.
🏴☠️Target 🎯: 147.500 (or) Escape Before the Target
🧲Scalpers, take note 👀 : only scalp on the Long side. If you have a lot of money, you can go straight away; if not, you can join swing traders and carry out the robbery plan. Use trailing SL to safeguard your money 💰.
💰💵💸USD/JPY "The Ninja" Forex Money Heist Plan is currently experiencing a bullishness,., driven by several key factors. .☝☝☝
📰🗞️Get & Read the Fundamental, Macro, COT Report, Quantitative Analysis, Sentimental Outlook, Intermarket Analysis, Future trend targets & Overall Score... go ahead to check 👉👉👉🔗🔗🌎🌏🗺
⚠️Trading Alert : News Releases and Position Management 📰 🗞️ 🚫🚏
As a reminder, news releases can have a significant impact on market prices and volatility. To minimize potential losses and protect your running positions,
we recommend the following:
Avoid taking new trades during news releases
Use trailing stop-loss orders to protect your running positions and lock in profits
💖Supporting our robbery plan 💥Hit the Boost Button💥 will enable us to effortlessly make and steal money 💰💵. Boost the strength of our robbery team. Every day in this market make money with ease by using the Thief Trading Style.🏆💪🤝❤️🎉🚀
I'll see you soon with another heist plan, so stay tuned 🤑🐱👤🤗🤩

USDJPY Short Setup – Bearish Breakout WatchBias: ✅ Strong Sell
Timeframe: 4H
Pair: USDJPY
Week: 26–30 May 2025
🔍 Technical Setup:
USDJPY is sitting on a critical support zone around 142.55. A decisive break and 4H close below this level would confirm a bearish continuation.
Entry: Break below 142.55
Stop Loss: Above resistance at 142.80
Take Profit: Major support around 140.05
Risk-Reward Ratio: ~4R
Structure: Lower highs, pressure on demand – momentum building
🧠 Macro Confluence:
📉 USD Weakness: Dovish Fed, worsening macro (Investogenie Score 1.8 ↓)
💴 JPY Strength: Seasonal bias, bullish COT positioning, risk-off sentiment
🧾 COT: JPY net long positions at 92% RSI
📊 Conditional Scores: JPY ↑, USD ↓
⚠️ Risk Sentiment: VIX 22.68 – risk-off favors JPY
⚠️ Risk Notes:
Wait for confirmation candle before entry
Watch FOMC + GDP (USD) for volatility spikes
Consider scaling in on retest of broken support
📌 Let the level break before jumping in. Precision matters.
Share your thoughts or charts below 👇

Chart Summary for USD/JPY.Chart Summary
• Current Price: 142.550 (shown in green on the chart).
• Trade Direction: The setup is for a sell (short) trade.
• Entry Point: Around 142.536, confirmed by patterns like “Inside Bar Long Entry” (InsBarLE).
• Profit Target: 140.773
• This is where the trader expects the price to fall.
• A large blue arrow on the chart shows the expected move.
• The drop is about 1.763 points or 1.24%.
• Target date: May 27, 2025, around 7:15 AM.
• Stop Loss: Set around 142.884
• This is the maximum price the trader is willing to let the trade go against them.
• Risk/Reward: The potential reward is larger than the risk, which makes this a smart trade setup.
⸻
Technical Tools Used:
• Fibonacci Levels:
• Key levels shown are 0.5 (143.565), 0.618 (143.284), and 1 (142.374).
• These levels help spot where price may reverse or pause.
• Trendline:
• A downward line on the chart shows the market is moving lower.
• Pattern Indicators:
• Markers like “InsBarSE” (Inside Bar Sell Entry) and “InsBarLE” (Inside Bar Long Entry) help decide when to enter or exit trades.
Summary:
This is a sell trade setup. The plan is based on:
• A break below the 142.374 support level.
• Support from price patterns and indicators.
• The goal is to reach the price of 140.773 in about 3 and a half days.

USDJPY: Long Signal Explained
USDJPY
- Classic bullish setup
- Our team expects bullish continuation
SUGGESTED TRADE:
Swing Trade
Long USDJPY
Entry Point - 142.56
Stop Loss - 141.39
Take Profit - 144.82
Our Risk - 1%
Start protection of your profits from lower levels
Disclosure: I am part of Trade Nation's Influencer program and receive a monthly fee for using their TradingView charts in my analysis.
❤️ Please, support our work with like & comment! ❤️

YEN BOTTOMING Look for ABC up back to 144/145The us $ yen trade should now be setup to rally But I can allow one more minor low into,786 But we should begin the final rally up into June 9 to the 16th for support in the carry trade and in SP500 into a seasonal cycle peak . As I have posted the long term chart of a massive Head n shoulder TOP in yen trade . Best of trades WAVETIMER

USD/JPY "The Ninja" Forex Bank Money Heist (Bullish)🌟Hi! Hola! Ola! Bonjour! Hallo! Marhaba!🌟
Dear Money Makers & Robbers, 🤑 💰💸✈️
Based on 🔥Thief Trading style technical and fundamental analysis🔥, here is our master plan to heist the USD/JPY "The Ninja" Forex Market Heist. Please adhere to the strategy I've outlined in the chart, which emphasizes long entry. Our aim is to escape near the high-risk YELLOW MA Zone. It's a Risky level, overbought market, consolidation, trend reversal, trap at the level where traders and bearish robbers are stronger. 🏆💸"Take profit and treat yourself, traders. You deserve it!💪🏆🎉
Entry 📈 : "The vault is wide open! Swipe the Bullish loot at any price - the heist is on!
however I advise to Place buy limit orders within a 15 or 30 minute timeframe most recent or swing, low or high level. I Highly recommended you to put alert in your chart.
Stop Loss 🛑:
Thief SL placed at the Nearest / Swing low level Using the 1H timeframe (143.000) Day trade basis.
SL is based on your risk of the trade, lot size and how many multiple orders you have to take.
🏴☠️Target 🎯: 147.000
💰💵💸USD/JPY "The Ninja" Forex Money Heist Plan is currently experiencing a bullishness,., driven by several key factors. .☝☝☝
📰🗞️Get & Read the Fundamental, Macro, COT Report, Quantitative Analysis, Sentimental Outlook, Intermarket Analysis, Future trend targets.... go ahead to check 👉👉👉🔗🔗🌎🌏🗺
⚠️Trading Alert : News Releases and Position Management 📰🗞️🚫🚏
As a reminder, news releases can have a significant impact on market prices and volatility. To minimize potential losses and protect your running positions,
we recommend the following:
Avoid taking new trades during news releases
Use trailing stop-loss orders to protect your running positions and lock in profits
💖Supporting our robbery plan 💥Hit the Boost Button💥 will enable us to effortlessly make and steal money 💰💵. Boost the strength of our robbery team. Every day in this market make money with ease by using the Thief Trading Style.🏆💪🤝❤️🎉🚀
I'll see you soon with another heist plan, so stay tuned 🤑🐱👤🤗🤩
