Usdjpy SCENARIO 19/05/2025English : According to our analysis, we anticipate a bearish scenario.
Morocan Darija : kanchofo d'apres l'analyse dyalna antsanaw hboot
ATENTION : I only share my ideas, not signals
USDJPY_SPT trade ideas

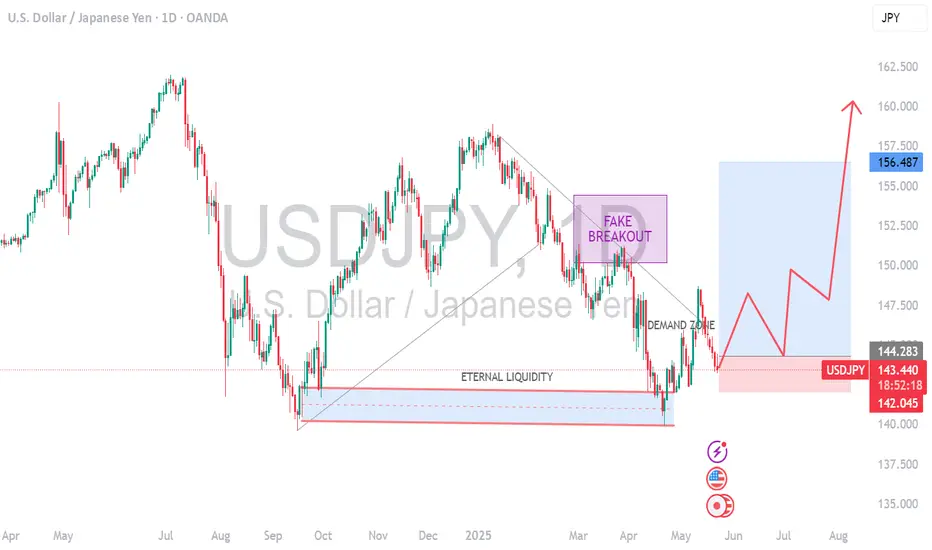
USDJPY UPDATEUSDJPY has been and is currently trading between $160 and $140 since December 2023.
Optimal buy entry will be at ~$140. Sell entries will be at ~$160.
The buy entry at $140 is justified by the apparent demand at that zone for major buyers. Technically, this is corroborated by the consistent Yellow line on the TDI indicator (1hr TF) trending beneath the 30 line level each time price reaches that level; ~$140. Additionally, validation of a continued upward trend is supported with the recovery of the US Dollar since Pres. Trump has expressed confidence that he is close to making trade deals with a number of trading partners.
ORIGINAL ENTRY PRICE = $140
Extra Buy Entries as of 5.21.2025 = $142 and 1hr tf closure above $144
TP = $155
SL = $137.30

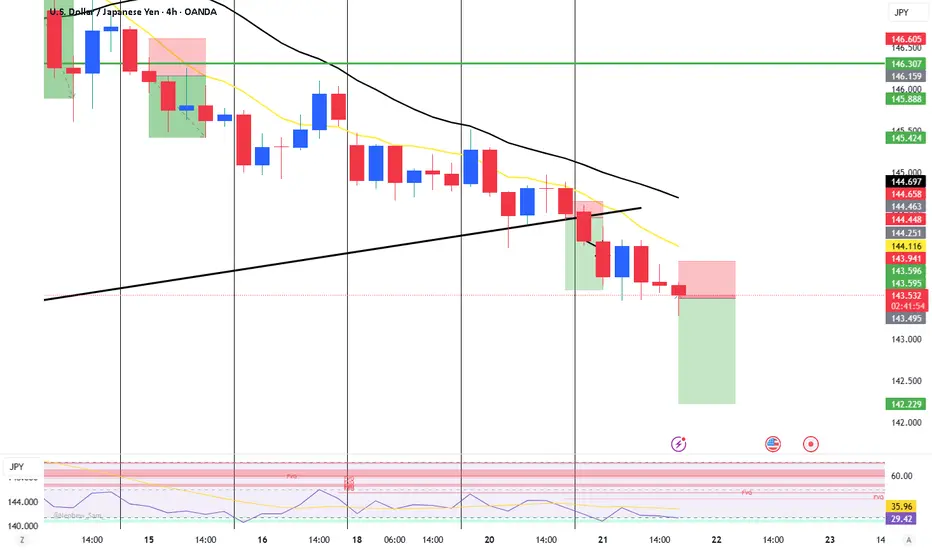
Major Trend Change Ahead !We've been in a prolonged bearish trend, and now we've finally reached a major key level that could potentially signal a trend reversal.
On the 4H timeframe, we're waiting for a retest of the order block to confirm the level's validity.
On the 1H timeframe, we're looking for a Change of Character (ChoCH) in the macro structure to identify the best trade opportunity.

JPY Hits 2-Week High as Dollar WeakensThe Japanese yen strengthened to around 143 per dollar on Thursday, its highest in over two weeks, as concerns over the U.S. fiscal outlook pressured the dollar. Fears that Trump’s proposed tax cuts could add over $3 trillion to U.S. debt weighed on investor confidence.
Japan’s Finance Minister Kato said he did not discuss currency levels with Treasury Secretary Bessent at the G7 summit.
Domestically, core machinery orders surged 13% in March, beating expectations of a 1.6% drop, while May PMI data showed continued weakness in both manufacturing and services.

USD/JPY H1 | Bearish downtrend to extend further?USD/JPY is rising towards an overlap resistance and could potentially reverse off this level to drop lower.
Sell entry is at 143.50 which is an overlap resistance.
Stop loss is at 144.50 which is a level that sits above the 23.6% Fibonacci retracement and a swing-high resistance.
Take profit is at 142.35 which is a swing-low support.
High Risk Investment Warning
Trading Forex/CFDs on margin carries a high level of risk and may not be suitable for all investors. Leverage can work against you.
Stratos Markets Limited (tradu.com ):
CFDs are complex instruments and come with a high risk of losing money rapidly due to leverage. 63% of retail investor accounts lose money when trading CFDs with this provider. You should consider whether you understand how CFDs work and whether you can afford to take the high risk of losing your money.
Stratos Europe Ltd (tradu.com ):
CFDs are complex instruments and come with a high risk of losing money rapidly due to leverage. 63% of retail investor accounts lose money when trading CFDs with this provider. You should consider whether you understand how CFDs work and whether you can afford to take the high risk of losing your money.
Stratos Global LLC (tradu.com ):
Losses can exceed deposits.
Please be advised that the information presented on TradingView is provided to Tradu (‘Company’, ‘we’) by a third-party provider (‘TFA Global Pte Ltd’). Please be reminded that you are solely responsible for the trading decisions on your account. There is a very high degree of risk involved in trading. Any information and/or content is intended entirely for research, educational and informational purposes only and does not constitute investment or consultation advice or investment strategy. The information is not tailored to the investment needs of any specific person and therefore does not involve a consideration of any of the investment objectives, financial situation or needs of any viewer that may receive it. Kindly also note that past performance is not a reliable indicator of future results. Actual results may differ materially from those anticipated in forward-looking or past performance statements. We assume no liability as to the accuracy or completeness of any of the information and/or content provided herein and the Company cannot be held responsible for any omission, mistake nor for any loss or damage including without limitation to any loss of profit which may arise from reliance on any information supplied by TFA Global Pte Ltd.
The speaker(s) is neither an employee, agent nor representative of Tradu and is therefore acting independently. The opinions given are their own, constitute general market commentary, and do not constitute the opinion or advice of Tradu or any form of personal or investment advice. Tradu neither endorses nor guarantees offerings of third-party speakers, nor is Tradu responsible for the content, veracity or opinions of third-party speakers, presenters or participants.

USDJPYTHE 10 year Japanese's bond yield opens on bullish note while the 10 year us government bond yield dropping.
the JB10y opens on 1.546% and traded into London session at 1.587% before touching the supply roof ,yen is strong and dollar pull back will continue in a short term.
the US10Y open on bearish foot 4.607% and dropped into 4.572% London session reporting.
the yen dollar index demand and supply strategy disregarded as yield overflow keep yen on safe haven demand .
JB10 and yen exerting the same force across all pairs especially on united state dollar.
the pressure will continue.

USDJPY BULLISH OR BEARISH DETAILED ANALYSISUSDJPY is trading around the 143.00 level, and we’re now closely eyeing a potential breakdown. After a prolonged uptrend driven by policy divergence between the Fed and the BoJ, the pair appears to be losing bullish momentum. Structurally, the pair has formed a lower high, and sellers are starting to step in near resistance. A clean break below the 142.00–141.50 zone could open the path toward my downside target at 135.00.
On the fundamental side, recent data suggests a shift in sentiment. The US dollar is under pressure as markets increasingly price in a Fed pause or even rate cuts by the end of the year, following soft retail sales and labor market figures. Meanwhile, the Japanese yen is gaining ground amid rising speculation that the Bank of Japan could adjust its ultra-loose policy sooner than expected. The BoJ’s recent bond purchase tapering and Governor Ueda's hints at tightening are starting to shift market flows back toward the yen.
Technically, USDJPY is at a critical juncture. The pair is testing a key trendline support that has held for months, but price action is showing signs of exhaustion. Volume is thinning on the rallies, and bearish divergence is visible on multiple indicators, including RSI and MACD. If the pair breaks below the current structure, we could see accelerated downside action toward the 135.00 target, which aligns with previous consolidation zones and fib retracement levels.
This setup offers a strong short opportunity with clear invalidation and solid risk-to-reward potential. The macro narrative is shifting in favor of the yen, and technicals are lining up with this view. I’ll be watching the coming sessions for confirmation of breakdown and potential entries. This could be the start of a broader correction after a strong bullish cycle.

Fundamental Market Analysis for May 22, 2025 USDJPYEvents to pay attention to today:
15:30 EET. USD - Unemployment Claims
16:45 EET. USD - Services PMI
USDJPY:
The Japanese Yen (JPY) demonstrated resilience by rebounding from an early decline during the Asian trading session. This recovery was largely influenced by positive machinery orders data from Japan, which effectively quashed recession fears and significantly bolstered expectations of an economic recovery. This occurred in anticipation of the Bank of Japan (BoJ) potentially raising interest rates again in 2025, which would have been a positive development for the JPY. Furthermore, flight to safety is identified as a contributing factor to the strengthening of the yen.
The proposed tax bill introduced by US President Donald Trump has led to concerns regarding the financial stability of the US government. This, in addition to the resurgence of tensions between the US and China, is exerting downward pressure on global risk sentiment and prompting investors to seek refuge in traditional safe haven assets, including the yen. This, coupled with the prevailing US Dollar (USD) selling bias, has led to the USD/JPY pair reaching a two-week low, approaching the round figure of 143.00 on Thursday.
Trade recommendation: SELL 143.100, SL 143.700, TP 142.350

UJ Could Tumble Back To 140 If Bears Take Expanding RangeToday FX:USDJPY Sellers make a Breakout of the Rising Support of the Expanding Range it's been trading in since the Low that started the range back on April 22nd.
An Expanding Range is typically considered a Continuation Pattern suggesting that if Sellers can hold price under the Rising Support, we can suspect JPY to overcome USD in this pair pulling price down continuing the Downtrend it was in prior to entering the pattern.
Once the Breakout of Consolidation is Validated, a Breakout & Retest of the Rising Support could deliver potential Short Opportunities to take price down to the Low of the Range.
Fundamentally, there is a lot of worry about the fall out of Tariff Talks with important trade partners with the 90-Day grace period soon coming to an end, weakening labor market potentially signaling "Stagflation" and additionally, it is suspected that Trump's Tax Cut Bill could add $3 - $5 Trillion to the $36.2 Trillion debt the US is already suffering from, further harming the Dollar.
-https://www.tradingview.com/news/reuters.com,2025:newsml_L1N3RT018:0-dollar-on-defensive-as-traders-eye-trump-tax-bill-g7-currency-talks/
-https://www.tradingview.com/news/te_news:459470:0-dollar-extends-losses/

USDJPY Long Setup: Triple Confluence Zone Locked InSmart money traders love one thing more than anything — confluence. This BTCUSD setup hits all the marks:
📈 Structure Breakdown:
Market breaks structure to the upside ✅
Impulsive bullish leg breaks prior high ✅
Pullback into 61.8% golden zone + OB ✅
Rejection wick = perfect entry confirmation ✅
This is a high-probability continuation setup after BTC made a clear bullish BOS (Break of Structure) on the M30 timeframe.
🟦 Order Block Zone:
OB Range:
Top: ~106,989
Bottom: ~106,759
This OB was the last down candle before the big bullish impulse that broke structure. Price returned to mitigate here, then instantly rejected = Smart Money entry confirmed 🔒
🧮 Fibonacci Levels:
61.8%: Sliced right into it
70.5% – 79%: Deeper liquidity zone just below
The entry wick taps right into the sweet OB/Fib confluence zone and launches 🚀. It’s giving sniper precision with a low drawdown entry.
🎯 Trade Parameters:
Entry: ~106,759
SL: Below the OB zone
TP: 108,022 (previous high)
That’s an RRR of around 3.5–4.0x — a clean asymmetric play, just the way smart money wants it.
🔍 Confirmation Factors:
Bullish BOS on M30
Price returns to OB zone + golden ratio
Clean rejection candle with demand absorption
No internal structure break = bullish narrative still valid
🧠 Key Lesson:
“When OB meets Fibonacci, don’t ask why. Load up — the market just told you why.”
Let setups like this come to you. No chasing, no emotions. Let the algo-driven footprints guide you to the money.
📈 Missed this one? Save it for your playbook — this is how high-probability trades are built.
Drop a 💰 if you caught the same move!

USDJPY - Potential Sell (Swing to long term Trade)Hi traders,
This is a repost from my last analysis.
We are still focusing to SELL CMCMARKETS:USDJPY
Price Action Analysis:
Weekly or higher Chart: Price seems to be slowing down and showing signs of turning to the downside. Buyers have tried several times to push up from the 140.0 level, but each time, sellers responded with more selling. It feels like sellers are still holding a lot of CMCMARKETS:USDJPY and are trying to offload it.
Daily Chart: Price has been making new highs, which is actually a good sign for a potential sell-off. We’re watching to see if the daily chart shows signs of giving up. However, price is still in buyer territory, so we’re on standby for now.
Lower time frame Chart: Timing for Entry
Good Luck.
"The most important investment you can make is in yourself." Warren Buffet

USDJPY- IS it a beginning of major bulish trend nowthe USD/JPY pair is currently in a major bullish trend, driven by several key factors:
1. Interest Rate Differentials: The U.S. Federal Reserve maintains higher interest rates compared to the Bank of Japan, attracting capital flows into the U.S. dollar and away from the yen.
2. Dovish Bank of Japan: Despite global tightening, the BOJ remains cautious about raising rates or ending yield curve control, weakening the yen further.
3. Robust U.S. Economic Data: Strong economic indicators from the U.S. (such as inflation, jobs, and GDP growth) continue to support expectations of prolonged higher rates, boosting the dollar.
USDJPY Buy analysis/ideaThis trade is based on the 4-hour and 1-hour timeframes and executed using Supply and Demand Trading and trend Formation. The video provides a complete explanation!

Falling towards pullback support?USDJPY is falling towards the pivot which is a pullback support and could bounce to the 1st resistance.
Pivot: 142.400
1st Support: 140.92
1st Resistance: 144.77
Risk Warning:
Trading Forex and CFDs carries a high level of risk to your capital and you should only trade with money you can afford to lose. Trading Forex and CFDs may not be suitable for all investors, so please ensure that you fully understand the risks involved and seek independent advice if necessary.
Disclaimer:
The above opinions given constitute general market commentary, and do not constitute the opinion or advice of IC Markets or any form of personal or investment advice.
Any opinions, news, research, analyses, prices, other information, or links to third-party sites contained on this website are provided on an "as-is" basis, are intended only to be informative, is not an advice nor a recommendation, nor research, or a record of our trading prices, or an offer of, or solicitation for a transaction in any financial instrument and thus should not be treated as such. The information provided does not involve any specific investment objectives, financial situation and needs of any specific person who may receive it. Please be aware, that past performance is not a reliable indicator of future performance and/or results. Past Performance or Forward-looking scenarios based upon the reasonable beliefs of the third-party provider are not a guarantee of future performance. Actual results may differ materially from those anticipated in forward-looking or past performance statements. IC Markets makes no representation or warranty and assumes no liability as to the accuracy or completeness of the information provided, nor any loss arising from any investment based on a recommendation, forecast or any information supplied by any third-party.

US$ _YEN at .618 ON NEWS stay clam The $USyen should have found support Today and on NEWS I think we will hold and start up again for under the two wave count Both are about to rally .best of trades WAVETIMER

USDJPY set go down much further. 1. Summary of Key Factors
-Factor Signal Impact on USD/JPY Notes
-US 20Y Bond Selloff Bearish USD 🔻 Drop Likely Suggests capital outflows from US
-Moody's Downgrade Bearish USD 🔻 Drop Likely Weakens USD confidence globally
-Japanese Portfolio Rebalancing Bullish JPY🔻 Drop Likely Reduced UST purchases = yen demand
-Technical Break of SMA & Support Bearish 🔻 Drop Likely Clean 50-day MA break = momentum shift
-Risk Sentiment (Safe-Haven Flows) Favors JPY 🔻 Drop Likely JPY tends to strengthen in uncertainty
-Upcoming Asian Session (Tokyo Open) Neutral–Bearish 🔻 May Continue Yen typically sees increased strength
Looking at all these factors we should expect a further drop.
USDJPY BULLISH IDEA🧱 Key Observations
Order Block (OB) Marked (Demand Zone):
A clearly marked bullish order block (OB) zone is highlighted in pink around the 139.883 low.
This zone likely represents institutional buying interest.
It was the origin of a strong bullish move that broke prior structure.
Price Action:
After a series of higher highs and higher lows, price has retraced significantly.
It's approaching the order block area again, potentially for a retest or liquidity grab.
Heikin Ashi Candles:
Recent candles are bearish, showing momentum to the downside.
However, these candles typically lag in reversals, so price may soon shift if it hits the OB zone.
Projected Move:
A large blue upward arrow is drawn, suggesting an anticipated bullish reversal from the OB zone with a potential move back to 148.647 (recent high).
📊 Technical Implication
Bullish Bias if price holds within or just above the OB zone.
Watch for bullish reversal signals (engulfing patterns, divergence, or break of minor structure).
If price breaks below 139.883 decisively, the bullish setup may be invalidated.
📌 Strategy Idea (Not Financial Advice):
Entry Zone: 140.000–139.900 (inside OB)
Stop Loss: Below 139.800
Target: ~148.500
Risk/Reward: Favorable if OB holds

USDJPY Bearish in the short term.The USD/JPY exchange rate extended its recent downward trend during the European session, falling for the third consecutive trading day and marking the sixth decline in the past seven trading days. It hit a two-week low in the 143.45 area during the European morning session. Multiple factors have jointly driven the exchange rate lower, indicating that the sharp pullback from the monthly high of 148.65 reached last Monday may continue to extend. The Japanese yen is supported by market expectations that the Bank of Japan (BOJ) will raise interest rates again and has gained additional momentum from the rebound in risk-aversion demand. In the short term, USD/JPY maintains a downward trend, with technical indicators showing that bears are in control. 142.210 will be a key support level; a break below this level could accelerate the decline toward the 139.887 area.
In the market, there are no absolutes, and neither upward nor downward trends are set in stone. Therefore, the ability to judge the balance between market gains and losses is your key to success. Let money become our loyal servant.

Buy USDJPY now, and thank me laterUSD JPY looking good for a buy from this support. Please follow me for more analysis.
I would advise to close half positions at 146.900.
thanks

USD/JPY – Dow Theory Trend Test | Tight SL StrategyPair: USD/JPY
Trend: Bearish (Confirmed Lower Highs & Lower Lows)
Trade Type: Sell Stop
Entry Price (EP): 143.365
Stop Loss (SL): 144.253
Take Profit 1 (TP1): 142.477 (1:1)
Take Profit 2 (TP2): 141.589 (1:2)
Lot Size: 0.16
Risk/Reward:
Trade 1: Risk $100 / Reward $100 (1:1)
Trade 2: Risk $100 / Reward $200 (1:2)
Total Risk: $200
Total Reward: $300
🔍 Trade Idea Based on Dow Theory:
According to Dow Theory, USD/JPY is in a confirmed downtrend, forming lower highs and lower lows. This setup captures a bearish continuation move if price breaks below the recent structure low.
The Sell Stop entry ensures we only enter the market if bearish momentum resumes. We are using a clear structure-based stop loss and logical take profit levels aligned with market flow.
✅ Strategy Logic:
Bearish Momentum: Trend is down — no guessing tops or bottoms
Breakout Entry: Sell Stop entry avoids false moves in choppy markets
Structure-Based SL/TP: Keeping trade clean and technical
Split Trade: One conservative TP, one extended for trend ride
📌 Note: This trade is designed to capture a breakout in alignment with the current downtrend. Using smart risk control and proper trade sizing makes this setup scalable.
#USDJPY #BearishTrend #DowTheory #PriceAction #ForexSetup #SmartTrading #BreakoutTrade #SellStop #RiskReward #ForexSignals #TechnicalTrading #ChartPatterns

Hello again to USDJPY(1H)I got profit two times in 24 hours ago from 1H USDJPY.How?!..I had put one of its analyses last day clearly.It was a hunt opportunity.OK still now we're waiting for a breakout.After a breakout we can show a new route to down or up


UJ Long potentialExpecting DXY to start a correction before heading futher down in the coming months.
Tight SL With a 1:5 RR
