USDJPY Technical Breakdown & Macro ContextThe USDJPY pair is showing clear signs of bearish momentum, both technically and fundamentally.
🔍 Technical Overview (H1 Chart):
USDJPY has broken below an expanding channel, as well as the 200-period moving average on the 4-hour chart. This dual confirmation of trend weakness suggests a high-probability downside continuation, with selling pressure accelerating.
This breakdown often signals a reversal or correction phase after a period of broad price expansion — a classic exhaustion pattern now materializing as sellers regain control.
💴 Macro & Bond Market Insight – Japan:
Adding to the technical setup, Japan’s latest 20-year government bond auction just recorded the weakest investor demand since 2012. (Source – Bloomberg)
Despite this, Reuters reports that market participants still expect the Bank of Japan to continue its monetary tightening path, potentially pushing long-term JGB yields higher — and boosting demand for the yen in the process.
When tightening expectations rise in Japan while the U.S. grapples with fiscal risk and softening yields, the interest rate differential narrative shifts, weakening USDJPY.
USDJPY_SPT trade ideas

USDJPY SHORT💥 TRADE IDEA - USD/JPY (SHORT)
🕰 15min + 1hr Confluence | NY Session Setup
📍 Entry: 144.114
🎯 TP: 143.586
🛑 SL: 144.237
📊 RR: ~1 : 4.3
🧱 Price reacted from 1hr supply zone + clean breakdown on 15min.
📉 Structure: Bearish trend continuation

The market will maintain its bearish guard.Risk Management Notes:
Risk only 1-2% of total capital on this trade
Signal valid for 3-5 trading days
Invalidation point: Price closing above 145.500 on 4H timeframe

USDJPY: Dear Traders,
Any Breaks over the current zone and over the red bearish trend line, is a sign of bullish moves till the next zone, 147.841.
On the other hand, any breaks below the zone and below the bullish green trend line is a sign of bearish moves till the 142.234.
Take care and have a good week.

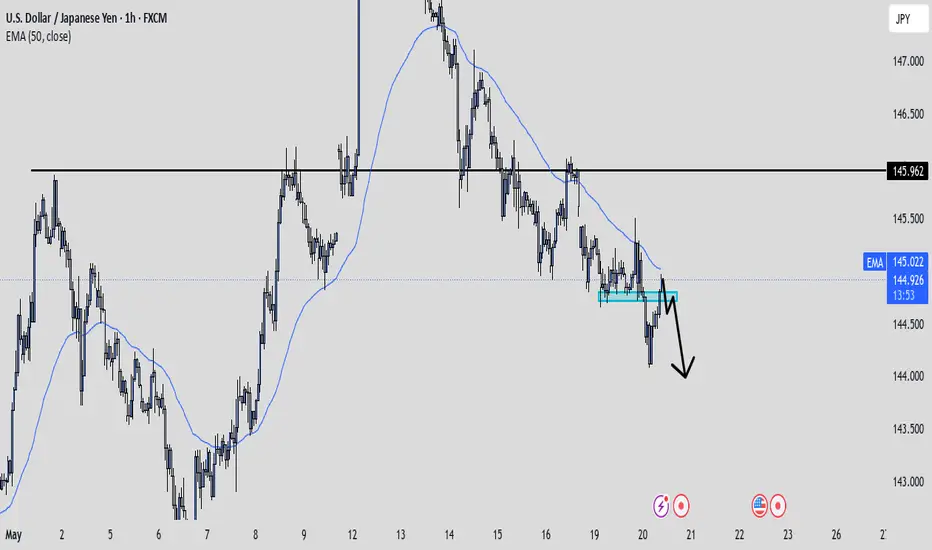
USDJPY Technical Analysis.This chart shows the USD/JPY (U.S. Dollar / Japanese Yen) currency pair on the 1-hour timeframe, with the following analysis:
1. Current Price: 144.530
2. Trend Outlook: The analysis suggests a bearish scenario is likely.
3. Price Action:
The price has been consolidating below resistance.
The chart outlines a potential bearish rejection from the resistance zone.
4. Stop Loss (SL): Marked above the current price action, above the recent highs — a safety level in case price reverses and breaks upwards.
5. Target: The target is around 144.121, indicating a short position with a relatively small risk-to-reward range.
6. Scenarios:
Red path (bearish): Expected price to drop after failing to break above resistance.
Green path (invalidated scenario): If the price breaks above SL, the bearish setup becomes invalid.
This chart reflects a short trade setup, betting on a pullback or continuation of the downtrend. Let me know if you’d like help calculating position size, risk/reward ratio, or creating an alert system for this trade.

USDJPY Tap and Dump – Perfect Lower Timeframe ReversalSmart Money Scalpers, it’s time to eat 🍽️
USDJPY just played into a beautiful supply zone rejection on the 30-minute chart, with clean confluence from structure, trendlines, and OB reaction. Let’s break it down like a pro:
🧠 Market Structure Narrative:
🔻 Strong bearish momentum
🔹 Price created a clear lower low
🔹 Pullback into a premium zone = sniper short entry setup
You’re looking at textbook bearish order flow, with price rejecting hard from the 143.805 zone, which served as a high-risk institutional POI (Point of Interest).
🟥 Supply Zone / OB Zone:
📌 OB Range:
Top: 143.805
Bottom: 143.639
This red zone triggered the last bearish impulse and was just tapped and rejected with precision.
The reaction candle wick shows clear rejection = institutions likely mitigating and initiating shorts.
📐 Trendline Confluence:
You’ve got a perfect descending channel running down with clean touches on both trendlines.
Price bounced off the upper line → trendline + OB = double whammy setup 💥
🎯 Entry Plan:
Entry: 143.512
SL: 143.805 (above OB)
TP: 142.358 (next liquidity pocket)
This gives a juicy RRR of around 3.9–4x, depending on your exact fill.
🎯 Why This Works:
Price reacted to a clear OB
Inside a descending channel
Weak bullish push = no conviction
Favorable RRR = asymmetrical edge
Perfect combo of SMC + structure + execution = sniper-grade entry 🔫
🧠 Key Lesson:
“Let price come to you. Smart Money doesn’t chase — it traps and snaps.”
This is a trap sprung with surgical precision. Execution was key — and you nailed it.
🗣️ If this setup hit your radar too, drop a “🎯” in the comments
📌 Save this — these are the trades that build your bankroll over time.

Go Short!Based on chart pattern (Descending Triangle) and Elliott Wave analysis (Wave#3), a bearish wave is upcoming!
SL: 145.600
TP1: 143.990
TP2: 142.680

USDJPY is in our hands.We're coming in right now.We can enter from here and profit from the predicted downside move.
Since TP1 (143.500) is very close to being hit, be prepared to:
Close 50% of your position at TP1
Move your stop loss to breakeven (entry price) for the remaining position

USD/JPY🔹Symbol: USD/JPY
🔹Price: 145.271
🔹Stop loss: 143.769
🔹Take profit 1: 146.818
🔹Take profit 2: 148.203
🔹Take profit 3: 149.551
🔹Take profit 4: 150.814
Low risk: % 1.🟢
📊Check your chart before entering.
♦️Check before use to make sure there is no important news.

USDJPY 1HThe chart you've shared shows the USD/JPY currency pair on a 1-hour timeframe. Here's a quick analysis based on the image:
Key Observations:
1. Descending Channel: The price has been moving within a well-defined descending channel, marked by parallel trendlines.
2. Rejections:
Red arrows indicate resistance points where the price was rejected at the upper trendline.
Green arrows indicate support points where the price bounced from the lower trendline.
3. Breakout Expectation: The purple arrow suggests a bearish breakout is anticipated below the lower channel support, projecting a move toward the 142.000–141.500 range.
Interpretation:
The chartist expects a continuation of the downtrend if the price decisively breaks below the current support.
The pattern suggests that unless the price breaks above the upper resistance line, sellers remain in control.
If you’d like, I can help:
Identify key support/resistance zones numerically
Suggest entry/exit levels
Run a technical indicator-based analysis (if data is available)
Would you like help with any of these?

USDJPY InsightGreetings to all subscribers!
Please feel free to share your personal opinions in the comments. Don't forget to like and subscribe!
Key Points
- Regarding the ceasefire, Ukraine is calling for a summit while Russia is demanding a memorandum outlining the principles and timeline for resolution, leading to a stalemate.
- The Reserve Bank of Australia cut its benchmark interest rate by 25 basis points from 4.10% to 3.85%. Governor Michele Bullock revealed that a 50bp cut was also discussed during the monetary policy meeting.
- Concerns over the U.S. fiscal deficit have intensified, pushing Treasury yields higher, as the tax-cut-inclusive budget is unlikely to pass in this week’s plenary session due to political disagreements.
Key Economic Events This Week
+ May 21: UK April Consumer Price Index
+ May 22: U.S. May Manufacturing PMI, U.S. May Services PMI
+ May 23: Germany Q1 GDP
USDJPY Chart Analysis
The USDJPY surged near the 149 level but reversed direction and fell to the 144 level. However, with a support line forming around 144, the pair is expected to regain upward momentum from this point. If the rebound scenario plays out, a rise toward the 151 level is anticipated. That said, if the 144 level is broken, there is potential for a further drop to the 140 level, so this alternative scenario should also be considered.

USDJPY – Potential Reversal Setup from Key Demand Zone
After several days of consistent bearish momentum, price action on USDJPY has finally tapped into a well-defined demand zone just below 144.40 – an area previously tested with strong bullish reaction.
I’m now anticipating a potential **Change of Character (CHOCH)** as price forms a temporary floor. The rejection wick near 144.10 gives a hint of buyer interest, with confluence from a Fair Value Gap (FVG) and prior liquidity sweep.
📍 **Entry:** Around 144.38
📈 **Target Zones:**
→ First Target: 146.00 (structure retest)
→ Final Target: 148.66 (major liquidity pool and previous high)
❌ **Invalidation:** Break below 143.70
If this move plays out, we could be looking at a solid **Risk-to-Reward above 3:1**. Patience now is key – I’ll wait for a strong bullish engulfing to confirm momentum shift before scaling in.
🧠 *Note:* Fundamentals (Fed tone + JPY weakness) and macro sentiment could serve as accelerators.
---

Current USDJPY Long Position Analysis
Analysis & Reasoning
Bullish Reversal Zone
The price dropped and found a strong support around 144.30 - 144.35, shown by the sharp rejection wick and a V-shaped recovery.
This area likely served as a demand zone — where buyers stepped in aggressively.
Structure Break / Momentum Shift
After bottoming out, the price broke short-term lower highs, indicating a bullish shift in momentum.
The buy entry is likely placed after a pullback within this new bullish structure, trying to catch the next leg up.
Risk-Reward Setup
Stop loss is placed below recent swing lows to protect against a failed reversal.
Multiple Take Profit Targets are marked:
Target 1 is a conservative intra-day high.
Target 2 likely represents a key resistance or supply level.
Target 3 is the most ambitious, aiming for a full retracement to the prior high.
Volume/Confirmation (assumed)
Though not visible in the screenshot, this kind of trade would typically be backed by confirmation like a bullish engulfing candle, support zone, or even RSI divergence.
Summary of the Buy Setup:
> Reversal trade from a key support zone after a strong bearish move.
> Entry taken after initial bullish confirmation.
> Targets are structured to scale out profits at key resistance points.
> Solid risk-to-reward ratio and structure-aware setup.

Technical Analysis Report: Trading GBP/USDThis technical analysis report focuses on the GBP/USD currency pair, also known as "Cable," which represents the British pound against the US dollar. The report provides an overview of current market conditions, key technical indicators, and trading strategies based on general technical principles and recent market insights up to May 20, 2025. Since specific real-time price data for this date is not available, the analysis uses historical patterns, plausible price levels based on recent trends, and macroeconomic factors influencing GBP/USD. Traders should verify current price levels on their platforms.
1. Market Overview
The GBP/USD pair is influenced by monetary policies from the Bank of England (BoE) and the Federal Reserve (Fed), economic data (e.g., UK CPI, US Non-Farm Payrolls), and global risk sentiment. Key factors as of May 20, 2025,
include:
Bank of England Policy: The BoE's stance on interest rates (hawkish or dovish) impacts GBP strength. Persistent UK inflation could support GBP, while signs of economic slowdown may weaken it.
Federal Reserve Policy: Fed rate decisions and US economic data drive USD strength. A hawkish Fed could pressure GBP/USD downward, while a dovish stance may support a GBP rally.
Brexit and Geopolitical Factors: Ongoing UK-EU trade dynamics or geopolitical events may introduce volatility.
Recent Sentiment: Posts on X suggest GBP/USD has been range-bound in early 2025, with traders eyeing UK economic recovery versus US dollar strength.
2. Technical Analysis
The analysis focuses on the daily (D1) and 4-hour (H4) timeframes for GBP/USD, using common technical indicators and price levels derived from historical ranges (e.g., 2023-2024 data) and hypothetical levels for 2025.
Price Action and Trend Analysis
Long-Term Trend (Daily Timeframe):
GBP/USD has historically fluctuated between 1.2000 and 1.4000, with significant support around 1.2500 and resistance near 1.3500-1.3600 (based on 2023-2024 levels).
Recent X posts indicate GBP/USD may be consolidating in a range (e.g., 1.2600-1.3200) after volatility in 2024 driven by Fed and BoE policy divergence.
A breakout above 1.3200 could signal a bullish trend, while a drop below 1.2600 may indicate bearish momentum.
Short-Term Trend (H4 Timeframe):
Intraday price action may show choppy movements within the daily range, with volatility around economic releases (e.g., UK CPI, US FOMC).
Look for higher highs/higher lows (bullish) or lower highs/lower lows (bearish) to confirm short-term direction.
b. Key Support and Resistance Levels
Based on historical levels and Fibonacci retracement analysis (applied to a hypothetical 2024 high of 1.3400 and low of 1.2400):
Resistance:
1.3200: Recent swing high and psychological level.
1.3500: Strong historical resistance (2023-2024 highs).
Support:
1.2600: Psychological level and recent swing low.
1.2400: Major support zone from 2023-2024.
Fibonacci Levels:
38.2% retracement: ~1.2800
50% retracement: ~1.2900
61.8% retracement: ~1.3000
c. Technical Indicators
Moving Averages:
50-day and 200-day SMA: A bullish crossover (50-day above 200-day) signals upward momentum, while a bearish crossover indicates weakness.
Current setup: If GBP/USD is trading above both SMAs (e.g., ~1.2900), it suggests bullish bias; below both, bearish. Price near the 50-day SMA may act as dynamic support/resistance.
Relative Strength Index (RSI):
RSI on the daily chart: Readings above 70 (overbought) suggest a potential pullback; below 30 (oversold) indicates a possible bounce.
Current estimate: RSI near 50 suggests consolidation. Watch for divergences (e.g., price making higher highs but RSI lower highs) for reversal signals.
MACD:
Bullish signal: MACD line crossing above the signal line with a positive histogram.
Bearish signal: MACD line crossing below the signal line.
Current estimate: A flat MACD near the zero line aligns with range-bound price action.
Bollinger Bands:
Price near the upper band (~1.3200) signals potential overbought conditions (sell opportunity); near the lower band (~1.2600) suggests oversold conditions (buy opportunity).
A Bollinger Band squeeze indicates low volatility and a potential breakout.
d. Chart Patterns
Potential Patterns:
Double Top/Bottom: A double top near 1.3200 could signal a bearish reversal; a double bottom near 1.2600 suggests a bullish reversal.
Symmetrical Triangle: Consolidation between 1.2600-1.3200 may form a triangle, with a breakout direction driven by macroeconomic catalysts.
Confirm patterns with high volume and candlestick confirmation (e.g., engulfing patterns).
3. Trading Strategies
Below are two strategies tailored to the current GBP/USD setup, adaptable to bullish or bearish scenarios.
a. Breakout Strategy (Bullish/Bearish)
Setup: Wait for a breakout above resistance (1.3200) or below support (1.2600) on the daily chart, confirmed by a strong close and increased volume.
Entry:
Bullish: Enter long on a daily close above 1.3200, ideally with a retest of the breakout level.
Bearish: Enter short on a daily close below 1.2600, with a retest.
Stop-Loss:
Bullish: Below the breakout candle’s low or 1.3150.
Bearish: Above the breakout candle’s high or 1.2650.
Take-Profit:
Bullish: Target 1.3400 or 1.3500.
Bearish: Target 1.2400 or 1.2300.
Risk-Reward Ratio: Aim for at least 1:2 (e.g., risk 50 pips to gain 100 pips).
b. Range-Bound Strategy
Setup: If GBP/USD is consolidating between 1.2600-1.3200, trade the range using support/resistance.
Entry:
Buy near support (1.2600-1.2650) when RSI is oversold (<30) and a bullish reversal candlestick forms (e.g., hammer).
Sell near resistance (1.3150-1.3200) when RSI is overbought (>70) and a bearish candlestick appears (e.g., shooting star).
Stop-Loss:
Buy: Below support (e.g., 1.2550).
Sell: Above resistance (e.g., 1.3250).
Take-Profit:
Buy: Near resistance (1.3100-1.3200).
Sell: Near support (1.2650-1.2700).
Risk-Reward Ratio: Target 1:1.5 or better.
4. Risk Management
Position Sizing: Risk 1-2% of account capital per trade (e.g., $100-$200 on a $10,000 account).
Stop-Loss: Always use a stop-loss, placed beyond key support/resistance levels to account for volatility.
Leverage: Use low leverage (e.g., 1:10) to manage GBP/USD’s volatility, especially around news events.
News Events: Avoid trading during high-impact releases (e.g., BoE/Fed meetings, UK CPI, US NFP) or widen stop-losses to account for volatility.
5. Macro Considerations and Catalysts
Bullish GBP/USD Catalysts:
Hawkish BoE signals (rate hikes or delayed cuts).
Strong UK economic data (e.g., robust GDP, low unemployment).
Dovish Fed policy weakening the USD.
Bearish GBP/USD Catalysts:
Hawkish Fed signals (higher US rates or yields).
Weak UK economic data (e.g., rising inflation with slowing growth).
Risk-off sentiment boosting USD as a safe haven.

There is too much uncertainty.The USD/JPY exchange rate lingered near 144.50 during the European session, remaining under pressure. Although the U.S. Dollar Index (DXY) found temporary support near 100.10, its overall trend remains uncertain following Moody’s downgrade of the U.S. sovereign credit rating. Market sentiment is currently tilted toward cautious bearishness, with traders concerned about U.S. debt issues and uncertainties in trade policies—sentiments reflected in the dollar’s weakness. Meanwhile, the progress of U.S.-Japan trade negotiations has added to market uncertainty.
Technical Outlook:
Short-Term: If the pair stabilizes above the 143.74 support level and rebounds above 145, it may challenge the 146.19 resistance level in the near term. A decisive breakout above 146.19 could trigger a new upward trend, targeting 147.95 and 148.64.
Long-Term: A genuine confirmation of a bullish regime would require breaking above the 150 psychological level, which hinges on fundamental catalysts such as the Federal Reserve delaying rate cuts or the Bank of Japan shifting to a more accommodative stance.
Key Drivers to Monitor:
U.S. Treasury yield dynamics and Fed policy expectations.
Developments in U.S.-Japan trade talks and risk sentiment shifts.
Volatility in global equity markets and safe-haven flows.
Market participants are advised to exercise caution amid heightened uncertainty, with tight stop-losses recommended for directional trades.
In the market, there are no absolutes, and neither upward nor downward trends are set in stone. Therefore, the ability to judge the balance between market gains and losses is your key to success. Let money become our loyal servant.

USDJPY - New Impulse Soon!Hello TradingView Family / Fellow Traders. This is Richard, also known as theSignalyst.
📈USDJPY has been overall bullish trading within the rising broadening wedge pattern marked in blue and it is currently hovering around the lower bound of it.
Moreover, the orange zone is a strong structure and support.
🏹 Thus, the highlighted blue circle is a strong area to look for buy setups as it is the intersection of structure and lower blue trendline acting as a non-horizontal support.
📚 As per my trading style:
As #USDJPY is around the blue circle zone, I will be looking for bullish reversal setups (like a double bottom pattern, trendline break , and so on...)
📈The bullish impulse will begin after a break above the last minor high and upper red trendline.
📚 Always follow your trading plan regarding entry, risk management, and trade management.
Good luck!
All Strategies Are Good; If Managed Properly!
~Rich
Disclosure: I am part of Trade Nation's Influencer program and receive a monthly fee for using their TradingView charts in my analysis.

UsdJpy Trade IdeaUJ is overall bearish on all time frames. We do have price currently sitting below a major level with bearish structures still in play. I'll personally be shorting the pair if price can break down below the level of resistance and retest to confirm the bearish continuation. Well see what happens. Price may also flip the resistance level into support to continue ranging so patience is gonna pay here.
USD/JPY📊 USD/JPY Long Scenario – Current Market Context
Today, we witnessed a significant absorption of the bearish move that started with the impulse on May 13th. After a period of weakness and gradual price decline, the early hours of today's session showed a strong reaction, with price managing to reclaim the key price-time levels at 144.86 and 144.81.
This movement marks a short-term structural break, indicating a potential market intention to at least temporarily reverse direction and recover some of the losses from the previous bearish leg.
📈 Trade Idea
If price manages to close above the 144.86 and 144.81 levels by the end of the day, I would consider a short-term long entry, targeting a retest of the previous distribution phase around the 145.83 area — the point from which the May 13th impulse originated.
🎯 Target: 145.83 (distribution zone)
🛡️ Stop Loss: 144.41 (a strong and well-defended level)
⏳ Validation: Daily close above the mentioned levels
📌 Final Thoughts
This scenario is based on a price-time reading consistent with institutional market behavior: a sharp reclaim of key levels following a downside overshoot often precedes a broader corrective move, especially if confirmed by a strong daily close.
Let me know if you’d like a version for your trading journal or a more detailed trade plan. Catch you next time! 👋📉📈

USDJPY - Long Done, Soon Short!Hello TradingView Family / Fellow Traders. This is Richard, also known as theSignalyst.
📈As per our last USDJPY analysis, it rejected the orange support zone and has been trading higher.
What's next? As USDJPY approaches the upper blue trendline, we will be looking for shorts.
🏹 The highlighted red circle is a strong area to look for sell setups as it is the intersection of the upper blue trendline and green supply zone.
📚 As per my trading style:
As #USDJPY retests the red circle zone, I will be looking for bearish reversal setups (like a double top pattern, trendline break , and so on...)
Meanwhile, USDJPY would remain bullish medium-term and a bullish continuation towards the red circle is expected.
📚 Always follow your trading plan regarding entry, risk management, and trade management.
Good luck!
All Strategies Are Good; If Managed Properly!
~Rich
Disclosure: I am part of Trade Nation's Influencer program and receive a monthly fee for using their TradingView charts in my analysis.

USD/JPY UPDATE ON ANALYSISUSD/JPY 4H - This market couldn't have played out anymore perfect, we have seen price break structure to the downside and set a new lower low. Price is now reversing to put in the correction from the area I also predicted.
I will be waiting now patiently for price to pullback up and into the area of interest I have marked out for you all, as soon as price trades into that and delivers us with entry confirmation I will be looking to get involved.
It is important that we wait for price to trade into the area of interest and allow it to deliver us with confirmation that price is ready to reverse and trade us lower longer term.
As soon as we have that I will be looking to place my short position, with my SL above the zone I get involved from, and my TP at the higher timeframe swing low, this just guarantees that our TP is achievable and it gives us a great RR return.

USDJPY Outlook: Weekly Bearish Bias Despite Temporary RebalanceGreetings Traders,
It's the start of a new trading week, and our focus is on the Gopher — CAPITALCOM:USDJPY .
Weekly Overview: Temporary Rebalance, Bearish Tone Intact
On the weekly chart, USDJPY pushed higher to rebalance a Fair Value Gap (FVG) between 149.30 and 148.26. Following this, price was swiftly rejected, forming a shooting star candlestick — a classic sign of potential bearish continuation.
However, for this bearish outlook to remain valid, 146.250 must hold as resistance. A sustained break above this level could invalidate the current bias and signal the possibility of further upside.
Daily Chart: Downside Pressure Builds
Looking at the daily timeframe, we see a sequence of down-close candles, indicating consistent selling pressure. I expect price to continue pushing lower, targeting the FVG below, with a potential sweep of sell-side liquidity resting under recent lows.
Trading Plan: Bearish Setup
Unless disrupted by high-impact fundamentals, I’ll be favouring short positions this week. My planned setup is as follows:
Entry: On confirmation within the 145.63 zone
Stop Loss: Above 145.97
Target Zones: Around 144.430
I’ll monitor price reaction closely at key levels to manage the trade accordingly.

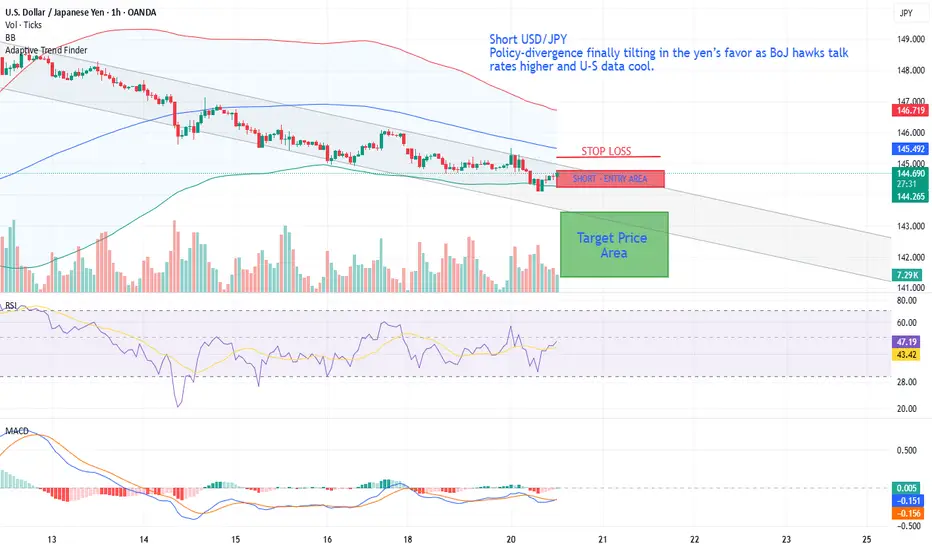
Short USD/JPYShort USD/JPY – policy-divergence finally tilting in the yen’s favor as BoJ hawks talk rates higher and U-S data cool.
• BoJ hawks signaling further 2025 hikes while Fed easing bets build → policy-divergence flips JPY-positive.
• Break & close below 38.2 % retracement and 200-SMA (H4) turns momentum south; hourly / daily RSI roll-over.
• Geopolitics easing removes safe-haven bid for USD, but not for JPY (BoJ still seen hiking).
• Bearish trigger deepens if 144.30 confluence (200-SMA H4 + 50 % Fib) gives way → air-pocket into 141s.
USDJPY:Is it a beginning of major bullish trend? Read CaptionThe price of USDJPY has shown a mixed volume, making it difficult to determine the trend. However, if we analyse the data, we can see that USD is gaining strength in the coming time. This could be due to the strong news coming in this week, which may divert the USDJPY towards the 150 price region. There are four potential targets that price could hit and surpass. Please use this analysis solely for educational purposes, as it does not provide any guarantees.
Good luck and trade safely.
Thanks for your support! 😊
If you’d like to help us out, here are a few things you can do:
- Like our ideas
- Comment on our ideas
- Share our ideas
Team Setupsfx_
❤️
