USDJPY 15M BUY FRIDAY DELIGHT LOLEvery pips count Scalping 15m
Reason to buy
Strong SUPPORT 144.22
Lets hope we get PAID @ THIS LOVELY SUNNY LONDON :))))
USDJPY_SPT trade ideas

USD/JPY BEARS ARE GAINING STRENGTH|SHORT
Hello, Friends!
Bearish trend on USD/JPY, defined by the red colour of the last week candle combined with the fact the pair is overbought based on the BB upper band proximity, makes me expect a bearish rebound from the resistance line above and a retest of the local target below at 143.964.
Disclosure: I am part of Trade Nation's Influencer program and receive a monthly fee for using their TradingView charts in my analysis.
LIKE AND COMMENT MY IDEAS

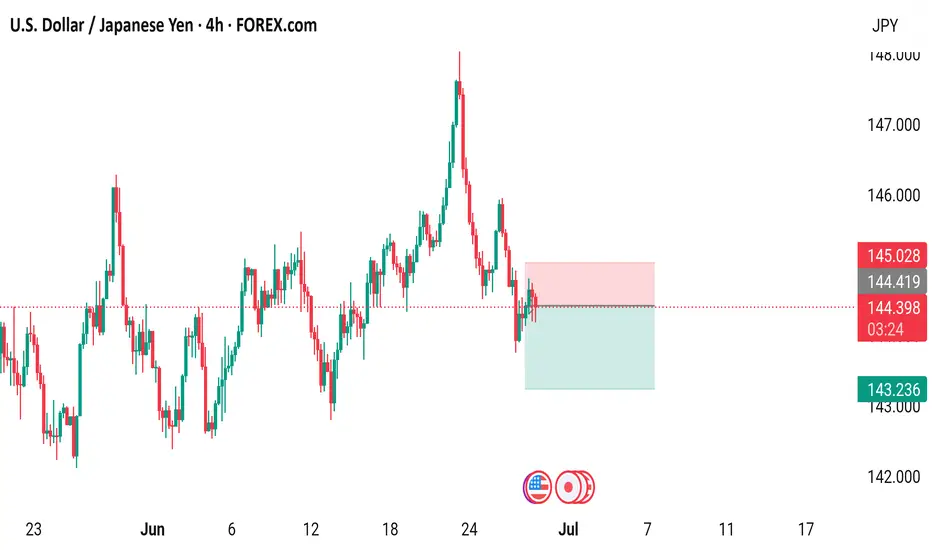
USD/JPY 4-Hour Forex Chart4-hour performance of the U.S. Dollar (USD) against the Japanese Yen (JPY) from FOREX.com, showing a current exchange rate of 144.351 with a slight decrease of 0.063 (-0.04%). The chart highlights a recent sharp upward movement followed by a decline, with key support and resistance levels marked around 144.419 and 145.028, respectively. The time frame spans from late June to early July 2025.
USD/JPY and what’s expected from the NFP?The USD/JPY hasn't dropped like the other dollar crossed yet, but could we potentially see a clean break down below 142.50 support? Well, we will need to see a big miss on the NFP print for that to potentially happen.
The consensus is for a 110K increase in non-farm payrolls, but recent data has been less than convincing. The ADP private payrolls figure released yesterday registered its first decline in over a year, stoking concerns that today’s number might fall short of expectations — potentially even slipping below 100K.
On the unemployment front, a slight uptick to 4.3% is anticipated, up from 4.2%, while Average Hourly Earnings are seen rising 0.3% month-on-month vs. 0.4% increase the month before.
By Fawad Razaqzada, market analyst with FOREX.com

USDJPY Ascending channel breakout buy strong from demand zone📈 USDJPY Bullish Breakout Alert! 🚀
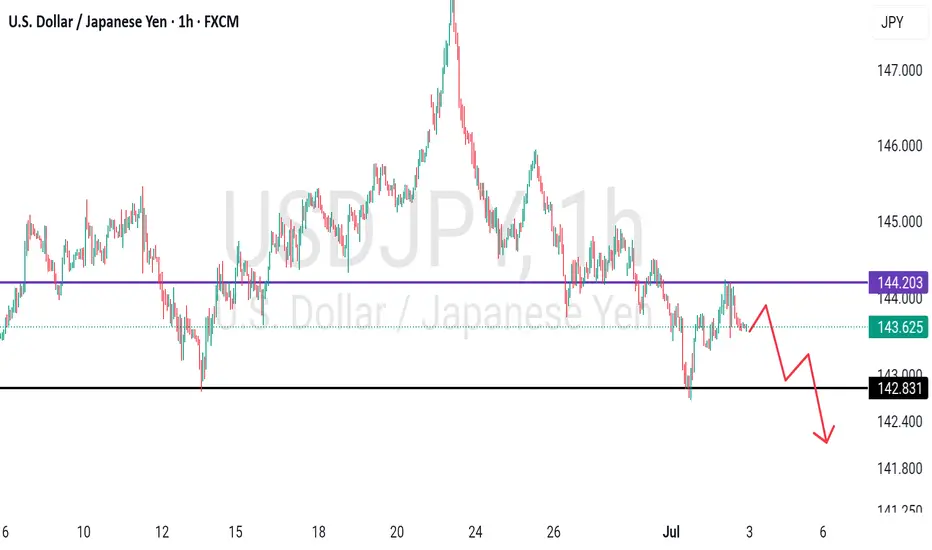
USDJPY has officially broken out of the descending channel from the 143.800 demand zone — showing strong bullish momentum on the 1H time frame! 🔥
🎯 Technical Targets:
1st Target: 145.000 – Supply Zone 💥
2nd Target: 146.000 – Key Resistance
3rd Target: 148.000 – Major Resistance Level
Momentum is building — bulls are in control! 🐂
👇 Like, Follow & Comment your thoughts below!
💬 Join our trading community for more real-time updates and analysis!
#USDJPY #ForexSignals #PriceAction #BreakoutTrade
#LiviaTrades 😜

USD/JPY "The Ninja Heist" – Bullish Loot Grab!🌟 Hey, Thieves & Market Bandits! 🌟
💰 Ready to raid the USD/JPY "The Gopher" vault? 💰
Based on 🔥Thief Trading Style🔥 (technical + fundamental heist analysis), here’s the master plan to swipe bullish profits before the market turns against us! Escape near the high-risk Yellow MA Zone—overbought, consolidation, and bear traps ahead! 💸 "Take the money and run—you’ve earned it!" 🏆🚀
🕵️♂️ Heist Strategy:
📈 Entry (Bullish Raid):
The vault’s unlocked! Buy any price—this heist is LIVE!
Pullback lovers: Set buy limits at recent/swing lows for extra loot.
🛑 Stop Loss (Escape Route):
Thief SL at recent/swing low (4H/Day trade basis).
Adjust based on your risk, lot size, and multiple orders.
🎯 Target (Profit Escape):
147.500 (or flee earlier if bears ambush!)
⚔️ Scalpers’ Quick Strike:
LONG ONLY! If rich, attack now. If not, join swing traders & rob slowly.
Trailing SL = Your bodyguard! 💰🔒
💥 Why This Heist?
USD/JPY "The Ninja" is bullish due to key factors—check:
📌 Fundamental + Macro + COT Report
📌 Quantitative + Sentiment + Intermarket Analysis
📌 Future Targets & Overall Score (Linkks In the profile!) 🔗🌍
🚨 Trading Alert (News = Danger!):
Avoid new trades during news—volatility kills!
Trailing SL saves profits on running positions.
💖 Support the Heist Team!
💥 Smash the Boost Button! 💥
Help us steal more money daily with Thief Trading Style! 🏆🚀
Stay tuned—another heist is coming soon! 🤑🎯

USD/JPY pair struggles due to a weaker US DollarOn the JPY side, nothing has changed fundamentally, and the currency has been mainly driven by the risk sentiment. As a reminder, the BoJ kept interest rates unchanged at 0.5% and reduced the bond tapering plan for fiscal year 2026 as expected at the last meeting. The BoJ continues to place a great deal on the US-Japan trade deal and the evolution of inflation.
USD/JPY is moving lower despite the disappointing Industrial Production report from Japan. The report showed that Industrial Production increased by +0.5% month-over-month in May, compared to analyst forecast of +3.5%. However, I think that if we respect this area, we might see upward momentum coming soon.


USDJPY TRADE USDJPY has dropped. We're clear to the downside.
All we need to do is to manage our trade to maximize profits.

USDJPY - placed reasonable high? What's next??#USDJPY.. market placed 144.20-25 day high in yesterday and that is a very reasonable high.
If market hold it in that case we can expect drop from here.
Don't be lazy here.
Good luck
Trade wisely
Trump threatens tariff on Japan as deadline looms, yen dipsThe Japanese yen is negative ground on Thursday. In the North American session, USD/JPY is trading at 144.06, up 0.47%.
The US and Japan are racing to reach a trade deal before a deadline of July 9. There are some serious roadblocks to a deal, including the current US tariff of 25% on Japanese cars and opening Japan's agricultural sector, particularly rice. President Trump has insisted that Japan import American-grown rice, but the Japanese government says that is unacceptable.
Japan's Economy Minister Ryosei Akawaza said earlier this week that Japan would not "sacrifice the agricultural sector", while Farm Minister Shinjiro Koizumi said that foreign rice imports would threaten Japan's food security.
It's a shortened week in the US due to the Fourth of July holiday on Friday. The US will release the June employment report on Thursday, with all eyes on nonfarm payrolls.
Nonfarm payrolls eased slightly in May to 137 thousand from 147 thousand and the downward trend is expected to continue, with a consensus of 110 thousand for June. This would mark the weakest pace of job growth since 2020, with the exception of a meltdown in job growth in Oct. 2024.
The Federal Reserve will also be monitoring the nonfarm payroll report. The US labor market has been weakening and the Fed is concerned that the jobs market could show a sharp deterioration. Currently, the most likely date for the next Fed rare cut is September, but a soft NFP reading south of 90 thousand would boost the case for a cut at the July 30 meeting.
The Fed has maintained a wait-and-see stance since Nov. 2024 but that is expected to change in the fourth quarter, where we could see up three rate cuts.
USDJPY 29/06/2025Weekly:
-Bearish W pattern.
-Liquidity sweep.
-Expecting a bearish weekly candle.
Daily:
-Bearish W pattern.
-IC.
4H:
-Bearish W pattern.
-IC.

Yen rises sharply, Tokyo Core CPI nextThe Japanese yen has edged higher on Friday. In the North American session, USD/JPY is trading at 144.57, up 0.16% on the day.
Tokyo Core CPI surprised on the downside in June, falling to 3.1% y/y. This was down sharply from the 3.6% gain in May and below the market estimate of 3.3%. This was the the first slowdown in Tokyo core inflation since February. The decline was largely driven by a renewal of fuel subsidies and a reduction in water charges.
Despite the drop, core inflation remains well above the Bank of Japan's 2% target, maintaining expectations for another rate hike in the second half of the year. BoJ Governor Ueda has signaled that the Bank will raise rates if it is confident that wage growth is sustained, which is critical to maintaining inflation at the 2% target. However, this week's BOJ Summary of Opinions showed that some members are more dovish, given global trade tensions and the bumpy US-Japan trade talks. Japan has said it will not agree to US tariffs of 25% on Japanese cars, and six rounds of talks in the past two months have failed to produce a deal.
The Core PCE Price Index, the Fed's preferred inflation indicator, accelerated in May and was higher than expected. The index rose 2.7% y/y up from an upwardly revised 2.6% in May and above the consensus of 2.6%. Monthly, the index rose 0.2%, up from 0.1% which was also the consensus. This was a three-month high and will boost the case for the Fed to leave interest rates unchanged at the July meeting.
USD/JPY faces resistance at 144.49 and 144.64
144.31 and 144.16 are the next support levels


Market next move Disruption of the Bullish USD/JPY Analysis
1. Weak Bullish Momentum
The current bullish attempt is showing small-bodied candles with low follow-through.
Disruption: This suggests a lack of conviction from buyers. If there’s no strong bounce soon, it could indicate distribution rather than accumulation.
2. Volume Imbalance
Notice the recent spike in bearish volume (red bars), especially during the last price drop.
Disruption: Volume is supporting the downtrend, not the rebound. This suggests sellers are still in control.
3. Lower High Structure
The price recently failed to form a higher high and continues forming lower highs and lower lows.
Disruption: This pattern is a classic sign of a continuing bearish trend, contradicting the bullish target.
4. Fundamental Headwinds
The U.S. economic icon (flag) suggests an upcoming high-impact event — likely NFP, GDP, or rate decision.
Disruption: If U.S. data is weak or if there's talk of the Fed pausing rate hikes, USD could weaken, pushing USD/JPY further below 144.000.

USDJPY FXAN & Heikin Ashi exampleIn this video, I’ll be sharing my analysis of USDJPY, using FXAN's proprietary algo indicators with my unique Heikin Ashi strategy. I’ll walk you through the reasoning behind my trade setup and highlight key areas where I’m anticipating potential opportunities.
I’m always happy to receive any feedback.
Like, share and comment! ❤️
Thank you for watching my videos! 🙏

USD/JPY "The Ninja Heist" – Bullish Loot Grab!🌟 Hey, Thieves & Market Bandits! 🌟
💰 Ready to raid the USD/JPY "The Gopher" vault? 💰
Based on 🔥Thief Trading Style🔥 (technical + fundamental heist analysis), here’s the master plan to swipe bullish profits before the market turns against us! Escape near the high-risk Yellow MA Zone—overbought, consolidation, and bear traps ahead! 💸 "Take the money and run—you’ve earned it!" 🏆🚀
🕵️♂️ Heist Strategy:
📈 Entry (Bullish Raid):
The vault’s unlocked! Buy any price—this heist is LIVE!
Pullback lovers: Set buy limits at recent/swing lows for extra loot.
🛑 Stop Loss (Escape Route):
Thief SL at recent/swing low (4H/Day trade basis).
Adjust based on your risk, lot size, and multiple orders.
🎯 Target (Profit Escape):
148.700 (or flee earlier if bears ambush!)
⚔️ Scalpers’ Quick Strike:
LONG ONLY! If rich, attack now. If not, join swing traders & rob slowly.
Trailing SL = Your bodyguard! 💰🔒
💥 Why This Heist?
USD/JPY "The Ninja" is bullish due to key factors—check:
📌 Fundamental + Macro + COT Report
📌 Quantitative + Sentiment + Intermarket Analysis
📌 Future Targets & Overall Score (Linkks In the profile!) 🔗🌍
🚨 Trading Alert (News = Danger!):
Avoid new trades during news—volatility kills!
Trailing SL saves profits on running positions.
💖 Support the Heist Team!
💥 Smash the Boost Button! 💥
Help us steal more money daily with Thief Trading Style! 🏆🚀
Stay tuned—another heist is coming soon! 🤑🎯

Forecast USDJPY Contrary to popular belief, USD/JPY is structurally in a long-term bearish trend since 1971 on a logarithmic scale. What appears to be a recovery is in fact a technical retracement within a broader secular downtrend.
A historic hidden bearish divergence is forming: the RSI has been gradually rising, while the price continues to print lower highs over the decades. This reflects a momentum squeeze within the bearish structure.
We may be standing at the edge of a major rejection zone, where the long-term downtrend could reassert itself forcefully. The market is quietly preparing for a powerful bearish continuation.

USDJPY is ready to go down to 143.834USDJPY is ready to follow my strategy and is already going down to 143.834

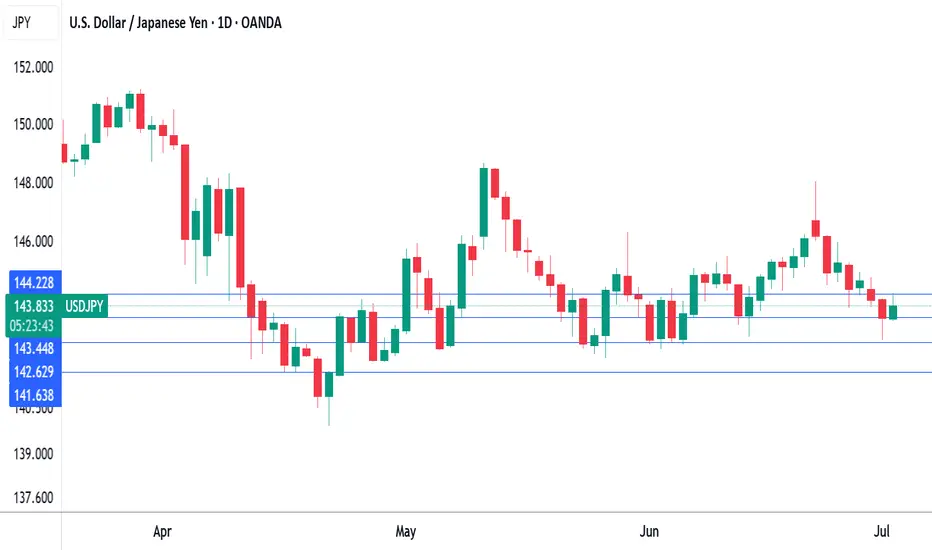
USD/JPY Consolidation Triangle – Breakout WatchThe USD/JPY pair is currently trading inside a well-formed symmetrical triangle pattern on the daily chart. This structure typically forms when the market is in a phase of consolidation, with neither buyers nor sellers able to break the range. Price is compressing between a horizontal resistance zone (~146.50) and a rising support line (~143.50), indicating that a breakout in either direction may be imminent.
This triangle has formed after a sharp downtrend, followed by a broad base formation. Such setups often precede a decisive move, especially if accompanied by volume.
🔼 Upside Breakout Scenario
If price breaks and closes above the resistance zone (above 146.50–147.00) with bullish confirmation, we can expect momentum to shift in favor of buyers. A confirmed breakout would open the path toward 150.00+, possibly even retesting the highs of 2024 near 152.00. This would be seen as a bullish reversal after a prolonged downtrend.
🔽 Downside Breakdown Scenario
Alternatively, if price fails to hold the rising trendline and breaks below the 143.00–142.50 support zone, it may confirm a bearish breakdown. This would suggest a continuation of the earlier downtrend with fresh bearish momentum targeting 140.00 and lower levels.
🧭 Trade Strategy Consideration
Bullish Plan: Buy breakout above 147.00 with SL below 145.50 and TP near 150.50–152.00
Bearish Plan: Sell breakdown below 142.50 with SL above 144.00 and TP near 140.00–138.00
Neutral Bias: Wait for breakout confirmation; no trade inside the triangle
This is a tight volatility setup where breakout traders should stay alert. The longer the consolidation, the stronger the breakout move tends to be.
=================================================================
Disclosure: I am part of Trade Nation's Influencer program and receive a monthly fee for using their TradingView charts in my analysis.
=================================================================

Market next target ⚠️ Disruption & Counterpoints:
1. Premature Breakout Bias:
The chart shows price repeatedly rejecting the resistance zone (highlighted in red).
The arrow assumes a clean breakout without confirmation — this is speculative, as the price hasn’t closed convincingly above the resistance.
This could easily turn into a false breakout or double top if price fails again.
2. Volume Mismatch:
A breakout should be backed by strong bullish volume. However, the current volume is mixed and not showing a clear surge in buyer strength.
Lack of volume confirmation makes the breakout less reliable.
3. Ignoring Recent Rejections:
The red zone was tested multiple times in the last sessions without success. That typically signals strong supply or institutional selling.
Repeating this setup without accounting for historical failure adds downside risk.
4. Missing Bearish Scenario:
No alternate path is considered. A failed breakout could lead to a pullback toward 144.00 or lower, especially with U.S. news events (indicated by the flag).
A balanced analysis should always prepare for both breakout and rejection.
5. Macroeconomic Event Risk:
Similar to the GBP/USD chart, this one also shows an upcoming U.S. economic event. That could heavily move USD/JPY, and technical setups may become invalid fast.
The analysis ignores the need to wait for the news catalyst or confirmation after the release.

USDJPY Poised for a BreakoutUSDJPY Poised for a Breakout
On the 4-hour chart, USDJPY is not yet taking a clear direction. The price is showing the possibility of both movements.
With the current data we can see that USDJPY is forming a triangle pattern and only the breakdown up or down will show the direction of the price.
However, I think the chances are higher for the bullish movement considering that the geopolitical tension in the Middle East is also very high and the USD remains one of the strongest currencies.
Bullish target: 147.90
Bearish target: 140.90
⚠️ Note: If the pattern transforms more than this triangle, then we may be in a different situation and everything may be invalid. The analysis may change over time.
You may find more details in the chart!
Thank you and Good Luck!
❤️PS: Please support with a like or comment if you find this analysis useful for your trading day❤️
Disclosure: I am part of Trade Nation's Influencer program and receive a monthly fee for using their TradingView charts in my analysis.

Bullish bounce?USD/JPY is falling towards the pivot which is an overlap support and could bounce to the 1st resistance that lines up with the 23.6% Fibonacci retracement.
Pivot: 144.35
1st Support: 143.09
1st Resistance: 145.29
Risk Warning:
Trading Forex and CFDs carries a high level of risk to your capital and you should only trade with money you can afford to lose. Trading Forex and CFDs may not be suitable for all investors, so please ensure that you fully understand the risks involved and seek independent advice if necessary.
Disclaimer:
The above opinions given constitute general market commentary, and do not constitute the opinion or advice of IC Markets or any form of personal or investment advice.
Any opinions, news, research, analyses, prices, other information, or links to third-party sites contained on this website are provided on an "as-is" basis, are intended only to be informative, is not an advice nor a recommendation, nor research, or a record of our trading prices, or an offer of, or solicitation for a transaction in any financial instrument and thus should not be treated as such. The information provided does not involve any specific investment objectives, financial situation and needs of any specific person who may receive it. Please be aware, that past performance is not a reliable indicator of future performance and/or results. Past Performance or Forward-looking scenarios based upon the reasonable beliefs of the third-party provider are not a guarantee of future performance. Actual results may differ materially from those anticipated in forward-looking or past performance statements. IC Markets makes no representation or warranty and assumes no liability as to the accuracy or completeness of the information provided, nor any loss arising from any investment based on a recommendation, forecast or any information supplied by any third-party.
