BEARISH SENTIMENT ON USDJPYMy sentiment on USDJPY remains bearish as all the bullish gains last week Monday were all lost. I anticipate a sell to occur. We’re going to watch how price react in order to help us position ourselves for a sell opportunity
USDJPY_SPT trade ideas

USDJPY analysis week 21Fundamental Analysis
USD/JPY recovered slightly on Friday as the USD recovered and traded sideways around the DXY index level of 100.80.
The Japanese Yen (JPY) strengthened despite a decline in Japan's GDP, due to its safe-haven status and expectations that the BOJ will not raise interest rates soon.
The BOJ kept interest rates at 0.5%, lowered its 2025 GDP growth forecast to 0.5% and may pause interest rate hikes until September to monitor the impact of US tariffs.
The Fed kept interest rates unchanged, no plans to cut in the near term. The Fed Chairman warned that tariffs could increase inflation and reduce growth.
Technical Analysis
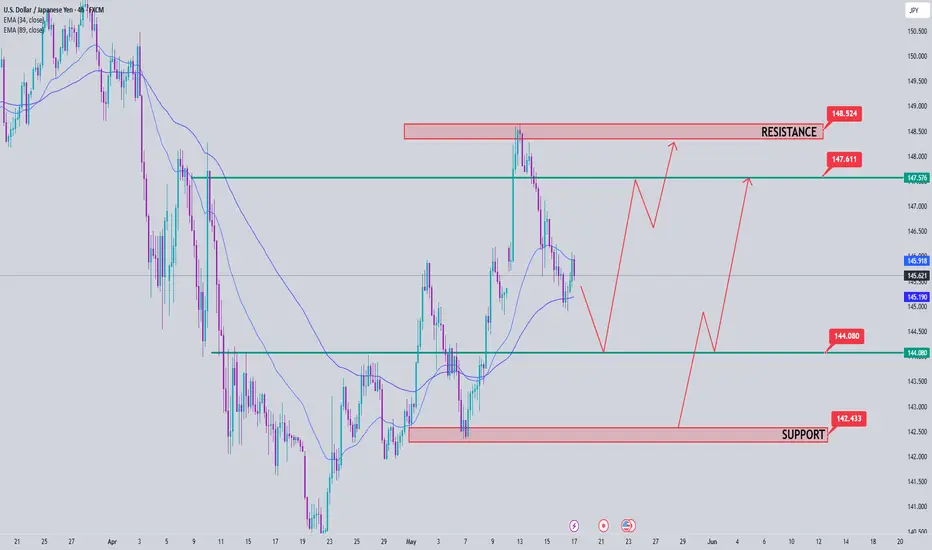
USDJPY is reacting at the 89 EMA. Overall, the uptrend is still maintained for this pair and pay attention to the immediate support level of 144,000, while the pair is still trading above this area, the uptrend is still continuing. The two resistance levels that the pair could reach next week are noted at 147.500 and 148.300. In case the 144.000 trend zone is broken, the pair's slide will be supported by the May low around 142.600.
USDJPY H4USDJPY Buy Opportunity
T&C's: Trading leveraged products such CFDs on forex and derivatives may not be suitable for all investors as they carry a high level of risk to your invested capital. Please ensure that you fully understand the risks involved, taking into account your objectives, risk tolerance and level of experience, before deciding whether to trade

USDJPY: Continue to short after risingUSDJPY's downward trend has not ended, wait for it to rise before continuing to short
Accurate signals are sent every day, all profitable and free. Account management services are also provided.
USDJPY sell@147-148
tp:145-143

Going bullish on UJThe Demand zone was rejected twice sensing that buyers are in play, we're now waiting for next week to kick off

USD/JPY H8 AnalysisSince entering weekly support at 140.00 in April, we have seen a steady series of higher highs and lows (buyers in charge).
The MACD suggests that the bullish momentum is still strong with the peaks also making higher highs.
Price is approaching the current trendline and we may see buying resume again soon.
This is an idea of what may happen.
Always trade with a profitable strategy and good risk management.

Price broken above the swing low for a reversal. USDJPYSo I can see price and risen above the low which tells me a strong buy sentiment is coming. Wait for retracement to take out the imbalance and test trend line and support line. After which it should reverse and go up. Taking it to the previous high and area of resistance. Let's see how this plays out next week!

UJ long up to 148.654Last week UJ made a strong bullish impulse which left behind a weak high at 148.654.
Price is currently rejection the demand which caused the last strong bullish impulse. Even though it is still looking like a bearish pullback, making LL's & LH's. The 2 bullish impulses which started in the demand is showing buyers stepping in.
Which could potentially start the reversal of this long pullback.

USDJPY 4H Bearish Trend Continues
As we said in the last idea , buyers are weak and price is going down again.
Targets:
• 143.82
• 141.83
• 140.32
This is based on a math method I use, and it’s very strong.
Only if price stays above 147.17, this analysis is not valid anymore.
Accurate ideas, amazing results!

USDJPYIf the Daily BISI holds and supports price to push higher, then I'd be interested to engage. Price is currently at a discount relative to current Dealing Range.

USDJPY, shortsLooking to short UJ If this 15m structural low gets taken out. I’ll trade off the OB located off the top targeting the 4h low (blue line) as a continuation of the 4h bias to the downside.

I Think I Should Just Trade This SetupI Think I Should Just Trade This Setup
So long story short, I just:
0. Assess whether price has Seeked Liquidity, or Rebalanced Fair Value to get a clue of current price intention.
1. Wait for Overextended Price (Bearish or Bullish), Higher TF = Better
2. Wait for 4HR up to 15min Divergence + Oversold/Overbought, at least 2 TF with same divergence
3. On 15min, plot your FVA (PDA must be respected).
4. Look for your FVG entry once price has left the FVA.
5. Target nPOCs that align with divergence + price action direction (ex. npoc below price + bearish div + premium array respected + bearish orderflow leg)
I've been winning "random" trades like this, no TradingView needed, just MT5, and has saved my funded account from imminent death lol. But here's how, if I looked back on those trades, I entered.
I mean, this makes sense. Combine Price Action(PDA + FVA Respected) with Volume Momentum.
Oh, and just to add. I think nPOCs from previous sessions give a good clue about where price wants to go.
For example, npoc below price + bearish div & overbought + premium array respected + bearish orderflow leg = target nPOC.
I might have to track tradingview entries to see if this actually works.

USD_JPY RISKY SHORT|
✅USD_JPY made a bearish
Breakout of the key horizontal
Level of 146.133 which is a
Resistance now and the pair
Is now making a pullback
But as we are bearish biased
We will be expecting a move
Down after the pair retests
The new resistance
SHORT🔥
✅Like and subscribe to never miss a new idea!✅
Disclosure: I am part of Trade Nation's Influencer program and receive a monthly fee for using their TradingView charts in my analysis.

SELL USDJPY HIGH WINRATEI BELIVE THIS TRADE WILL GO DOWN AND I"M GOING HEAVY ON THIS>>>>>> idk why the tradingview can't upload this they say there is Quite a lot Capital Letter.

USDJPY Long Setup – W Pattern + 4H OB ConfluenceAfter price rejected the previous 4H OB with a bearish M-pattern and engulfing confirmation @146.766, the bearish move extended and tapped into a deeper 4H Order Block, where we now see a well-structured W reversal pattern forming @145.310. Below is my technical Confluence.
Technical Confluence:
✅ Clear 4H Bullish Order Block acting as demand
✅ Well-formed W pattern with balanced symmetry
✅ Strong bullish rejection candles at the second leg (1H Tweezer Candle)
✅ Price swept liquidity beneath previous lows before reversing — classic smart money signature
✅ Volume spike and slowing bearish momentum confirm potential reversal
Trade Rationale:
This long entry is taken based on the confluence of a 4H OB and a confirmed W pattern, which often signals a potential reversal or temporary bullish correction. The second leg of the W also aligns with a Fair Value Gap (FVG) on lower timeframes, indicating institutional interest.
Risk Note:
Always manage your risk — even when technicals align perfectly, fundamentals or unexpected news can influence volatility. Keep risk per trade minimal and allow structure to confirm the move.

USD/JPY Poised for Breakout: Watch the 145.60 TriggerUSD/JPY remains in a broader uptrend, with buyers defending the 141.00–144.50 support zone on the daily chart. While price has recently pulled back from the 148.50 high, the overall structure remains bullish. On the hourly timeframe, the pair has been moving within a descending channel since May 13. However, a double bottom near 141.80 and a push back toward 145.50 suggest buyers are regaining control. A breakout above the channel resistance at 145.60 could signal the end of the correction and a new leg higher toward 147.00–148.00.
The 15-minute chart supports this setup, showing a bull-flag consolidation above 145.20 and rising trendline support near 145.10. Volume has thinned during the flag formation, indicating a potential surge on breakout. Traders should look to buy above 145.60, targeting 146.20 and 146.80, with stops just below 145.00. A break under 145.00 flips the short-term bias bearish, with downside targets at 144.60 and 144.20.
Overall, the technicals favor a bullish breakout scenario into the week, provided 145.00 holds. Intraday traders should closely monitor the 145.00–145.60 zone for momentum confirmation.

CHECK USDJPY SIGNAL READ CAPTAINusdjpy signal technical analysis satup 👇🏼
(usdjpy) buy zone
( TRADE SATUP)
ENTRY POINT (145.450) to (145.550) 📊
FIRST TP (146.000)
2ND TARGET (146.650) 📊
LAST TARGET (147.100) 📊
STOP LOOS (144.800)❌
FALLOW RISK MANAGMENT

USD/JPY(20250516)Today's AnalysisMarket news:
Fed Chairman Powell: The Fed is adjusting its overall policy-making framework. Zero interest rate is no longer a basic situation. The wording of underemployment and average inflation rate needs to be reconsidered. PCE is expected to drop to 2.2% in April.
Technical analysis:
Today's buying and selling boundaries:
145.93
Support and resistance levels:
147.26
146.77
146.44
145.42
145.10
144.61
Trading strategy:
If the price breaks through 145.93, consider buying, the first target price is 146.44
If the price breaks through 145.42, consider selling, the first target price is 145.10


B'n'B FXThis system or indicator provides 70 to 90% win ratio so all you have to do is observe and follow the signals it give.

Yen Strengthens Despite Japan’s Q1 ContractionThe Japanese yen strengthened toward 145 per dollar, extending its rally for a fourth straight day, despite Japan’s economy shrinking by 0.2% in the first quarter, worse than forecasts. While the Bank of Japan acknowledged the risks posed by U.S. trade policies, it remains confident that rising wages and prices will support eventual policy normalization. Investors are closely watching U.S.-Japan trade negotiations, with Japan insisting that any deal must include the auto sector and that the 25% U.S. tariff on Japanese cars be removed.
Resistance is noted at 148.60, with further barriers at 149.80 and 151.20. Major support levels lie at 139.70, 137.00, and 135.00.

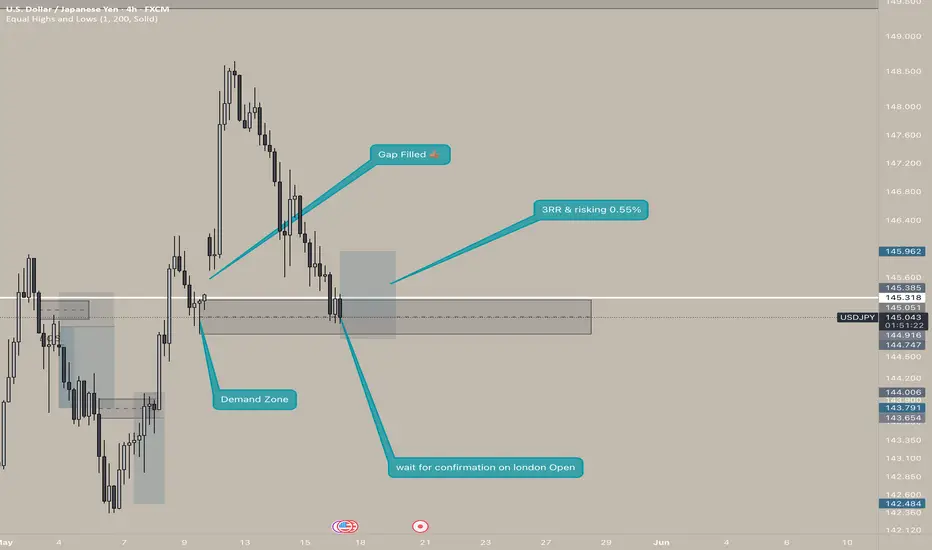
USDJPY Repriced for a Better Short OpportunityIn my initial trade shared during the Asian session, USDJPY swept the sell-side liquidity and formed a clear Fair Value Gap (FVG). Price action has now provided a refined entry point for a continuation short setup.
The recent liquidity sweep, followed by displacement, suggests that the market may aim for the recent low — with the potential to push even further if bearish momentum continues. My short position is now aligned with this structure, and I’ll be watching closely for signs of continuation or rejection near key support levels.
