USDJPY LONG Market structure bullish on HTFs DH
Entry at Daily AOi
Weekly Rejection At AOi
Daily Rejection at AOi
Previous Daily Structure point
Daily EMA Retest
Around Psychological Level 145.000
H4 EMA Retest
H4 Candlestick rejection
Rejection from Previous structure
Levels 3.67
Entry 95%
REMEMBER : Trading is a Game Of Probability
: Manage Your Risk
: Be Patient
: Every Moment Is Unique
: Rinse, Wash, Repeat!
: Christ is King.
USDJPY_SPT trade ideas

USD/JPY 4-Hour Forex Chart4-hour chart from FOREX.com displays the exchange rate between the U.S. Dollar (USD) and the Japanese Yen (JPY) as of June 25, 2025. The current rate is 145.156, reflecting a 0.16% increase (+0.226). The chart highlights a recent sharp upward movement followed by a decline, with key support and resistance levels marked around 144.484 and 145.731, respectively. The shaded areas indicate potential trading ranges, with the current price hovering near the upper boundary.

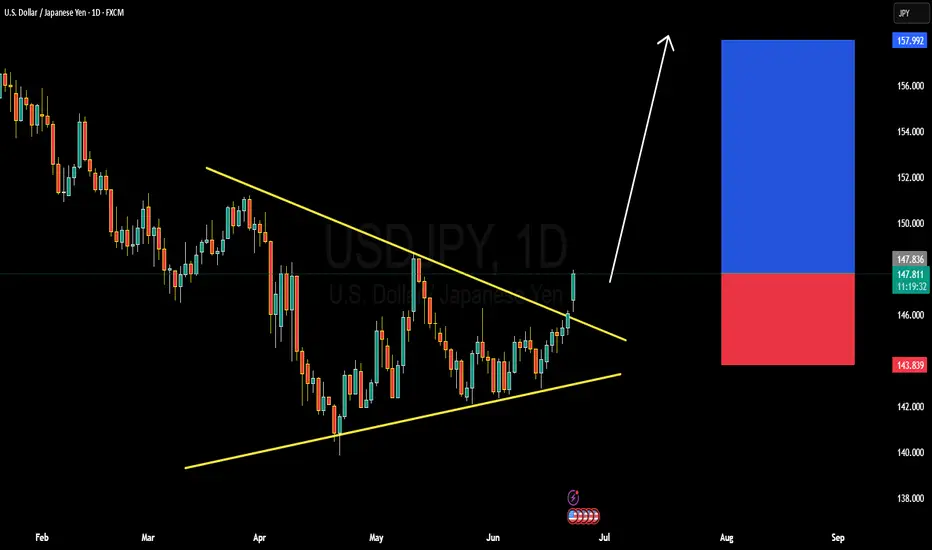
SDJPY BULLISH OR BEARISH DETAILED ANALYSISUSDJPY has successfully broken out of the symmetrical triangle structure that has been forming since early April, with today’s daily candle showing strong bullish momentum above the resistance zone around 147.500. The breakout is clean and backed by volume, which suggests that bulls are in full control. Price action is respecting the trendline structure and has now confirmed a fresh higher high, setting the stage for the next bullish leg. My immediate upside target for this move stands at 157.900.
Fundamentally, the divergence between the Federal Reserve and the Bank of Japan continues to widen. The Fed remains hawkish with inflation still sticky in the US and interest rate cuts being pushed further out. In contrast, the Bank of Japan remains ultra-dovish, with no major policy tightening in sight and continued yield curve control. This policy mismatch is keeping the Yen under consistent selling pressure. Additionally, Japan's core inflation slipped again this week, further reducing the probability of any BOJ rate hike this quarter.
The technical breakout aligns perfectly with the macro narrative. A strong bullish candle breaking structure on the daily suggests momentum will likely continue. With no strong resistance until the 157.900 area, this setup offers a high-conviction long opportunity. Traders should watch for minor pullbacks toward 147.000–146.800 as potential re-entry or add-on zones.
With rising US bond yields, weak Japanese fundamentals, and breakout confirmation on the chart, USDJPY is now well-positioned for a continuation rally. This is a trend-following setup with solid fundamentals and momentum confirmation—ideal conditions for a profitable move in the current forex environment.
U
DeGRAM | USDJPY retesting the resistance level📊 Technical Analysis
● Four consecutive higher-lows off 140.9 have carved a rising flag that presses the channel roof (144.8); flag depth projects to the April swing-top/ Fib cluster at 147.8 once 145 is cleared.
● Daily RSI holds above 50 and price is now trading back above the broken wedge-cap (142.9), confirming it as demand and tilting risk toward the 150.9 macro ceiling.
💡 Fundamental Analysis
● US 2-yr yields stay >4.70 % after solid ISM-services prices, while BoJ minutes show members preferring “patient” normalisation; the widening policy gap keeps yen funding pressure intact.
✨ Summary
Long 142.9-144.0; break of 145 targets 147.8, stretch 150.9. Bull view invalidated on a daily close below 140.9.
-------------------
Share your opinion in the comments and support the idea with like. Thanks for your support!

USD/JPY Profit Heist – Are You In or Missing Out?"🔥💰 "USD/JPY NINJA HEIST: Bullish Loot Before the Trap! (Thief Trading Style)" 💰🔥
🌟 Attention Market Robbers & Profit Takers! 🌟
🚨 Thief Trading Alert: USD/JPY "The Ninja" is primed for a BULLISH HEIST!
Based on our stealthy technical & fundamental analysis, we’re locking in a long entry strategy. The plan? Loot profits before the RED ZONE danger hits! Overbought? Maybe. Risky? Sure. But the real robbery happens before the bears wake up! 🏴☠️💸
🎯 ENTRY: The Vault is OPEN!
Buy Limit Orders: Swipe the dip on pullbacks or jump in at key swing lows.
Aggressive? Enter now & ride the wave!
🛑 STOP LOSS (Thief-Style Escape Plan):
Swing Low (5H TF): 143.600 (Adjust based on your risk & lot size!)
Multiple orders? Scale SL wisely—don’t get caught!
🎯 TARGETS:
Main Take-Profit: 151.000 (Or escape earlier if the trap triggers!)
Scalpers: Only play LONG—trail your SL & lock in quick loot!
📢 SCALPERS & SWING TRADERS:
Got deep pockets? Ride the wave now!
Small account? Join the swing heist & rob the trend slowly!
📈 WHY USD/JPY?
Bullish momentum + Macro/Fundamental tailwinds!
COT Report, Sentiment, & Intermarket Analysis all hint at more upside! go ahead to check 👉🔗🌏
⚠️ WARNING: NEWS = VOLATILITY!
Avoid new trades during high-impact news!
Trailing SL = Your best friend! Protect profits & avoid jail (stop-out)!
💥 BOOST THIS IDEA TO SUPPORT THE HEIST!
More boosts = More robberies = More profits for YOU!
Stay tuned—next heist coming soon! 🚀💰
🔥 Like, Share, & Follow for Daily Steals! 🔥

USD/JPY breakthrough & long position? (novice analysis) #techFrom what I've seen so far, USD/JPY has the momentum to try to break through 146.093 and is heading towards 146-147.
The price could make a pullback around the first key level before breaking through, if not, I would anticipate the price making a retracement after breaking through
Hi, I'm not good at trading, and I'm still learning. I explore trading alone myself and also use online free sources to improve. If somewhere mistakes please notify me
Thank you.

USD/JPY Bearish Setup: Target 144.309USD/JPY Technical Analysis (30-Min Chart)
Current Price: 145.157
Chart Pattern: The chart shows a bearish structure forming after a sharp drop from the recent high near 147.9. The price is currently consolidating below a resistance zone.
Key Resistance Zone: ~145.70 – 146.00 (highlighted by the orange box)
Support Zone: ~144.30 (target area)
Bearish Outlook:
The price formed a lower high after the drop from the recent peak, indicating selling pressure.
A potential bearish flag or lower high rejection is forming.
The forecasted path suggests a downward move towards 144.309, aligning with the previous support area.
Conclusion:
The setup favors short positions if the price fails to break above the 145.70–146.00 resistance.
Target remains 144.309, with a break below that possibly opening the way to 143.50.
Watch for price action near the blue zone to confirm the downward continuation.

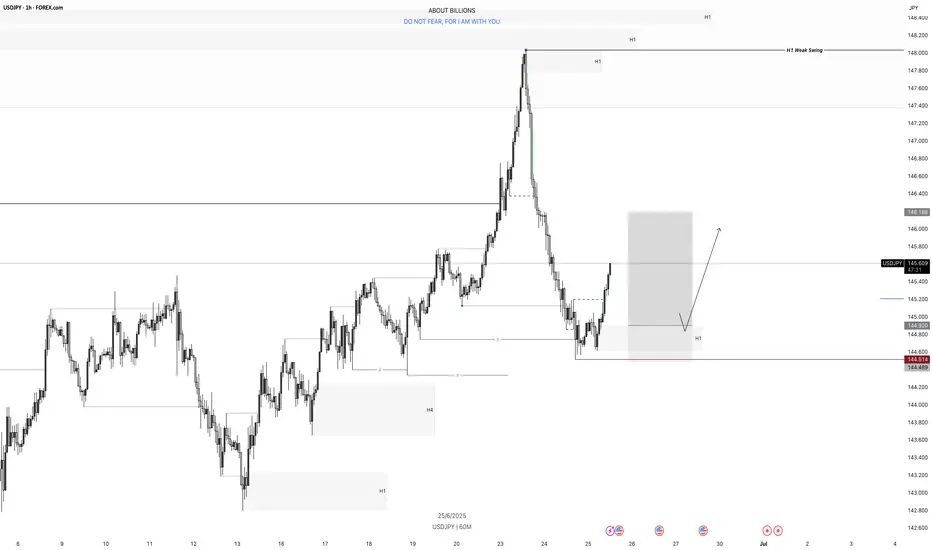
USD/JPY Long projection for the following days.After the sweep of liquidity, and a deeper mitigation of a weak, And of course our CH which is the strongest indication that enough buy orders are absorbed from the market, can indicate that we will see UJ in higher prices.
usdjpy looks to be doing the things its never a long wait if you have it right , lets see if the usd will take over
LONG ON USD/JPYLong on UJ
- Price is respecting a major demand zone after a break and retest
- DXY (Dollar) is bullish
- Yen Bearish

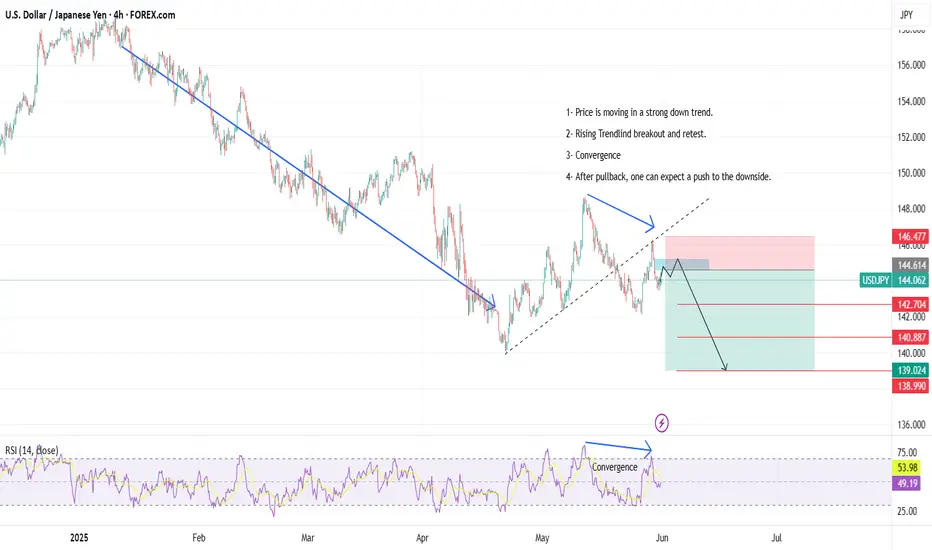
02-06-2025 _ Short Term Bearish Idea _ USDJPY H41- Price is moving in a strong down trend.
2- Rising Trendlind breakout and retest.
3- Convergence
4- After pullback, one can expect a push to the downside.
USDJPY H4 I Bullish Bounce Off Based on the H4 chart analysis, the price is falling toward our buy entry level at 145.45, a pullback support that aligns with the 50% Fib retracement.
Our take profit is set at 146.79 a pullback resistance.
The stop loss is placed at 143.97, an overlap support.
High Risk Investment Warning
Trading Forex/CFDs on margin carries a high level of risk and may not be suitable for all investors. Leverage can work against you.
Stratos Markets Limited (tradu.com ):
CFDs are complex instruments and come with a high risk of losing money rapidly due to leverage. 63% of retail investor accounts lose money when trading CFDs with this provider. You should consider whether you understand how CFDs work and whether you can afford to take the high risk of losing your money.
Stratos Europe Ltd (tradu.com ):
CFDs are complex instruments and come with a high risk of losing money rapidly due to leverage. 63% of retail investor accounts lose money when trading CFDs with this provider. You should consider whether you understand how CFDs work and whether you can afford to take the high risk of losing your money.
Stratos Global LLC (tradu.com ):
Losses can exceed deposits.
Please be advised that the information presented on TradingView is provided to Tradu (‘Company’, ‘we’) by a third-party provider (‘TFA Global Pte Ltd’). Please be reminded that you are solely responsible for the trading decisions on your account. There is a very high degree of risk involved in trading. Any information and/or content is intended entirely for research, educational and informational purposes only and does not constitute investment or consultation advice or investment strategy. The information is not tailored to the investment needs of any specific person and therefore does not involve a consideration of any of the investment objectives, financial situation or needs of any viewer that may receive it. Kindly also note that past performance is not a reliable indicator of future results. Actual results may differ materially from those anticipated in forward-looking or past performance statements. We assume no liability as to the accuracy or completeness of any of the information and/or content provided herein and the Company cannot be held responsible for any omission, mistake nor for any loss or damage including without limitation to any loss of profit which may arise from reliance on any information supplied by TFA Global Pte Ltd.
The speaker(s) is neither an employee, agent nor representative of Tradu and is therefore acting independently. The opinions given are their own, constitute general market commentary, and do not constitute the opinion or advice of Tradu or any form of personal or investment advice. Tradu neither endorses nor guarantees offerings of third-party speakers, nor is Tradu responsible for the content, veracity or opinions of third-party speakers, presenters or participants.

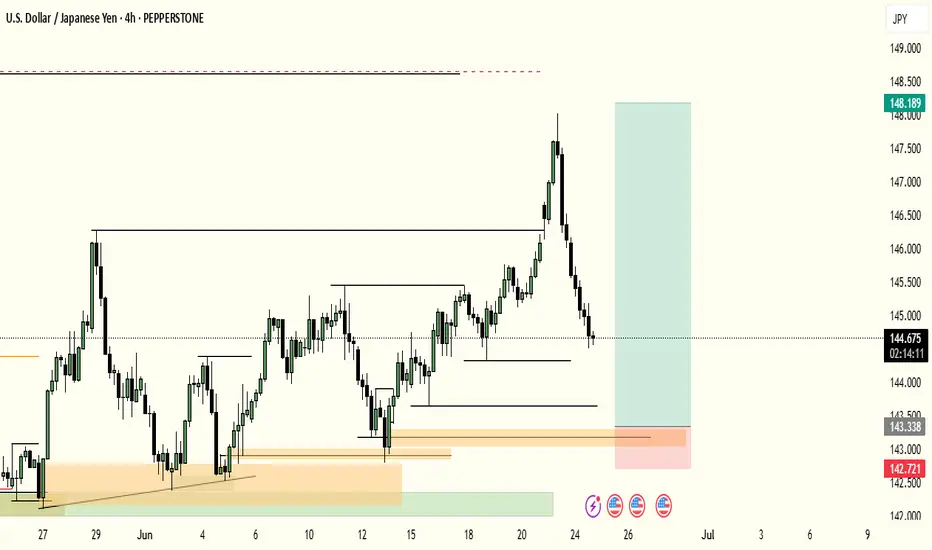
USDJPY Price Breakout Strong Bullish FormedUSDJPY is approaching a retest of the support level after rebounding from a recent wedge breakdown. The pair has reclaimed structure within a broader ascending channel, indicating buyers are stepping in around key levels.
🎯 Potential Target:
If the pair continues to hold above support and breaks minor resistance, the next key upside target is 146.500.
you may find more details in the chart Ps Support with like and comments for better analysis Thanks.

CHECK USDJPY SIGNAL READ CAPTAINusdjpy buy now ✅
entry point (147.000) (146.800)
TAKE PROFIT 1: (147.600)
TAKE PROFIT 2: (148.600)
LAST TARGET(149.600)
STOP LOSS (145.800)

Possible Sells on USDJPY Patiently waiting for price to get into my M15 Order Block then I'll enter a sell

USDJPYLooking at this chart after I just did the EURJPY analysis, now this one looks more bullish than bearish BUT that's only if there is a breakout from the supply zone which Im assuming will give us a consolidation first before it shoots straight up to complete Wave 5. At the completion of Wave 5, we can expect the drop again as a correction and retest, which should usher in more buyers to form a Cup and Holder pattern. I really see the JPY being stronger than USD futuristically and practically.

USD/JPY 15M CHART PATTERNHere’s a breakdown and analysis of your USDJPY SELL trade setup on the 15-minute timeframe:
---
Trade Details:
Entry: 147.280 (Short)
Stop Loss (SL): 147.998 (≈71.8 pips risk)
Targets:
T1: 146.960 (≈32 pips)
T2: 146.600 (≈68 pips)
T3: 146.019 (≈126 pips)
---
Risk/Reward Ratios:
Target Reward (pips) R:R Ratio
T1 32 ~0.45:1
T2 68 ~0.95:1
T3 126 ~1.75:1
---
Quick Technical Evaluation (Assuming standard price behavior):
Entry near local high? If yes, solid idea to sell after rejection/candle confirmation.
SL Placement: 147.998 is quite wide—possibly above a recent high or resistance zone.
T1 is relatively close, offering a partial TP level but low reward/risk.
T2 provides near 1:1 R:R, which is more balanced.
T3 is aggressive and may require a strong bearish continuation or news catalyst.
---
Suggestions:
1. Adjust SL? – If the 147.998 level isn’t key resistance, consider tightening it closer to the swing high (e.g., 147.400–147.500) to improve R:R.
2. Scaling Out – Consider closing part of the position at T1 or T2, then letting the rest run to T3.
3. Monitor Price Action – On the 15m chart, look for bearish continuation (e.g., lower highs, bearish engulfing, MACD crossover, etc.).

USDJPY SELL OPPORTUNITY Am selling a sell trade coming on USDJPY
Entry: 148.570
Stoploss: 148:800
Take profit: 145.300
Comment your opinion pls 🙏
For fund management. DM now on X @shajudeakinoba1

USDJPY Short: 61.8% retracementHi, a simple reason to short: 61.8% retracement. Stop above 144.44.
Thank you.

USDJPYUSDJPY is currently approaching a major breakout zone as it nears the apex of a symmetrical triangle pattern. The pair has broken above the key horizontal resistance area around 145.80–146.00, which previously acted as a strong supply zone. Price is now challenging the descending trendline resistance.
A confirmed breakout and retest of the triangle and resistance zone may open the door for a bullish continuation toward 147.50, and potentially 150.00+, as marked on the chart. However, if the breakout fails, we may see a pullback toward the 145.00–144.80 support region before any further upside.
This setup highlights a potential breakout-retest-continuation scenario. Traders should watch for price action confirmation near the trendline for further direction.

USDJPY: Ready for Wave 5?USDJPY is showing a strong bullish wave structure, with a clear path toward higher levels based on Elliott Wave Theory. After a successful breakout from a multi-year consolidation, price action appears to be completing a Wave (4) correction thereby setting the stage for a Wave (5) rally.
Based on the bullish structure and projected continuation:
1st Target = 157.78
2nd Target = 177.41
Final Target = 209.16 Full wave extension, top of macro channel
With support holding above ¥140.00 and a bullish bounce forming, this could mark the Wave C bottom of (4), setting the stage for the next major leg up.
Disclaimer:
This analysis is for informational and educational purposes only and does not constitute financial advice. Markets are dynamic and unpredictable.

Short term sell into buying zone.USDJPY is at a prime zone... Where everyone is glued and carried away with the bullish move, let me point you out to the market structure.

USD/JPY 2-Hour Forex Chart2-hour performance of the U.S. Dollar (USD) against the Japanese Yen (JPY) from FOREX.com, showing a current exchange rate of 145.498 with a decrease of 0.661 (-0.45%). The chart highlights a recent sharp decline, with a shaded area indicating a potential support or resistance zone around 145.000 to 146.047. Key levels include 144.721 (support) and 146.047 (resistance), with the price movement tracked over the past two hours.
