USDJPY Wave Analysis – 7 July 2025
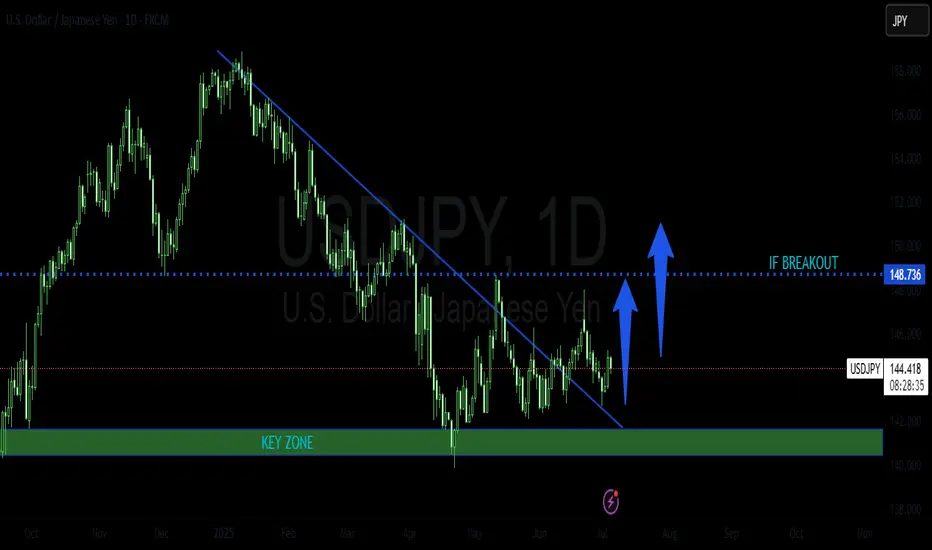
- USDJPY reversed from long-term support level 142.50
- Likely to rise to resistance level 148.00
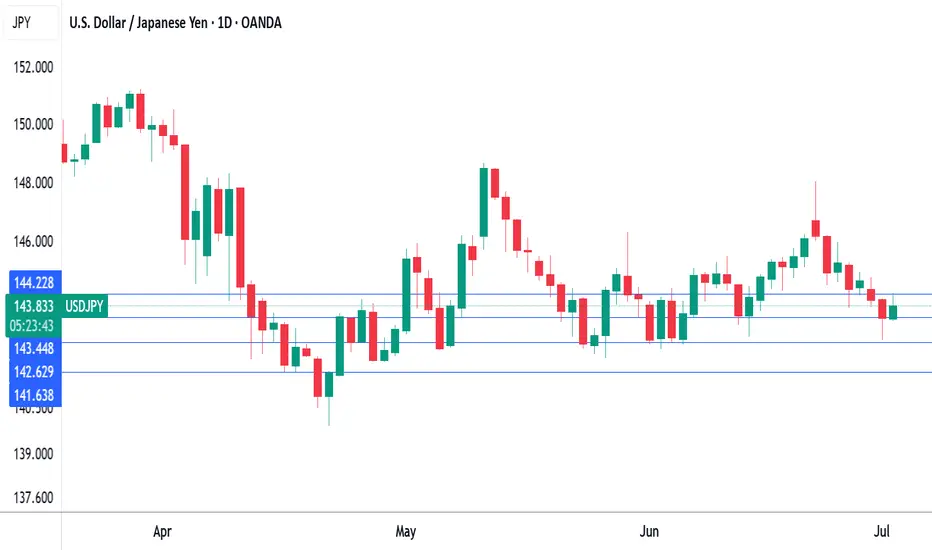
USDJPY currency pair recently reversed up from the support zone located between the long-term support level 142.50 (which has been steadily reversing the price from August of 2024, as can be seen from the daily USDJPY chart below) and the lower daily Bollinger Band.
The upward reversal from this support zone stopped the previous short-term ABC correction 2 from the end of June.
Given the strength of the support level 142.50 and the strongly bearish yen sentiment seen today, USDJPY currency pair can be expected to rise to the next resistance level 148.00 (top of the previous waves 4, (1) and 1).
USDJPY_SPT trade ideas

Japan Seeks US Deal as Tariff Deadline NearsThe yen hovered around 145 per dollar Friday after a nearly 1% drop in the previous session, pressured by trade uncertainties as Tokyo seeks a deal with Washington before next week’s deadline. Trump may announce new tariffs or extend deadlines today, having previously threatened tariffs up to 35% on Japanese goods over low US rice and car imports.
The yen also weakened as a stronger US dollar followed a better June jobs report, easing recession fears and reducing near-term Fed cut chances. In Japan, May household spending grew more than forecast, supported by government efforts to increase demand.
The key resistance is at $145.35, meanwhile the major support is located at $143.55.

USDJPY LONGMarket structure bullish on HTFs DH
Entry at both Weekly and Daily AOi
Weekly Rejection at AOi
Daily Rejection At AOi
Previous Structure point Daily
Around Psychological Level 144.000
H4 Candlestick rejection
Rejection from Previous structure
Levels 2.91
Entry 95%
REMEMBER : Trading is a Game Of Probability
: Manage Your Risk
: Be Patient
: Every Moment Is Unique
: Rinse, Wash, Repeat!
: Christ is King.

USDJPY Is Bullish! Buy!
Take a look at our analysis for USDJPY.
Time Frame: 1h
Current Trend: Bullish
Sentiment: Oversold (based on 7-period RSI)
Forecast: Bullish
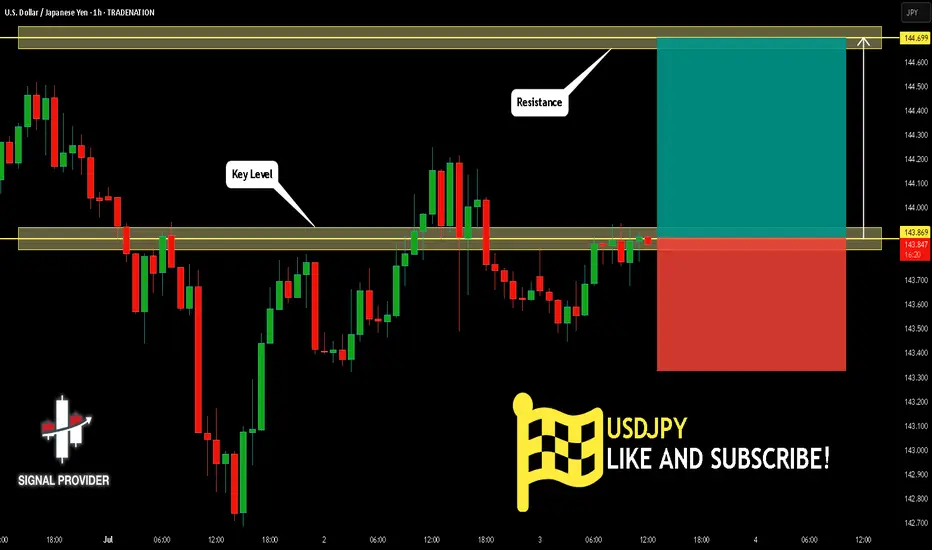
The market is on a crucial zone of demand 143.869.
The oversold market condition in a combination with key structure gives us a relatively strong bullish signal with goal 144.699 level.
P.S
We determine oversold/overbought condition with RSI indicator.
When it drops below 30 - the market is considered to be oversold.
When it bounces above 70 - the market is considered to be overbought.
Disclosure: I am part of Trade Nation's Influencer program and receive a monthly fee for using their TradingView charts in my analysis.
Like and subscribe and comment my ideas if you enjoy them!
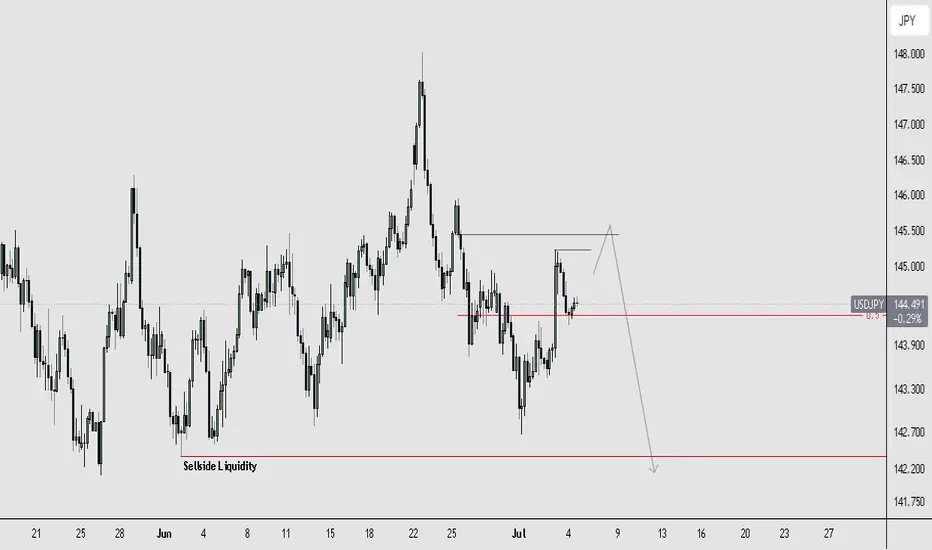
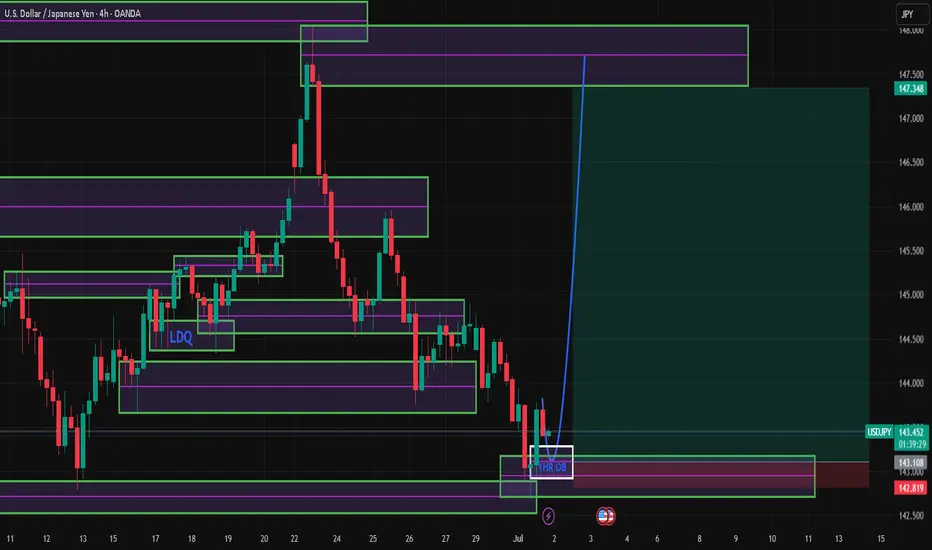
USDJPY BEARISH SETUPI am expecting price to raid the buyside liquidity resting above the previous week high. This area coincides with a Bearish Order Block (OB) that I have marked as the ideal zone for price to reverse from.
Execution Outlook:
Bias: Bearish
Short-Term Expectation: Price to push higher to raid buyside liquidity and tap into the OB.
Trigger Zone: OB above the 50% level – this is where I expect the reversal.
Target: Sell-side liquidity below the recent swing lows (~142.200 area).
Invalidation: A clean break and close above the OB would invalidate the bearish idea.
LONG ON USD/JPYUSD/JPY has given us a CHOC (change of character) from down to up.
It has engineered sell side liquidity right above a demand zone.
I expect price to sweep sell side liquidity, tap into the demand zone then take off to the upside.
looking to catch 150-250 pips on UJ. (Economic News could set this trade on Fire!)

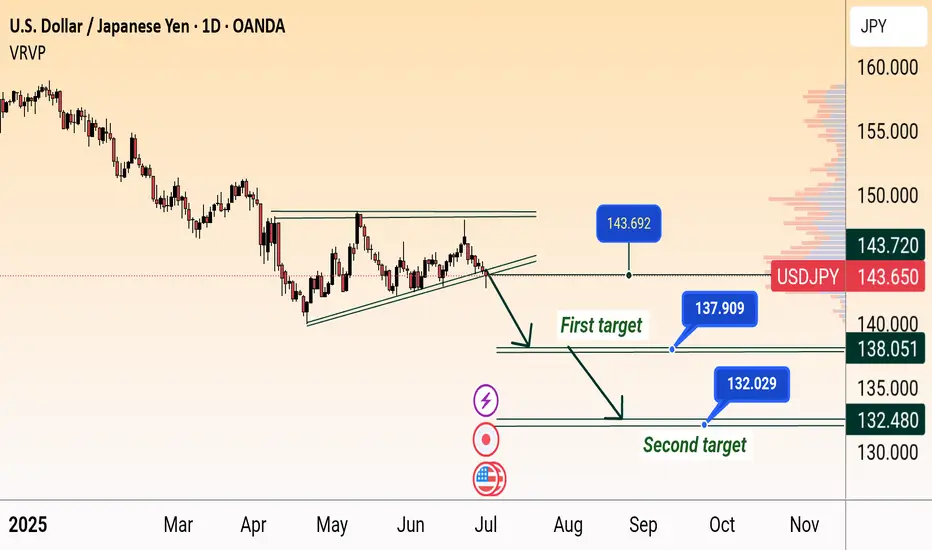
USD/JPY Bearish Breakdown Targets 138 & 132USD/JPY Bearish Breakdown Setup (Daily Chart)
USD/JPY breaks below rising wedge support near 144, signaling potential downside. Price targets are marked at 138.051 (first target) and 132.480 (second target), indicating possible continued weakness if the bearish momentum holds.
USDJPY Is Very Bullish! Buy!
Here is our detailed technical review for USDJPY.
Time Frame: 1D
Current Trend: Bullish
Sentiment: Oversold (based on 7-period RSI)
Forecast: Bullish
The market is approaching a significant support area 144.493.
The underlined horizontal cluster clearly indicates a highly probable bullish movement with target 148.651 level.
P.S
Overbought describes a period of time where there has been a significant and consistent upward move in price over a period of time without much pullback.
Disclosure: I am part of Trade Nation's Influencer program and receive a monthly fee for using their TradingView charts in my analysis.
Like and subscribe and comment my ideas if you enjoy them!

USDJPY POSSIBLE LONG TRADE PLANThe pair has been trading in a bearish trend for sometime now. It has recently rejected near a key zone and broke out a falling trend line. It looks like it is now retesting this zone before initiating a bull movement.
Please do your own analysis before placing any trades.
Cheers and happy trading !!!
Trump threatens tariff on Japan as deadline looms, yen dipsThe Japanese yen is negative ground on Thursday. In the North American session, USD/JPY is trading at 144.06, up 0.47%.
The US and Japan are racing to reach a trade deal before a deadline of July 9. There are some serious roadblocks to a deal, including the current US tariff of 25% on Japanese cars and opening Japan's agricultural sector, particularly rice. President Trump has insisted that Japan import American-grown rice, but the Japanese government says that is unacceptable.
Japan's Economy Minister Ryosei Akawaza said earlier this week that Japan would not "sacrifice the agricultural sector", while Farm Minister Shinjiro Koizumi said that foreign rice imports would threaten Japan's food security.
It's a shortened week in the US due to the Fourth of July holiday on Friday. The US will release the June employment report on Thursday, with all eyes on nonfarm payrolls.
Nonfarm payrolls eased slightly in May to 137 thousand from 147 thousand and the downward trend is expected to continue, with a consensus of 110 thousand for June. This would mark the weakest pace of job growth since 2020, with the exception of a meltdown in job growth in Oct. 2024.
The Federal Reserve will also be monitoring the nonfarm payroll report. The US labor market has been weakening and the Fed is concerned that the jobs market could show a sharp deterioration. Currently, the most likely date for the next Fed rare cut is September, but a soft NFP reading south of 90 thousand would boost the case for a cut at the July 30 meeting.
The Fed has maintained a wait-and-see stance since Nov. 2024 but that is expected to change in the fourth quarter, where we could see up three rate cuts.
USDJPY 4-Hour Technical Analysis (Smart Money Concept Breakdown)📈 Overall Market Structure Overview:
The chart reflects a multi-phase Smart Money playbook, consisting of:
Bullish channel structure
Breakout followed by liquidity sweep
Supply zone flip to demand
Price mitigation and structure shift
Anticipated reaction zone for upcoming move
🔎 Phase-by-Phase Analysis:
🧱 1. Ascending Channel Formation
Price was moving upward in a controlled bullish ascending channel, suggesting institutional accumulation with planned distribution above highs.
The channel breakout was the first significant liquidity event, where early breakout traders were baited.
💧 2. Fakeout and Supply Interchange into Demand (Ellipse Zone)
Once the channel broke, price sharply reversed, retracing into a previous supply zone.
However, institutions defended this zone, flipping it into a demand area.
This behavior, marked with the blue ellipse, signals “Supply Interchange in Demand” – a core SMC concept.
Here, orders were absorbed
Liquidity was trapped below
A bullish push confirmed institutional intent
🎯 3. Previous Target Hit – Completion of Bullish Leg
Price made a strong rally from the demand zone, hitting the previous target near 147–148 zone.
This bullish leg created a Major Break of Structure (BOS) confirming bullish dominance at that phase.
⚠️ 4. Distribution Begins: Shift in Momentum
After reaching the Major BOS area, price failed to hold higher levels.
A decline followed, indicating distribution by smart money.
The reaction was sharp and consistent, creating lower highs, signaling weakness.
🔄 5. Minor CHoCH Formation – Early Reversal Signal
A Minor Change of Character (CHoCH) occurred around the 144.000–143.000 area.
This is a key transition, where smart money transitions from bullish intent to potential bearish delivery.
📦 6. Next Target Zone – Bullish POI (Point of Interest)
The chart identifies a next target demand zone around 141.800–141.200, marked in green.
This zone:
Holds unmitigated demand
Sits below a recent liquidity pool
Aligns with past support
This is where Smart Money could re-enter, offering a long opportunity if a bullish CHoCH or BOS forms from that zone.
📊 Trade Scenarios & Forecast:
🔻 Bearish Short-Term Play (Sell Setup):
If price respects current resistance (144.500–145), and a lower high forms:
Short entry opportunity
Target: 142.000–141.200 demand zone
Confirmation: Strong bearish candle, CHoCH below minor support
🔺 Bullish Reversal Play (Buy Setup):
At the demand zone:
Look for bullish reaction + CHoCH or BOS
Long entry potential
Target: Retest of 144.000 or even 147.000 if liquidity allows
🔐 Smart Money Tactics in Play:
Liquidity Engineering:
Price trapped both bulls (at highs) and bears (below ellipse zone)
Supply into Demand Flip:
A classic trap where supply becomes a launchpad for bullish delivery
Minor CHoCH:
Early signal of intent change
Next POI (Point of Interest):
Potential reaccumulation zone below major liquidity grab
🧠 Educational Takeaway:
This analysis illustrates:
Why breakouts are often traps without confirmation
How to identify real institutional zones
The role of CHoCH/BOS in planning ahead
Importance of waiting for price to come to your levels, not chasing
⚠️ Risk & Caution:
News catalysts can cause deviation from technical levels
Always use stop loss and proper risk management
SMC is about patience and precision, not prediction
✅ Summary:
USDJPY is showing early signs of a smart money distribution and a potential pullback toward demand.
Watch closely for confirmation at the key zone (141.800–141.200) before engaging long. Until then, short setups on rallies may be favorable.

USDJPY Analysis – Bullish Continuation After Minor PullbackUSDJPY is currently trading around 143.340, and I anticipate a minor pullback into the 143.296 zone, which aligns with a possible bullish order block and discount zone on the H1/H4 timeframe.
This short-term dip could serve as a liquidity sweep or mitigation before price resumes its bullish trend, targeting the 147.381 level — a key area of interest tied to previous highs and potential liquidity above.
I’ll be watching for bullish confirmation (e.g., clean W-pattern, bullish engulfing candle, or break of internal structure) from the 143.296 zone before taking long entries.
🔻 Short-term expectation: Pullback to 143.296
🔼 Primary bias: Bullish continuation
🎯 Upside target: 147.381
📍 Current price: 143.340
📌 Risk Management Reminder: This is not financial advice. Always apply proper risk management:
✔️ Use a minimum of 1:2 RR setups
✔️ Risk no more than 1–2% of your capital per trade
✔️ Wait for clear confirmation before entering
✔️ Protect your account — preservation over prediction
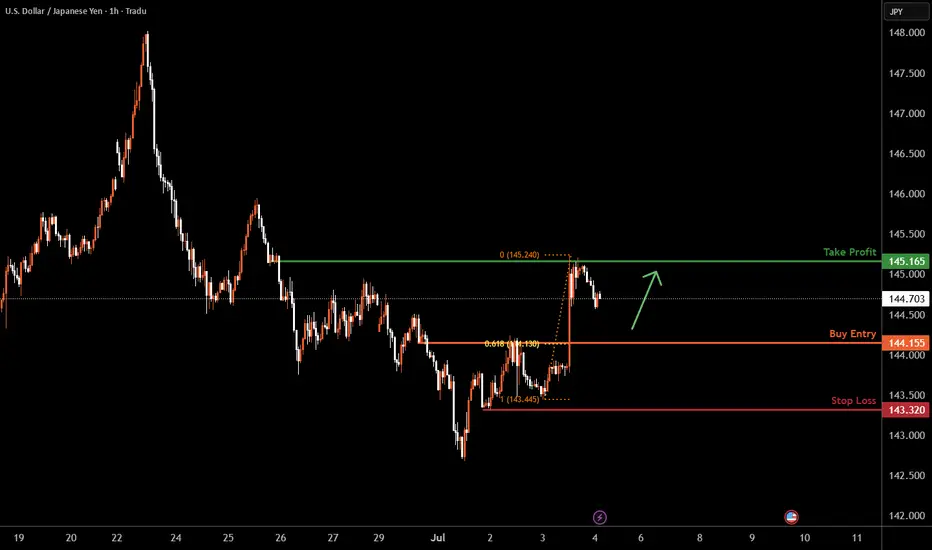
USDJPY H1 I Bullish Bounce off the 61.8% FibBased on the H1 chart analysis, the price is falling our buy entry level at 144.15, a pullback support that aligns with the 61.8% Fib retracement.
Our take profit is set at 145.16, an overlap resistance.
The stop loss is placed at 143.32, a swing low support.
High Risk Investment Warning
Trading Forex/CFDs on margin carries a high level of risk and may not be suitable for all investors. Leverage can work against you.
Stratos Markets Limited (tradu.com ):
CFDs are complex instruments and come with a high risk of losing money rapidly due to leverage. 63% of retail investor accounts lose money when trading CFDs with this provider. You should consider whether you understand how CFDs work and whether you can afford to take the high risk of losing your money.
Stratos Europe Ltd (tradu.com ):
CFDs are complex instruments and come with a high risk of losing money rapidly due to leverage. 63% of retail investor accounts lose money when trading CFDs with this provider. You should consider whether you understand how CFDs work and whether you can afford to take the high risk of losing your money.
Stratos Global LLC (tradu.com ):
Losses can exceed deposits.
Please be advised that the information presented on TradingView is provided to Tradu (‘Company’, ‘we’) by a third-party provider (‘TFA Global Pte Ltd’). Please be reminded that you are solely responsible for the trading decisions on your account. There is a very high degree of risk involved in trading. Any information and/or content is intended entirely for research, educational and informational purposes only and does not constitute investment or consultation advice or investment strategy. The information is not tailored to the investment needs of any specific person and therefore does not involve a consideration of any of the investment objectives, financial situation or needs of any viewer that may receive it. Kindly also note that past performance is not a reliable indicator of future results. Actual results may differ materially from those anticipated in forward-looking or past performance statements. We assume no liability as to the accuracy or completeness of any of the information and/or content provided herein and the Company cannot be held responsible for any omission, mistake nor for any loss or damage including without limitation to any loss of profit which may arise from reliance on any information supplied by TFA Global Pte Ltd.
The speaker(s) is neither an employee, agent nor representative of Tradu and is therefore acting independently. The opinions given are their own, constitute general market commentary, and do not constitute the opinion or advice of Tradu or any form of personal or investment advice. Tradu neither endorses nor guarantees offerings of third-party speakers, nor is Tradu responsible for the content, veracity or opinions of third-party speakers, presenters or participants.
USD/JPY) Back support level Read The captionSMC trading point update
Technical analysis of USD/JPY pair using a combination of price action, resistance/support levels, and indicators. Here's a breakdown of the idea behind the analysis:
---
Chart Breakdown (2H - USD/JPY)
1. Key Zones:
Resistance Level (Yellow Box at Top):
Price has previously been rejected from this zone multiple times.
Recent bearish wicks and aggressive sell-offs are marked by red arrows—showing strong seller interest.
Support Level / Target Point (Bottom Yellow Box):
Price has found strong buying interest around 142.142.
This zone is the anticipated downside target if the bearish scenario plays out.
2. Bearish Bias Justification:
Liquidity Grab / Fakeout (labeled “fug”):
The price briefly broke above the smaller resistance block but quickly reversed.
This "fake breakout" often traps buyers, strengthening the bearish case.
EMA 200 (Blue Line):
Price is currently near or slightly under the 200 EMA (144.553), suggesting a potential rejection area aligning with resistance.
RSI Indicator:
RSI shows divergence and has not confirmed a bullish breakout.
The values (56.77 and 42.82) indicate loss of bullish momentum.
3. Projection (Black Lines):
The black zig-zag lines represent a forecasted drop to the support level.
Suggests a short setup near 144.50–145.00 with targets near 142.14.
Mr SMC Trading point
---
Summary:
Bias: Bearish
Entry Zone: Near resistance area (144.50–145.00)
Target: 142.142 (support zone)
Invalidation: Strong break above 145.00 and hold
Confirmation: Rejection from resistance with bearish candle pattern
---
Please support boost 🚀 this analysis)

Forecast USDJPY Disclaimer:
This is not financial advice, and I do not encourage anyone to follow my analysis blindly. I’m simply sharing my personal market view based on my strategy, experience, and interpretation of the data.
Everyone is responsible for their own decisions.
The USD/JPY market has likely just exited
its accumulation phase after several weeks of quiet consolidation. What we’re seeing now is a clear buy-side manipulation orchestrated by major players. Despite weak fundamentals for the dollar — disappointing NFP, rising unemployment, and a slowdown in services — price exploded to the upside, trapping early sellers and drawing in retail buyers through a false breakout.
Technically, the market is overbought on H1 and H4, with a hidden bearish divergence extending all the way from the historical highs of 1971, combined with a confirmed bearish reversal divergence on the weekly chart. On top of that, institutional speculators (COT data) are heavily short USD/JPY, reinforcing the idea that this rally is not genuine but engineered for liquidity grabs.
I’m not rushing in. I’m waiting for 146.00, a key psychological and structural level where this manipulation could reach its peak. That zone would likely mark the end of the fake bullish move and the beginning of a real distribution phase. All signals — technical, macro, and behavioral — are aligned. This could be one of the best short opportunities on USD/JPY in months.

Sell USDJPYFor the first time, I have done some fundamental analysis. Last time NFP release was on a Thursday due to Bank Holiday was July 2020 where the USD gained on the news release but later gave up the gains. I am expecting a pullback

USD/JPY and what’s expected from the NFP?The USD/JPY hasn't dropped like the other dollar crossed yet, but could we potentially see a clean break down below 142.50 support? Well, we will need to see a big miss on the NFP print for that to potentially happen.
The consensus is for a 110K increase in non-farm payrolls, but recent data has been less than convincing. The ADP private payrolls figure released yesterday registered its first decline in over a year, stoking concerns that today’s number might fall short of expectations — potentially even slipping below 100K.
On the unemployment front, a slight uptick to 4.3% is anticipated, up from 4.2%, while Average Hourly Earnings are seen rising 0.3% month-on-month vs. 0.4% increase the month before.
By Fawad Razaqzada, market analyst with FOREX.com

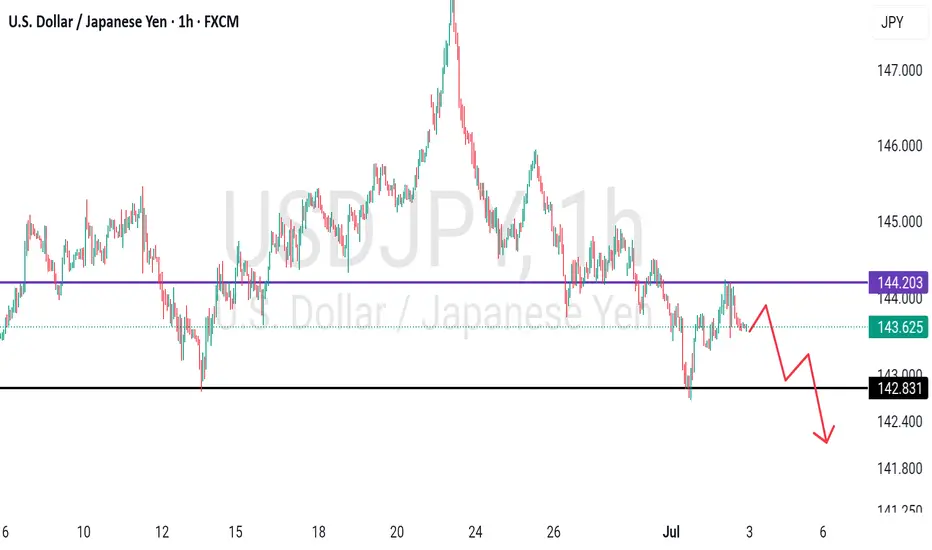
USDJPY previous support, now resistance at 144.80The USDJPY pair is currently trading with a bearish bias, aligned with the broader downward trend. Recent price action shows a retest of the resistance zone, suggesting a temporary relief rally within the downtrend.
Key resistance is located at 144.80, a prior consolidation zone. This level will be critical in determining the next directional move.
A bearish rejection from 144.80 could confirm the resumption of the downtrend, targeting the next support levels at 142.90, followed by 142.30 and 141.20 over a longer timeframe.
Conversely, a decisive breakout and daily close above 144.80 would invalidate the current bearish setup, shifting sentiment to bullish and potentially triggering a move towards 145.45, then 146.30.
Conclusion:
The short-term outlook remains bearish unless the pair breaks and holds above 144.80. Traders should watch for price action signals around this key level to confirm direction. A rejection favours fresh downside continuation, while a breakout signals a potential trend reversal or deeper correction.
This communication is for informational purposes only and should not be viewed as any form of recommendation as to a particular course of action or as investment advice. It is not intended as an offer or solicitation for the purchase or sale of any financial instrument or as an official confirmation of any transaction. Opinions, estimates and assumptions expressed herein are made as of the date of this communication and are subject to change without notice. This communication has been prepared based upon information, including market prices, data and other information, believed to be reliable; however, Trade Nation does not warrant its completeness or accuracy. All market prices and market data contained in or attached to this communication are indicative and subject to change without notice.

Fundamental Market Analysis for July 3, 2025 USDJPYEvent to pay attention to today:
15:30 EET. USD - Non-Farm Employment Change
15:30 EET. USD - Unemployment Rate
15:30 EET. USD - Unemployment Claims
17:00 EET. USD - ISM Services PMI
The Japanese Yen (JPY) traded with a slight positive bias against the bearish US Dollar (USD) during the Asian session on Thursday and remains near the near one-month peak reached earlier this week. Despite the Bank of Japan's (BoJ) hesitation to hike rates, investors seem convinced that the central bank will remain on the path of normalizing monetary policy amid rising inflation in Japan. This is a significant divergence from the stance of other major central banks (including the U.S. Federal Reserve (Fed)), which are leaning towards a softer approach, and is favorable for lower JPY yields.
Meanwhile, US President Donald Trump hinted at a possible end to trade talks with Japan, and also threatened new tariffs against Japan over its perceived reluctance to buy American-grown rice. This, along with the overall positive tone towards risk, is a headwind for the safe-haven yen. In addition, traders seem reluctant and prefer to take a wait-and-see approach ahead of today's release of the closely watched US Non-Farm Payrolls (NFP) report. The crucial data will play a key role in influencing the US Dollar (USD) and will give a significant boost to the USD/JPY pair.
Trade recommendation: BUY 144.00, SL 143.00, TP 145.40

Usdjpy 4Hr chart Analaysis The USD/JPY pair appears to be forming a potential reversal pattern, suggesting a shift from bullish to bearish momentum. The key level of 148.55 is anticipated to act as a turning point, with price potentially heading down toward the 141.647 support area in the near term.

USDJPY TRADE USDJPY has dropped. We're clear to the downside.
All we need to do is to manage our trade to maximize profits.

USDJPY: Bearish Trend Remains in ControlUSDJPY continues to follow a clear downtrend on the H4 chart, respecting a descending trendline and forming consistent lower highs. The strong rejection at 144.800 and the presence of multiple FVGs further reinforce the bearish structure.
Price is currently retracing to test the FVG zone. If rejection occurs here, the downtrend could resume towards the 141.900 support level.
Trade Setup:
Sell near 144.700
TP: 141.900
SL: above 145.300
Supporting News:
"Risk-on" sentiment is back after strong manufacturing data from China and rising expectations that U.S. interest rates may soon peak, weakening the USD against the JPY.
Are you watching for a short setup like I am?

USDJPY - placed reasonable high? What's next??#USDJPY.. market placed 144.20-25 day high in yesterday and that is a very reasonable high.
If market hold it in that case we can expect drop from here.
Don't be lazy here.
Good luck
Trade wisely