NZDUSD Potential UpsidesHey Traders, in today's trading session we are monitoring NZDUSD for a buying opportunity around 0.59200 zone, NZDUSD is trading in an uptrend and currently is in a correction phase in which it is approaching the trend at 0.59200 support and resistance area.
Trade safe, Joe.
Related currencies

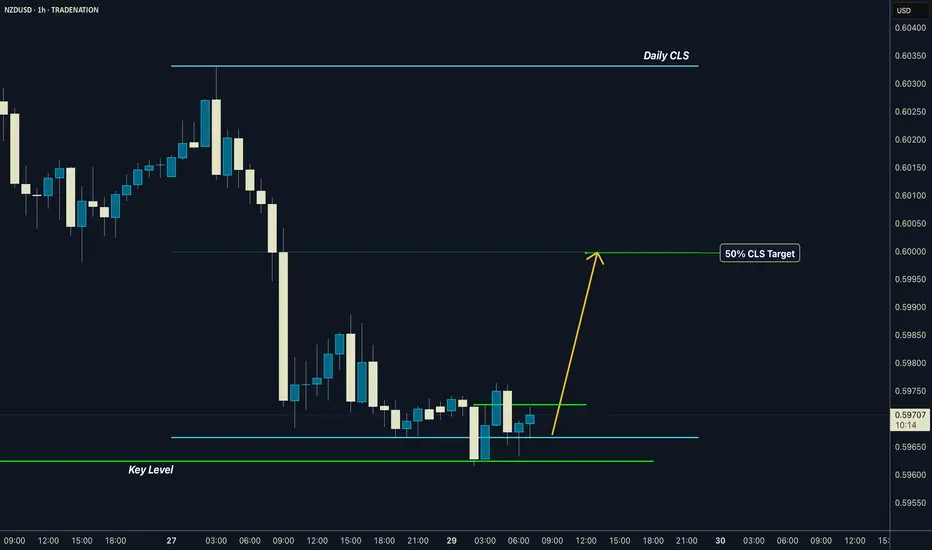
NZDUSD | Daily CLS I Model 1 I 50% CLS TargetHey, Market Warriors ⚔️
Fresh outlook drop — if you’ve been riding with me, you already know:
🎯My system is 100% mechanical. No emotions. No trend lines. No subjective guessing. Just precision, structure, and sniper entries.
🧠 What’s CLS?
It’s the real smart money. The invisible hand behind $7
NZDUSD SELL SETUPWaiting patiently for this on NZDUSD no much movements in the market this week, remember FOMC is coming today - Be watchful

The next NZD Bullish up leg looks ready.NZD has been in a side ways consolidation period for weeks now but as channel support, Weekly 50 MA, Daily 200 MA, 38.2% fib of first up leg all line up, could this be the start of the next big move.

NZDUSD H4 | Bearish drop off 50% Fibonacci resistanceNZD/USD is rising towards the sell entry, which serves as a pullback resistance and could potentially reverse lower.
Sell entry is at 0.5941, which is a pullback resistance.
Stop loss is at 0.5978, which is a pullback resistance that lines up with the 50% Fibonacci retracement.
Take profit is at

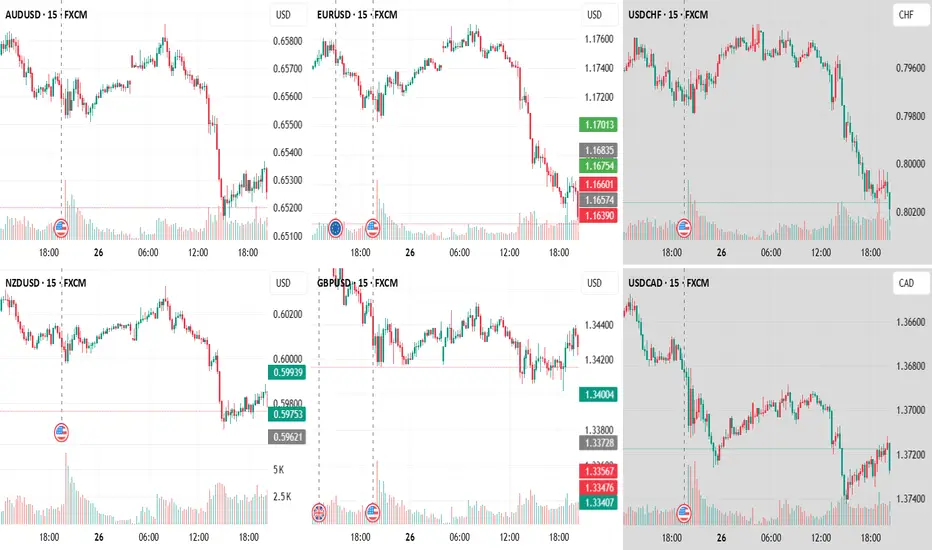
looking at usd groupnzdusd seems to be going up. with sister pair audusd and usdcad
+ usd showing immediate strength
- going up movement slow
- previous down is very strong
waiting the sellers to die out
Seeking the nearest Sell SideThe image speaks for itself
this is an ict concept idea and from experience work that I have done over 7yrs

NZDUSD ShortNZDUSD is not net short on the regression break.
I am considering this trade, but it has already gone a long way.

LONG ON NZD/USDNZD/USD is at a major demand level.
Dollar is bearish. Economic News this afternoon should assist and pushing this pair up.
Looking to catch 200 pips to the previous high.

NZDUSD BUY SETUP LOOOOOOOONGHELLO
we have demand and ascending channel 4h
and low time frame the price make engulfing candle on 30m 15m on support zone
and can't make lower low so i will buy it

See all ideas
Summarizing what the indicators are suggesting.
Oscillators
Neutral
SellBuy
Strong sellStrong buy
Strong sellSellNeutralBuyStrong buy
Oscillators
Neutral
SellBuy
Strong sellStrong buy
Strong sellSellNeutralBuyStrong buy
Summary
Neutral
SellBuy
Strong sellStrong buy
Strong sellSellNeutralBuyStrong buy
Summary
Neutral
SellBuy
Strong sellStrong buy
Strong sellSellNeutralBuyStrong buy
Summary
Neutral
SellBuy
Strong sellStrong buy
Strong sellSellNeutralBuyStrong buy
Moving Averages
Neutral
SellBuy
Strong sellStrong buy
Strong sellSellNeutralBuyStrong buy
Moving Averages
Neutral
SellBuy
Strong sellStrong buy
Strong sellSellNeutralBuyStrong buy
Displays a symbol's price movements over previous years to identify recurring trends.
Frequently Asked Questions
The current rate of USDNZD is 1.6935 NZD — it has increased by 0.18% in the past 24 hours. See more of USDNZD rate dynamics on the detailed chart.
The value of the USDNZD pair is quoted as 1 USD per x NZD. For example, if the pair is trading at 1.50, it means it takes 1.5 NZD to buy 1 USD.
The term volatility describes the risk related to the changes in an asset's value. USDNZD has the volatility rating of 0.45%. Track all currencies' changes with our live Forex Heatmap and prepare for markets volatility.
The USDNZD showed a 1.90% rise over the past week, the month change is a 2.78% rise, and over the last year it has increased by 0.75%. Track live rate changes on the USDNZD chart.
Learn how you can make money on rate changes in numerous trading ideas created by our community.
Learn how you can make money on rate changes in numerous trading ideas created by our community.
USDNZD is a major currency pair, i.e. a popular currency paired with USD.
Currencies are usually traded through forex brokers — choose the one that suits your needs and go ahead. You can trade USDNZD right from TradingView charts — just log in to you broker account. Check out the list of our integrated brokers and find the best one for your needs and strategy.
When deciding to buy or sell currency one should keep in mind many factors including current geopolitical situation, interest rates, and other. But before plunging into a deep research, you can start with USDNZD technical analysis. The technical rating for the pair is buy today, but don't forget that markets can be very unstable, so don't stop here. According to our 1 week rating the USDNZD shows the buy signal, and 1 month rating is buy. See more of USDNZD technicals for a more comprehensive analysis.