USDZAR Bullish ideaAs we can see this is our USDZAR quarterly shift idea were we are anticipating price to rally to the upside toward our draw on liquidity objectives. We had a weekly volume imbalance and monthly mean threshold order block show us support after we took out major liquidity points. We also showed more s
About U.S. Dollar / South African Rand
The U.S. Dollar vs. the South African Rand. The Rand was and became legal tender in the late 50’s to early 60’s for South Africa, Swaziland, Lesotho and Namibia after moving away from the Pound. After the apartheid era sanctions the Rand experienced a great deal of volatility and depreciation.
Related currencies

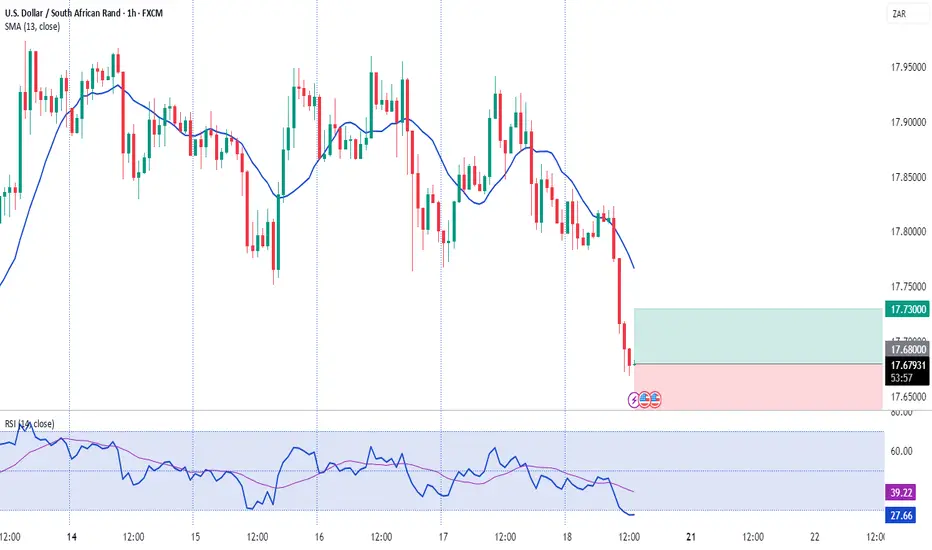
USDZAR Support CallingUSDZAR will short towards the support area at 17,73. Currently price is showing strong bearish reversal signs. Sells active from 19,91 to 17,73

USDZAR-BUY strategy - RANGE 3 hourly chartThe pair is still within a wider range, and it feels we may remain so for a little longer. The direction feels moving higher again with cloud suport 17.7300 area, and i mproving indicators.
Strategy BUY @ 17.7875-17.8350 and take profit near 17.9875 for now.
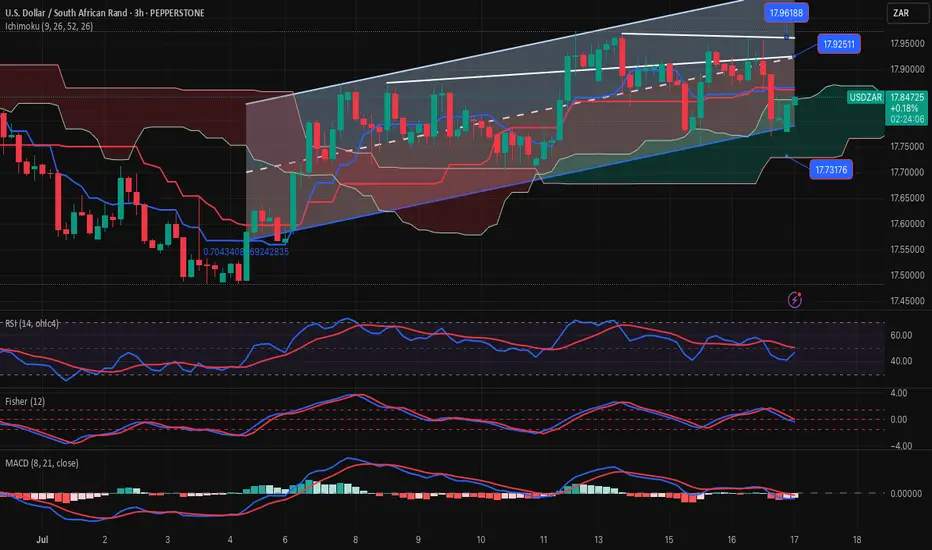
USDZAR-BUY strategy 3 houely chart Reg. ChannelThe pair seems to show some strength, and think we have a chance to test 17.9150 again in the short-term. The indicators provide support as long as 17.6900 is not violated on a close.
Strategy BUY @ 17.7350-17.7550 and take profit near 17.8875.

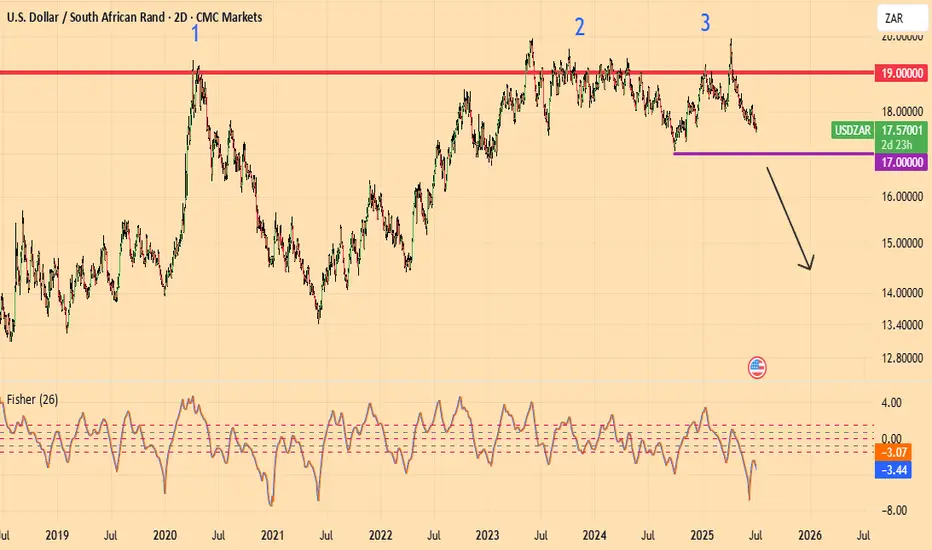
USDZAR SELLSUSDZAR price is stuck in consolidation. Price action has printed a triple top pattern indicating a strong sell signal towards the support at 17,74

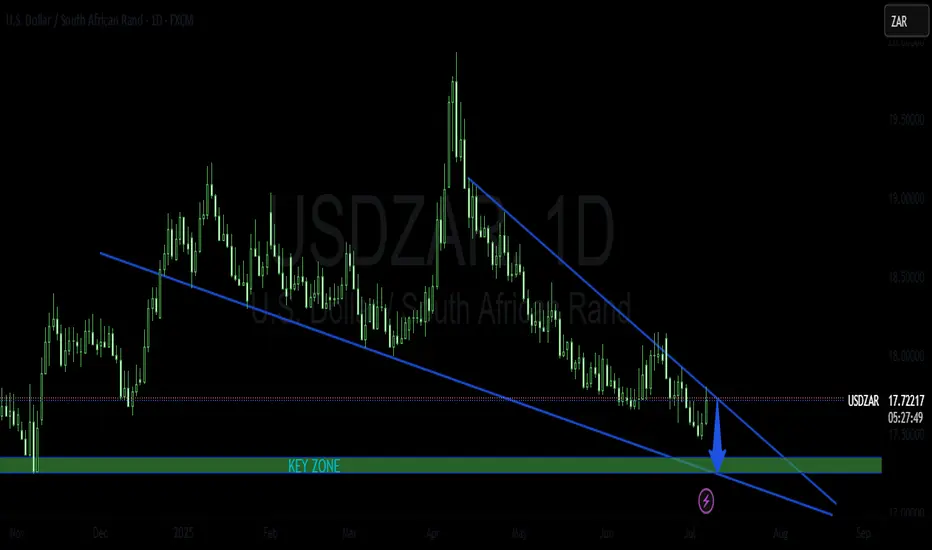
USDZAR SHORT TRADE PLANThe pair has been trading inside a bearish trend. It recently tested the boarder of the descending wedge pattern and from this point I will be looking for the reversal.
Please do your own analysis before placing any trades.
Cheers and Happy Trading !!!
SOUTH AFRICAN RAND : bullishA triple top has formed at 19
When USDZAR falls below 17, ZAR is definitely bullish
USDZAR-BUY strategy Daily chart GANNThe short-term shows some weakness, but some of the models I use, provide support for higher levels. The daily chart shows we may see a move back towards 18.0400 CLOUD area.
Strategy BUY @ 17.7350-17.7650 and take profit @ 18.0250 for now.

USDZAR-SELL strategy 3 Hourly chart GANNThe pair has some resistance near 17.8500 area, and we are little negative for some indicators. The move lower will be minor and should not carry high expectation of large decline. I think we are building towards sharper move higher in the medium0term.
Strategy sell @ 17.7850-17.8350 and take profi

See all ideas
Summarizing what the indicators are suggesting.
Oscillators
Neutral
SellBuy
Strong sellStrong buy
Strong sellSellNeutralBuyStrong buy
Oscillators
Neutral
SellBuy
Strong sellStrong buy
Strong sellSellNeutralBuyStrong buy
Summary
Neutral
SellBuy
Strong sellStrong buy
Strong sellSellNeutralBuyStrong buy
Summary
Neutral
SellBuy
Strong sellStrong buy
Strong sellSellNeutralBuyStrong buy
Summary
Neutral
SellBuy
Strong sellStrong buy
Strong sellSellNeutralBuyStrong buy
Moving Averages
Neutral
SellBuy
Strong sellStrong buy
Strong sellSellNeutralBuyStrong buy
Moving Averages
Neutral
SellBuy
Strong sellStrong buy
Strong sellSellNeutralBuyStrong buy
Displays a symbol's price movements over previous years to identify recurring trends.
Frequently Asked Questions
The current rate of USDZAR is 17.72002 ZAR — it has increased by 0.13% in the past 24 hours. See more of USDZAR rate dynamics on the detailed chart.
The value of the USDZAR pair is quoted as 1 USD per x ZAR. For example, if the pair is trading at 1.50, it means it takes 1.5 ZAR to buy 1 USD.
The term volatility describes the risk related to the changes in an asset's value. USDZAR has the volatility rating of 1.05%. Track all currencies' changes with our live Forex Heatmap and prepare for markets volatility.
The USDZAR showed a 0.61% rise over the past week, the month change is a −0.87% fall, and over the last year it has decreased by −2.52%. Track live rate changes on the USDZAR chart.
Learn how you can make money on rate changes in numerous trading ideas created by our community.
Learn how you can make money on rate changes in numerous trading ideas created by our community.
Currencies are usually traded through forex brokers — choose the one that suits your needs and go ahead. You can trade USDZAR right from TradingView charts — just log in to you broker account. Check out the list of our integrated brokers and find the best one for your needs and strategy.
When deciding to buy or sell currency one should keep in mind many factors including current geopolitical situation, interest rates, and other. But before plunging into a deep research, you can start with USDZAR technical analysis. The technical rating for the pair is strong sell today, but don't forget that markets can be very unstable, so don't stop here. According to our 1 week rating the USDZAR shows the sell signal, and 1 month rating is sell. See more of USDZAR technicals for a more comprehensive analysis.