XAUCAD - Bullish/Bearish - 4HBuy Stop:
Buy Stop:
Entry: 2734.755
Stop Loss: 2716.706
Risk 1:1
Sell Stop:
Sell Stop:
Entry: 2766
Stop Loss: 2780.943
Risk 1:1
No news here
Looks like there's nothing to report right now

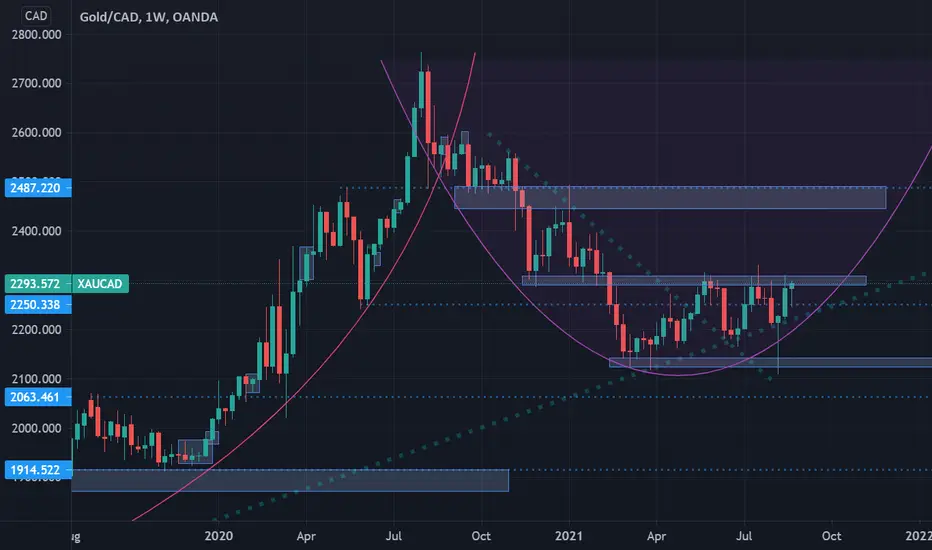
Gold in CADIt's important to look at Gold against various currencies - this can translate as a country's financial trust/stress barometer.
The Gold in CAD chart has recently formed a nice classic bull-flag on the weekly candles.
Continuation of this bullish pattern would bring Gold to a new ATH for Canadians.

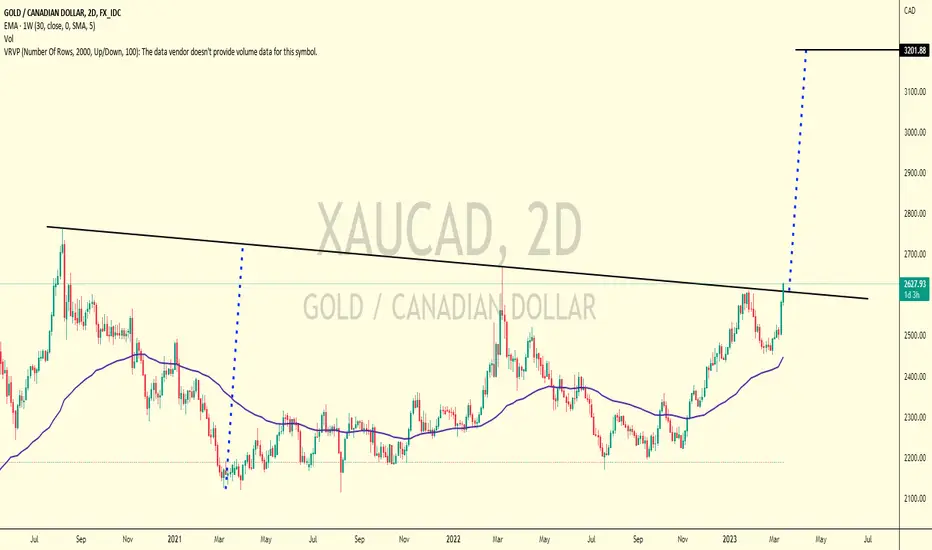
Gold/CAD at 3052 31-May-2023Two projections are suggesting Gold/CAD will be at 3052 31-May-2023.
The first projection is from 1-Oct-2018 on the weekly scale.
The second projection is 31-Oct-2022 on the daily scale.
Trend-based Fib extension (8-Mar-2023, 17-Mar-2023, 21-Mar-2023) has 1.618 projection at 3054.

Gold XAU short positionTechnical Analysis
Similar leaning head and shoulder pattern to start of Q4 of 2021 for Gold price.
Used same slope as 2021 for estimating trend line forecasted to a take-profit level at 2114 Support level.
Estimated time frame for take-profit orders would be around September 2022.
MACD and RSI co


GANN ideas, building on a previous idea from todayGann stuff, so, On Aug 7, 2020, the ath was in. Using this date, and converting it to price =2008.07. Well, the time required to get to that point of reversal is 302bars. Divide the price difference (2762.43-2008.07=754.36) by the Bars 302 and a pretty nice ratio, of 2.5:1 is the result. The cha

See all ideas
Displays a symbol's price movements over previous years to identify recurring trends.