Bullish rise?COPPER has reacted off the resistance level which is an overlap support and could potentially rise from this level to our take profit.
Entry: 4.7862
Why we like it:
There is an overlap support level.
Stop loss: 4.7410
Why we like it:
There is a pullback support level.
Take profit: 4.8881
Why we l

Copper breaks outFinally joining silver and platinum, copper has broken out above key $5.00 level. With prices making higher highs and higher lows ever since bottoming in April, dip-buyers will be keen to step in on any short-term weakness we may see moving forward. For as long as support now holds at $5.00, the bul

Cup and Handle Breakout Setting UpCopper 4H Bullish Scenario – **
Copper is currently exhibiting a **classic Cup and Handle formation** on the 4H chart, signaling potential for a bullish continuation move.
#### 🔍 **Technical Breakdown:**
* **Cup Formation:** The rounded base stretching from mid-April to June formed a well-defined

Could the Copper drop from here?The price has rejected off the resistace level which is a pullback resistance that aligns with the 61.8% Fibonacci retracement and could drop from this level to our take profit.
Entry: 4.8811
Why we like it:
There is a pullback resistance level that aligns with the 61.8% Fibonacci retracement.
Sto

Copper Ready to Fly ?Copper is looking strong — the price has started to rise.
The key now is that the U.S. main session doesn't sell it off hard.
If the breakout holds, this could be the start of a powerful move to the upside. Watching closely for confirmation during the main session.
📝Trade Plan:
Entry: On a brea

Copper is SLOW but steady and climbing to the impossible 10,677The target seems like it's in another universe, but we are patient traders right?
Actually, this analysis is turning out to be a MEDIUM term investment.
The problem, with derivatives the Interest eats away daily and the price goes up technically.
However, the analysis is still on despite the sl

XCU/USD: Low-Risk Loot Opportunity!🔥 THE COPPER HEIST: XCU/USD Robbery Plan (Swing/Day Trade) 🔥
🌟 Attention, Market Robbers & Money Makers! 🌟
(Hola! Oi! Bonjour! Hallo! Marhaba!) 🤑💰💸✈️
Based on the 🔥Thief Trading Style🔥, here’s our master heist plan for the XCU/USD "The Copper" Metals Market! This is a high-probability long setup,

Bearish drop?COPPER is reacting off the resistance level which is a pullback resistance that lines up with the 38.2% Fibonacci retracement and could drop from this level to our take profit.
Entry: 4.8781
Why we like it:
There is a pullback resistance level that lines up with the 38.2% Fibonacci retracement.
St

COPPER XCUUSDCopper Price Action, Dollar Correlation, Bond Yields, and Global Reserves
1. Copper Price Action and Dollar Index (DXY) Correlation
Inverse Relationship: Copper prices typically move inversely to the US Dollar Index (DXY). A weaker dollar (DXY↓) makes copper cheaper for foreign buyers, boosting dema

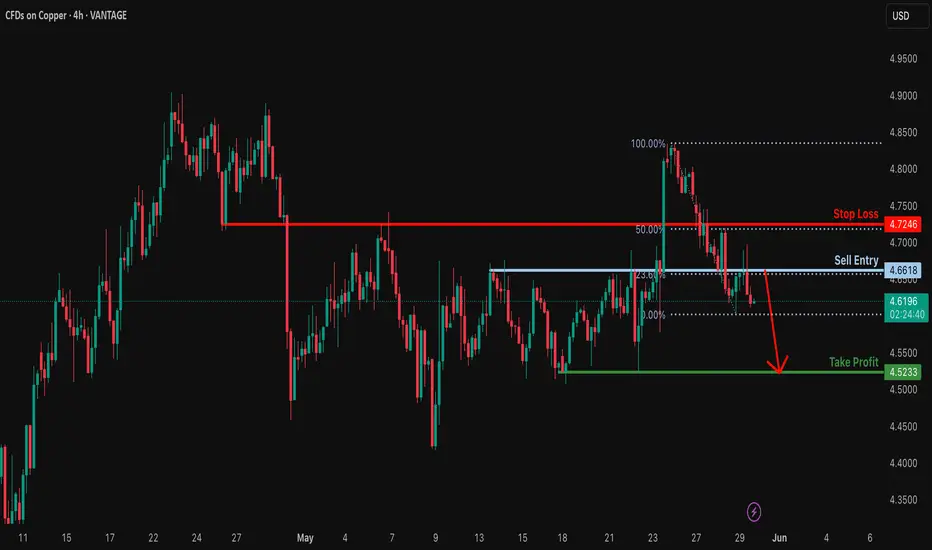
Bearish drop?COPPER has rejected off the resistance level which is a pullback resistance that lines up with the 23.6% Fibonacci retracement and could drop from this level to our take profit.
Entry: 4.6618
Why we like it:
There is a pullback resistance that lines up with the 23.6% Fibonacci retracement.
Stop lo
See all ideas
Summarizing what the indicators are suggesting.
Oscillators
Neutral
SellBuy
Strong sellStrong buy
Strong sellSellNeutralBuyStrong buy
Oscillators
Neutral
SellBuy
Strong sellStrong buy
Strong sellSellNeutralBuyStrong buy
Summary
Neutral
SellBuy
Strong sellStrong buy
Strong sellSellNeutralBuyStrong buy
Summary
Neutral
SellBuy
Strong sellStrong buy
Strong sellSellNeutralBuyStrong buy
Summary
Neutral
SellBuy
Strong sellStrong buy
Strong sellSellNeutralBuyStrong buy
Moving Averages
Neutral
SellBuy
Strong sellStrong buy
Strong sellSellNeutralBuyStrong buy
Moving Averages
Neutral
SellBuy
Strong sellStrong buy
Strong sellSellNeutralBuyStrong buy
Displays a symbol's price movements over previous years to identify recurring trends.