Copper Long Swing TradeCAPITALCOM:COPPER Long Swing trade, with my back testing of this strategy, Copper is bullish
This is good trade.
Don't overload your risk like Greedy gambler!!!
Be Disciplined Trader, what what you can afford.
Use proper risk management
Looks like good trade.
Lets monitor.
Use proper risk management.
Disclaimer: only idea, not advice
XCUUSD trade ideas

False breakdown coming on CopperI think we take out the lows and then we see a nice bounce. I think everyone is expecting us to go lower but there's so much liquidity there which you'll see from my video I just don't see it.
Hope you guys can get in!

Copper Stabilizes: A Tactical Long OpportunityAfter pulling back from recent highs, copper is showing signs of stabilizing. In my view, this move is more likely a correction within a broader uptrend rather than the start of a deeper decline.
I remain optimistic about the commodity sector in the near term, and copper is no exception. From current levels, the odds favor a resumption of the uptrend over a continued drop.
On the monthly chart, the broader bullish trend remains intact as long as the price stays above the 4.00 level. There’s a possibility that copper may dip toward 4.20 before rebounding, but the current price zone already looks attractive for initiating long positions — we might not get a deeper pullback.
Friday’s candlestick adds confidence to the bullish case, and similar constructive setups are appearing across other industrial metals, such as silver, palladium, and platinum.
📝Trading Plan
🟢Entry: Current levels (~4.45)
🔴Stop: Below Thursday’s low — 4.35
🎯Target: 4.67 / 4.87 / 5.24

buy copper! buy copper!Trump discounted coppers value over 20% due to 50% tariffs as we know usually is temporary and a negotiating tactic. also copper needed a clear market correction after this years impulse in price. heres the last chance

$copperlovely gift by trump i guess
50 ema holding for now
bid here and will look for a deviation below white line

What a turnaround on copper futuresManipulation? Smells like it, but of course, this is just the market we are currently living in.
Let's dig in.
MARKETSCOM:COPPER
COMEX:HG1!
Let us know what you think in the comments below.
Thank you.
75.2% of retail investor accounts lose money when trading CFDs with this provider. You should consider whether you understand how CFDs work and whether you can afford to take the high risk of losing your money. Past performance is not necessarily indicative of future results. The value of investments may fall as well as rise and the investor may not get back the amount initially invested. This content is not intended for nor applicable to residents of the UK. Cryptocurrency CFDs and spread bets are restricted in the UK for all retail clients.

Copper establishing a baseFollowing the big drop in copper prices on the back of news at the end of July that Trump's tariff excludes refined metal, prices have started to stabilize near the lows, suggesting a potential recovery could be on the cards.
Copper prices dropped by the largest on July 30 after Trump excluded refined metal from his planned import tariff.
Dip-buyers are starting to step back in now, with prices now finding their footing around $4.40 area, which itself was a prior demand zone from early April.
Short-term resistance around $4.50 has provided a short-term ceiling but if that breaks then we could see a quick recovery towards the 200-day average first, ahead of potentially $5.00 in the coming weeks.
By Fawad Razaqzada, market analyst with FOREX.com

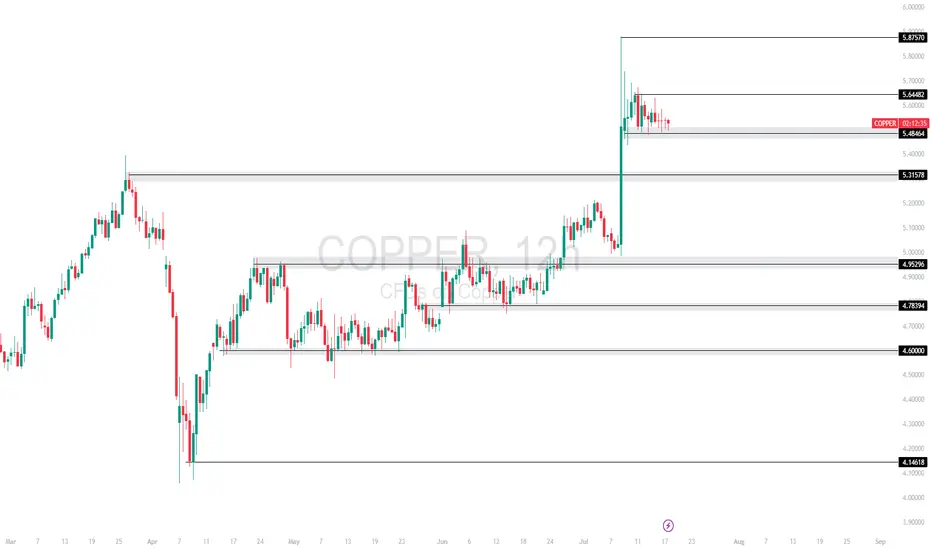
COPPER TECHNICAL ANALYSISCopper spiked into 5.8750 but is now consolidating just below short-term resistance at 5.6448, showing signs of a bullish continuation pattern. Price remains supported at the 5.4864 zone.
Currently trading at 5.4864, with
Support at: 5.4864 / 5.3157 / 4.9929 🔽
Resistance at: 5.6448 / 5.8750 🔼
🔎 Bias:
🔼 Bullish: Break above 5.6448 could push price toward 5.8750 and beyond.
🔽 Bearish: Loss of 5.4864 may trigger downside toward 5.3157.
📛 Disclaimer: This is not financial advice. Trade at your own risk.
Copper Eyeing Key Reversal Point – Will It Break Above 4.68152 ?Copper is currently hovering near the 4.68152 🔼 resistance after rebounding from the 4.50280 🔽 support. Price is reacting to the 50-period SMA, which is slightly above current levels and may act as a dynamic resistance. The overall structure remains mixed with recent lower highs, but bulls have stepped in at key support.
Support at: 4.50280 🔽, 4.27241 🔽, 4.04129 🔽
Resistance at: 4.68152 🔼, 4.83230 🔼, 4.95323 🔼
Bias:
🔼 Bullish: A breakout and retest above 4.68152, and ideally a clean move above the 50 SMA, could signal bullish continuation toward 4.83230 and 4.95323.
🔽 Bearish: A strong rejection at 4.68152 or a drop below 4.50280 could send price back toward 4.27241.
📛 Disclaimer: This is not financial advice. Trade at your own risk.


Long the copper for a potential breaking upWith the expectation of PPI bouncing back from the deep valley because China is launching a 1.3 Trillion infrastructure plan to build the largest hydro dam in the Yarlung Tsangpo Grand Canyon on the Qinghai-Tibet Plateau, the long term global demand of industrial copper is more bullish than last time.
In the aspect of currency, the bullish steepener yield curve of US T-bill is giving a continuous momentum to industrial commodities.
Imma entry in the bottom of the current consolidation and add position as the breaking in the next weeks

Bullish Consolidation After the copper market exploded higher on the Trump Administration’s 50% tariff headline, the market has been quietly consolidating above the breakout level at 5.33. While above this level the risk is higher, and in case of a break back below the 5.30 level, the risk would be a larger retracement. This would likely be caused by the Trump Administration abandoning that threat of a 50% tariff.

XCU/USD: Low-Risk Loot Opportunity!🔥 THE COPPER HEIST: XCU/USD Robbery Plan (Swing/Day Trade) 🔥
🌟 Attention, Market Robbers & Money Makers! 🌟
(Hola! Oi! Bonjour! Hallo! Marhaba!) 🤑💰💸✈️
Based on the 🔥Thief Trading Style🔥, here’s our master heist plan for the XCU/USD "The Copper" Metals Market! This is a high-probability long setup, but we must escape before the police (bears) set their trap near the red zone! 🚨📉
📌 THE HEIST BLUEPRINT
✔ Entry Strategy (Breakout or Pullback)
✔ Stop Loss (Protect Your Loot!)
✔ Target (Escape Before the Cops Arrive!)
🚀 ENTRY: TIME TO STRIKE!
"The heist is ON! Wait for the ATR breakout (5.00000) before moving!"
Option 1: Place Buy Stop orders above the Moving Average.
Option 2: Use Buy Limit orders on pullbacks (15m/30m recent swing lows).
📢 ALERT! Set a breakout alarm—don’t miss the move!
🛑 STOP LOSS: PROTECT YOUR LOOT!
"Yo, listen up! 🗣️ If you're entering on a Buy Stop, DON’T set your SL until AFTER the breakout!
📍 Thief SL Placement: Recent swing low + Moving Average (5H TF) → 4.80000
⚠️ WARNING: If you ignore this, you’re playing with fire! 🔥 (Your risk, not mine!)
🎯 TARGET: CASH OUT & ESCAPE!
🏴☠️ First Take-Profit: 5.25000 (or exit early if the market turns!)
💰 Scalpers: Only trade LONG—use trailing SL to lock in profits!
📊 MARKET STATUS: NEUTRAL (But Bullish Potential! 🐂)
Fundamentals? Check COT Reports, Macro Data, Geopolitics, News Sentiment!
🔗 Links in bio0 for full analysis! 👉🌎📰
🚨 TRADING ALERT: NEWS = VOLATILITY!
⚠️ Avoid new trades during major news!
🔒 Use Trailing SL to protect open positions!
💥 BOOST THIS HEIST PLAN!
Hit 👍 LIKE & 🔄 SHARE to strengthen our robbery squad!
🚀 More heists coming soon—stay tuned! 🤑💎
🎯 FINAL WORD:
"Take profits, treat yourself—you deserve it! 💸🏆"

Copper Holds Above 14-Year ResistanceFrom a monthly time frame perspective, copper has broken above a major resistance zone defined by consecutive highs dating back to 2011.
The breakout above $5.40 marks a significant technical milestone. A clean move above the $5.87 high could open the door for further upside, potentially targeting $7.00 and beyond as bullish momentum continues to build.
On the downside, if copper fails to hold this breakout and closes back below the 14-year trendline, support may be retested near the $4.60 and $4.20 levels.
- Razan Hilal, CMT

US COPPER: is the technical breakout a trap?The unexpected announcement of a dramatic increase in US copper tariffs triggered a bullish impulse in the copper price, which reached a new all-time high. The question is whether this bullish technical signal is reliable, or whether it could be a false signal and therefore a bullish trap. So let's review the technical analysis message on the price of copper (copper which is listed in New York) and take a look at the fundamentals.
1) 50% US tariff on copper imports!
President Trump has announced a 50% tariff on imports of this strategic metal, triggering an immediate price surge in the US and a pullback in the London-listed copper price. This decision is part of a wider move to reduce the country's dependence on foreign suppliers, following similar measures on other industrial metals. Faced with the prospect of trade barriers on such a scale, international traders rushed huge volumes of copper to US ports to protect themselves against an imminent surcharge. However, this rush has added to the confusion, as no one knows precisely when the new taxes will come into force, or whether certain companies will be granted exemptions. We must therefore remain cautious, as Trump's trade announcements are highly fickle, and the price of copper in the US could fall back if these 50% tariffs are not finally implemented.
It takes many years to bring new mines on stream and build copper processing plants, while imports continue to dominate the US market. This could exert sustained upward pressure on prices, penalizing the competitiveness of US industries.
At the same time, the timetable for implementation remains unclear. The Secretary of Commerce mentioned the end of summer as a likely horizon, but without detailing which types of processed or raw products would be affected. This uncertainty fuels speculation and maintains volatility on commodity markets. We therefore need to be fully aware of the speculative aspect of copper's behavior on the stock market at present, and therefore of the risk of false technical signals.
2) In terms of technical analysis, if the breakout is confirmed, bullish potential may be limited by the top of a long-term Chartist channel.
In terms of chart analysis, a bullish technical breakout has therefore taken place, with the overrunning of resistance at $4.70/$5. It remains to be seen whether or not this bullish technical break will be confirmed at the weekly close at the end of the week.
But if it is, the upside potential will be limited by the upper part of a long-term Chartist channel which runs towards the $6 price. If the market were to break back below support at $4.70/$5, then the bullish technical signal would be invalidated.
3) The relative strength between the copper price and the gold price should be kept under close watch
On the other hand, I would like to highlight the presence of major long-term support on the ratio between the copper price and the gold price.
The current bounce off this long-term support suggests that copper should outperform gold over the coming months.
DISCLAIMER:
This content is intended for individuals who are familiar with financial markets and instruments and is for information purposes only. The presented idea (including market commentary, market data and observations) is not a work product of any research department of Swissquote or its affiliates. This material is intended to highlight market action and does not constitute investment, legal or tax advice. If you are a retail investor or lack experience in trading complex financial products, it is advisable to seek professional advice from licensed advisor before making any financial decisions.
This content is not intended to manipulate the market or encourage any specific financial behavior.
Swissquote makes no representation or warranty as to the quality, completeness, accuracy, comprehensiveness or non-infringement of such content. The views expressed are those of the consultant and are provided for educational purposes only. Any information provided relating to a product or market should not be construed as recommending an investment strategy or transaction. Past performance is not a guarantee of future results.
Swissquote and its employees and representatives shall in no event be held liable for any damages or losses arising directly or indirectly from decisions made on the basis of this content.
The use of any third-party brands or trademarks is for information only and does not imply endorsement by Swissquote, or that the trademark owner has authorised Swissquote to promote its products or services.
Swissquote is the marketing brand for the activities of Swissquote Bank Ltd (Switzerland) regulated by FINMA, Swissquote Capital Markets Limited regulated by CySEC (Cyprus), Swissquote Bank Europe SA (Luxembourg) regulated by the CSSF, Swissquote Ltd (UK) regulated by the FCA, Swissquote Financial Services (Malta) Ltd regulated by the Malta Financial Services Authority, Swissquote MEA Ltd. (UAE) regulated by the Dubai Financial Services Authority, Swissquote Pte Ltd (Singapore) regulated by the Monetary Authority of Singapore, Swissquote Asia Limited (Hong Kong) licensed by the Hong Kong Securities and Futures Commission (SFC) and Swissquote South Africa (Pty) Ltd supervised by the FSCA.
Products and services of Swissquote are only intended for those permitted to receive them under local law.
All investments carry a degree of risk. The risk of loss in trading or holding financial instruments can be substantial. The value of financial instruments, including but not limited to stocks, bonds, cryptocurrencies, and other assets, can fluctuate both upwards and downwards. There is a significant risk of financial loss when buying, selling, holding, staking, or investing in these instruments. SQBE makes no recommendations regarding any specific investment, transaction, or the use of any particular investment strategy.
CFDs are complex instruments and come with a high risk of losing money rapidly due to leverage. The vast majority of retail client accounts suffer capital losses when trading in CFDs. You should consider whether you understand how CFDs work and whether you can afford to take the high risk of losing your money.
Digital Assets are unregulated in most countries and consumer protection rules may not apply. As highly volatile speculative investments, Digital Assets are not suitable for investors without a high-risk tolerance. Make sure you understand each Digital Asset before you trade.
Cryptocurrencies are not considered legal tender in some jurisdictions and are subject to regulatory uncertainties.
The use of Internet-based systems can involve high risks, including, but not limited to, fraud, cyber-attacks, network and communication failures, as well as identity theft and phishing attacks related to crypto-assets.

Gap below… but copper’s breakout still in playCopper markets erupted higher this week following President Trump's proposal to impose a 50% tariff on copper imports. The price ripped from just above $5.20 to nearly $5.80 in a single 4-hour candle.
Now, copper could be forming a bullish flag or pennant on the 4-hour timeframe. After the vertical spike, price is consolidating in a tight, potentially downward-sloping channel between ~$5.45 and ~$5.60.
If confirmed with a clean breakout above the flag’s upper trendline - perhaps near $5.62—the next leg could project toward the previous high near $5.80
There’s also a gap below current price action, between $5.20 and $5.35, formed during the explosive move up. While gaps can act as support zones, they also tend to get revisited.

Copper Trading Summary – Trump’s 50% Tariff ImpactCopper futures spiked—largest intraday gain in decades—after Trump announced a 50% import tariff.
Market fears supply disruption, especially from major exporters like Chile and Peru.
Bullish short-term outlook as U.S. buyers may rush to stockpile ahead of enforcement.
Risk of retaliation or broader trade tensions could limit gains if global demand weakens.
Watch for:
Tariff implementation details
COMEX/LME inventory shifts
China demand signals
Currency moves (AUD, CLP)
Trading bias: Bullish copper short term, but remain alert for macro trade war risks.
Key Support and Resistance Levels
Resistance Level 1: 9,780
Resistance Level 2: 9,900
Resistance Level 3: 10,000
Support Level 1: 9,580
Support Level 2: 9,500
Support Level 3: 9,340
This communication is for informational purposes only and should not be viewed as any form of recommendation as to a particular course of action or as investment advice. It is not intended as an offer or solicitation for the purchase or sale of any financial instrument or as an official confirmation of any transaction. Opinions, estimates and assumptions expressed herein are made as of the date of this communication and are subject to change without notice. This communication has been prepared based upon information, including market prices, data and other information, believed to be reliable; however, Trade Nation does not warrant its completeness or accuracy. All market prices and market data contained in or attached to this communication are indicative and subject to change without notice.

Copper is finding it's way to 5.5555...Hi all trading lovers and copper buyers...
Seems that copper is continuing its uptrend targeting 5.5555...
PLEASE NOTE THAT IS ONLY AN ANALYSIS...
MARKET IS BASED ON POSSIBILITIES AND UNCERTAINTIES...
#Forex #Trading #Analysis #Copper #Chart #Spike #Wedge #Uptrend

Copper Poised for GrowthCopper is in a strong uptrend.
Currently, it has pulled back to the 18 EMA level, which offers a potential long opportunity with an initial target at 5.25, and a further upside toward 5.60.
The era of metals continues.
Gold was the first to react — and I believe its rally is not over yet, with new all-time highs still ahead.
Now, it's industrial metals' turn: silver, platinum, palladium, and copper.
Platinum has already shown a strong move, and chasing longs here feels late — it's better to wait for stabilization and the next bullish setup.
Palladium, silver, and copper, on the other hand, still have plenty of room for explosive growth in the near term.
The stop-loss, based on volatility, is set at 4.96.

Cup and Handle Breakout Setting UpCopper 4H Bullish Scenario – **
Copper is currently exhibiting a **classic Cup and Handle formation** on the 4H chart, signaling potential for a bullish continuation move.
#### 🔍 **Technical Breakdown:**
* **Cup Formation:** The rounded base stretching from mid-April to June formed a well-defined “cup” bottom. This signals long-term accumulation and shifting momentum to the upside.
* **Handle Formation:** The recent consolidation forming a slight dip to the right is acting as the handle. It's shallow and holding well above the mid-range, showing strength and limited selling pressure.
* **Breakout Zone:** Price is now pressing against a **key horizontal resistance around the 4.88 – 4.90** zone (shaded red). A break above this neckline would confirm the pattern.
* **Target Projection:**
Using the depth of the cup (\~\$0.45), a confirmed breakout above **\$4.90** targets the **\$5.35** zone (aligned with the green take-profit zone on your chart).
* **Volume:** Volume shows steady accumulation during the cup phase and lighter volume during the handle – a textbook setup that often precedes a breakout.
* **Moving Averages:** Price is trading above the 20 EMA and 50 EMA, with a bullish crossover in place, reinforcing the positive momentum.
---
### ✅ **Bullish Play Setup (if breakout confirms):**
* **Entry:** Above \$4.90
* **Stop-loss:** Below \$4.75 (handle low or below shaded support)
* **Target:** \$5.30 – \$5.35 (measured move)
### ⚠️ **Watch For:**
* False breakouts – wait for strong candle close above \$4.90 with volume.
* Any sudden macroeconomic shocks (e.g., China demand, Fed decisions).
✅ Bullish Play Setup (if breakout confirms):
Entry: Above $4.90
Stop-loss: Below $4.75 (handle low or below shaded support)
Target: $5.30 – $5.35 (measured move)
⚠️ Watch For:
False breakouts – wait for strong candle close above $4.90 with volume.
Any sudden macroeconomic shocks (e.g., China demand, Fed decisions).

DOUBLE PATTERN:Cup and TriangleHello Traders,
All the eyes now on the next leg for the copper if Trump did not Finalize the Tariffs copper will go back to at least the bottom again 3.4 3.1 as every one kept loading up for the imports now the states is overloaded with loads of materials and minerals imagine what could happened if he didn't sign up this Tariffs on the mineral! they will be selling it for so cheap to cover the losses dramatically same like what happened with the oil its a commodity right !that's one scenario, the other one is every thing move as planned and the copper get back to the bottom of the triangle and shoot straight up so lets see what could happed I'm in short for now good luck, kindly support my idea if you like and make your decisions based on your research

Copper is gonna to complete the 2nd leg??Hi all trading lovers and copper buyers...
Seems that after BREAKOUT from Descending Triangle and Pullback to breakout level, price is going to complete the 2nd BULLISH Leg in Weekly uptrend with a round level target (5.5555)...
(Pullback could be a bit deeper...)
PLEASE NOTE THAT IS ONLY AN ANALYSIS AND COULD BE WRONG...
MARKET IS BASED ON POSSIBILITIES AND UNCERTAINTIES...
MANAGE YOUR RISK...
#Forex #Trading #Analysis #Copper #Chart #Spike #Wedge #Uptrend

"That last candlestick bar is a breakout 4hour (4H) session "I feel so sad because am in a situation
where i have to make a decision to receive government surpport.
Now personally i dont mind government surpport.
But doing it to please my family is not what i wanted.
It makes me sick.I hate politics.I love capitalism.
Eventhough capitalism and potics are related.
When you look at copper prices.Let me show
you a relation i saw.
On the futures prices of copper.I saw a weekly
brekout.This surprised me.It was at this time
that i then looked at the copper prices on the spot market.
TO my surprise i saw the manipulation for the
first time in my trading career,Instead of a breakout
it looked like an arbitrage.
I saw a perfect reversal on the weekly pattern.
How is that possible? When its clear
that a breakout price action is visible on the futures markets?
This connection between the futures market
of copper in india and the spot price in america.
Is something to thinnk about.
Its like mixing capitalism and politics it makes me sick
but maybe its a necessary evil just be careful
when you mix the two.
Stay humble, and see the attack coming and adjust your position
politics is very important and so dont ignore its power.
Just like studying the connection between the futures
markets and spot market.
If you look at this chart you will notice 3 candlestick patterns:
-Doji
-Hanging Man
-Bearish Engulfing.
The two Red candlestick patterns you are
seeing shows you the breakout price action.
That last candle stick bar is a breakout 4hour (4H) session entry
Rocket boost this content to learn more.
Disclaimer:Trading is risky.Please learn risk management and
profit taking strategies.Also feel free to use a simulation trading account before you
trade with real money.Also do not use margin trading.Trade safe.
