COPPER PRICED IN GOLDMetals have their own trends, especially when found and mined together in nature.
I see a nature rhythm on the one-month chart here likely to result in copper climbing compared to gold.
CAPITALCOM:COPPER
OANDA:XAUUSD
AMEX:CPER
AMEX:COPX
DYOR.
Trade Slick.
XCUUSD trade ideas

COPPER 13/01Pair : Copper - CU
Description :
Bullish Channel as an Corrective Pattern in Long Time Frame with the Breakout of the Lower Trend Line and Bearish Channel as an Corrective Pattern in Short Time Frame and Rejection from Upper Trend Line. Completed " 12345 " Impulsive Waves and making its " A " Corrective Wave. We have LL - LH and Break of Structure

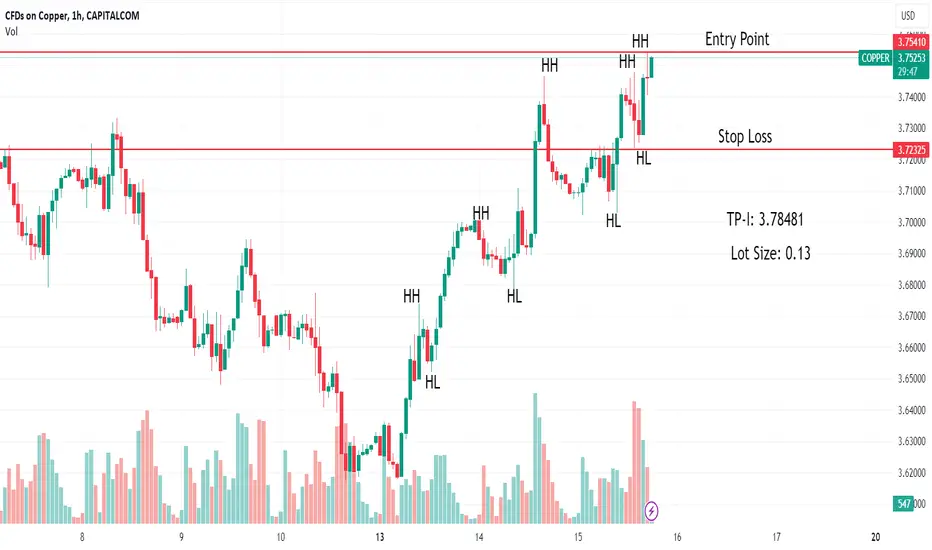
Copper CFD Creating Bearish Reversal in a Bullish TrendCopper CFD @ Daily TF
Story: Printing Bullish Trend and a Bearish Rising Wedge
Anticipation: Can Breakout below the last HL
Plan: Sell stop below the last HL, SL at the last HH

COPPER, Teasing a multi-weekly TOP GAINS soon! SEED!Copper is in continuous ascend mode this past few days / weeks after touching an important major order block at 61.8 FIB levels. Since then, significant net accumulation has been registered on a daily basis.
Expect some generous price growth from the current price range. A seed from here is ideal while it's still in a slow roll ascend -- but not for long.
Initial target is 5.0.
Spotted at 3.80
SEED LONG.
TAYOR.
Safeguard funds always / not advice.

Copper may continue to move lower over the next weekCopper may continue to move lower over the next week
It seems that the volatility of the price of gold is affecting the price of all metals.
If we take a long-term view, we can see that all metals have started a downtrend.
There is a high possibility that Copper will also decrease more in the following weeks.
From a technical perspective, the price has just broken a strong level of the technical pattern and is expected to decrease even more until 3.6
You can find more details in the chart!
Thanks and good luck!

Copper 08/01Pair : Copper - CU
Description :
Bearish Channel as an Corrective Pattern in Short Time Frame , Rejection from Lower Trend Line. Completed " 12345 " Impulsive Waves at Daily Resistance Level and making its " A " Corrective Wave. Break of Structure

Cooper to the Top?Hello investors, here is my trading idea for copper on a weekly basis.
Profit taking is marked in the black lines, SL is marked in red.
The ideal entry point is 3.81-3.80. If the price falls below 3.80, the price development will be different, but SL will still be active.
Good LUCK @ ALL

Copper CU 22/12 Pair : Copper CU
Description :
Bullish Channel as an Corrective Pattern in Long Time Frame and Rejection from Lower Trend Line. Rising Wedge as an Corrective Pattern in Short Time Frame with Strong Divergence and Break of Structure
Entry Precaution :
Wait for Rejection or Breakout

Copper ~ Help Me Obi-China, You're My Only Hope (2H)CAPITALCOM:COPPER chart mapping/analysis.
Copper - off its October lows, yet still contending with global macro headwinds & China's difficulty in shaking off its deflationary economic funk..
Trading scenarios into EOY:
Prelim trading range = ~3.93 - ~3.73.
Under bearish pressure from 38.2% Fib rejections.
Bullish reaction to China/macro economic news = bounce off lower range of parallel channel (green) + 200SMA confluence support / break above 38.2% Fib / break above ~3.93 upper trading range.
Bullish extension target(s) = 50% Fib / upper range of parallel channel (green) confluence zone.
Bearish reaction to China/macro economic news = break below ~3.73 lower trading range / lower range of parallel channel (green) / break underneath 200SMA, becoming dynamic resistance.
Bearish extension target(s) = 23.6% Fib / lower range of descending parallel channel (light blue).

Long therm trade, low risk Long term trade opportunity. If this week after the CPI announcement the candle remains bullish with a high volume and a close price closer to the high of the candle, then the probability of having an all-time high in Copper is very high because it is a very bullish seasonal trend in December, January consolidation, and February and March very bullish price again (the strongest bullish trend of all copper in the year. + is a very large increase in open interest of the futures contract that follows (not the current one)

COPPER - 4HIf the range of 3,750 units is broken downwards and the price stabilizes below it, the price may fall to the range of 3,700 units, and in case of strength, the range of 3,650 units
Otherwise, the possibility of price increase up to the range of 3,820 units

COPPER 06/12Pair : Copper - CU
Description :
Completed " 12345 " Impulsive Waves and " ABC " Corrective Waves at Daily Demand Zone. Its Rejecting from the Resistance Level to make its Impulse Again. Rising Wedge as an Corrective Pattern in Short Time Frame and Breakout of the Lower Trend Line
Entry Precautions :
Wait for the Proper Retracement


Inflation has peaked Copper leading Hi there,
Copper has resumed its bearish cycle after having bullish cycle and record inflation.
Copper is leading us that economy is slowing down significantly.
In coming months inflation will fall back below 4 percent.
Deflationary cycle has already begun.
Good Luck

Copper 30/11Pair : Copper - CU
Description :
Completed " 12345 " Impulsive Waves and " ABC " Correction in Short Time Frame. Making Impulse in Short Time Frame and " C " Correction in Long Time Frame. We have Falling Wedge as an Corrective Pattern in Short Time Frame.
Entry Precautions :
Wait for the Breakout or Rejection of UTL

Copper ~ Nov-Dec Snapshot (4H Intraday)CAPITALCOM:COPPER chart mapping/analysis for last week of November.
TBC further details/write-up via ideas section.

Copper in Bullish TrendCopper is in Bullish Trend. It is making HH and HLs. After series of HH, the instrument made correction. at HL, bullish Engulfing candle predicting its upward move

COPPERPair : CU - Copper
Description :
Breakout and Retest of the Corrective Pattern " Bullish Channel " in Short Time Frame and Completed Impulsive Waves " 12345 " and " ABC " Corrective Waves at Daily Descending Trend Line / Resistance Level
Entry Precaution :
Wait for Rejection and Retracement

COPPER | Forming a top?Based on the analysis shown on the chart i think there is a strong probability that price will get resistance at this level. a weak close on coming few candles will be a confirmation for this idea.
Cheers!

Copper Swing LongDovish Fed Outlook changes the bearish global feeling.
-Consolidation area.
-Consolidation on the breakout area.
-Shakeout area with rebound and strong bullish candles.
TP on the edge of the next big reference area.
SL below the second lowest point.

Copper-Elliot wave counts and market structureI have earlier posted a daily chart on Copper sharing my views on this commodity and stating that it is now in wave 3 structure and will be slowly advancing towards 4.67$ mark going into 2024. By referring to that chart you can get a better understanding of this chart since that talks about a bigger picture about what to expect from this commodity.
Coming to this chart, the metal made a leading diagonal(Elliot wave theory) between 17th Oct and 6th Nov. That is marked as wave (i). After an impulse gets completed it is always followed by a corrective wave which can retrace even upto 90%(but never 100 if the prior wave was impulsive).In this case the wave (ii) retraced 50% of wave(i) from 6Nov. till 13Nov.
A new impulse was again set in place on 13th of Nov.
The Elliot wave theory is a very accurate and the most logical way of looking at the market structure and getting an understanding of how the price moves. Once you start to look at the market from the Elliot wave perspective you will start believing that whatever happens in the market is never random.
The market always has a structure and logic, which many a times we as individuals may not spot(immediately) and that only means we need to up our game to try and understand this beautiful market place.
The purpose of this chart was not only to talk about copper and where it might be headed, but was also to give an insight to all about how i approach the charts and what are the points that i look for.
Note*- This chart is for educational purpose only