COPPER XCUUSDCopper Price Action, Dollar Correlation, Bond Yields, and Global Reserves
1. Copper Price Action and Dollar Index (DXY) Correlation
Inverse Relationship: Copper prices typically move inversely to the US Dollar Index (DXY). A weaker dollar (DXY↓) makes copper cheaper for foreign buyers, boosting demand and prices. For example, in early 2025, a DXY drop from 109 to 103.2 (May 2025) lifted copper prices from $4.72 to $4.82 per pound .
Mechanism: Dollar-denominated commodities like copper become more affordable in other currencies when the USD weakens, driving global demand .
Exception: Geopolitical risks or supply constraints (e.g., Chilean production disruptions) can decouple this relationship temporarily .
2. Copper and Bond Yields
Real Yields Drive Prices: Copper’s performance is influenced by real interest rates (nominal bond yields minus inflation). Lower real yields reduce the opportunity cost of holding non-yielding commodities, supporting copper prices.
Fed Policy Impact: Rising bond yields (e.g., 10-year Treasury yields at 4.54% in May 2025) pressure copper if driven by hawkish Fed policies, but inflation expectations can sustain demand for copper as a hedge .
Recent Example: Despite elevated nominal yields in 2025, copper rallied due to supply deficits and inflation hedging, mimicking gold’s behavior in stagflationary environments .
3. Country with the Highest Copper Deposits
Chile dominates global copper reserves with 170 million metric tons (27% of the world’s total), home to the largest mines like Escondida and Collahuasi .
Other Key Producers:
Australia: 88 million MT reserves.
Peru: 81 million MT reserves.
Russia and Mexico: 62 million MT and 53 million MT, respectively .
Summary Table
Factor Impact on Copper Prices Key Data Points
DXY ↑ ↓ (stronger USD reduces global demand) DXY 103.2 → Copper $4.82/lb (May 2025)
Real Yields ↓ ↑ (lower opportunity cost for holding copper) Fed rate cuts in 2025 supported copper
Top Copper Reserves Chile (170M MT), Australia (88M MT), Peru (81M MT) Chile’s Escondida: largest mine globally
Copper Use Cases in Real Life
Copper is a highly versatile metal with numerous applications across various industries due to its excellent electrical and thermal conductivity, corrosion resistance, malleability, and antimicrobial properties. Here are the main real-life uses of copper:
1. Building Construction
Nearly half of all copper supply goes into the construction sector.
Used extensively in electrical wiring, plumbing, roofing, HVAC systems, refrigeration lines, and water pipes.
One average home contains about 439 pounds of copper, used in wiring, tubing, and appliances.
2. Electronics and Electrification
Copper’s superb electrical conductivity makes it essential for electrical wiring and printed circuit boards in consumer electronics like smartphones, laptops, TVs, and power tools.
Vital for data centers, supercomputers, AI platforms, and cryptocurrency mining hardware.
Increasingly important in battery energy storage systems, which are growing rapidly.
3. Transportation and Electric Vehicles (EVs)
Used in manufacturing ships, trains, airplanes, and automobiles.
Found in motors, brakes, connectors, radiators, bearings, and wiring in vehicles.
EVs require two to four times more copper than conventional vehicles, including for charging stations.
Copper demand from green energy and EV sectors is expected to grow five-fold by 2030.
4. Industrial Machinery and Equipment
Used in electrical motors, heat exchangers, valves, condensers, and piping for petrochemical, desalination, and offshore oil and gas platforms.
Corrosion-resistant copper alloys are critical for undersea installations and clean energy technologies like wind turbines and solar panels.
5. Medical Applications
Copper’s antimicrobial properties are used in medical devices, surgical tools, orthopedic implants, and radiotherapy equipment to reduce infection risks.
6. Telecommunications
Copper cables are used in telephone lines, coaxial cables, and some fiber-optic systems to transmit voice, data, and video signals.
7. Household and Kitchen Appliances
Copper is used in sinks, pots, pans, electrical fittings, and lighting fixtures due to its durability and heat conductivity.
8. Marine and Shipbuilding
Copper alloys resist seawater corrosion and biofouling, making them ideal for ship components like bolts, rivets, propellers, and condenser pipes.
Summary
Copper’s unique combination of electrical and thermal conductivity, corrosion resistance, and malleability makes it indispensable in:
Construction (wiring, plumbing)
Electronics and data infrastructure
Transportation, especially EVs
Industrial machinery and clean energy
Medical devices
Telecommunications
Household appliances
Marine applications
Copper is often called “Dr. Copper” for its role as an economic indicator due to its widespread industrial use.
Conclusion
Copper’s price action is shaped by dollar strength, real interest rates, and supply-demand dynamics. While a weaker dollar and lower real yields typically boost copper, structural factors like Chile’s supply dominance (27% of global production) and green energy demand underpin its long-term bullish case. Traders should monitor DXY trends, Fed policy shifts, and geopolitical risks in key mining regions for directional cues.
#METAL #COPPER # GOLD #SILVER #ALUMINIUM
XCUUSD trade ideas

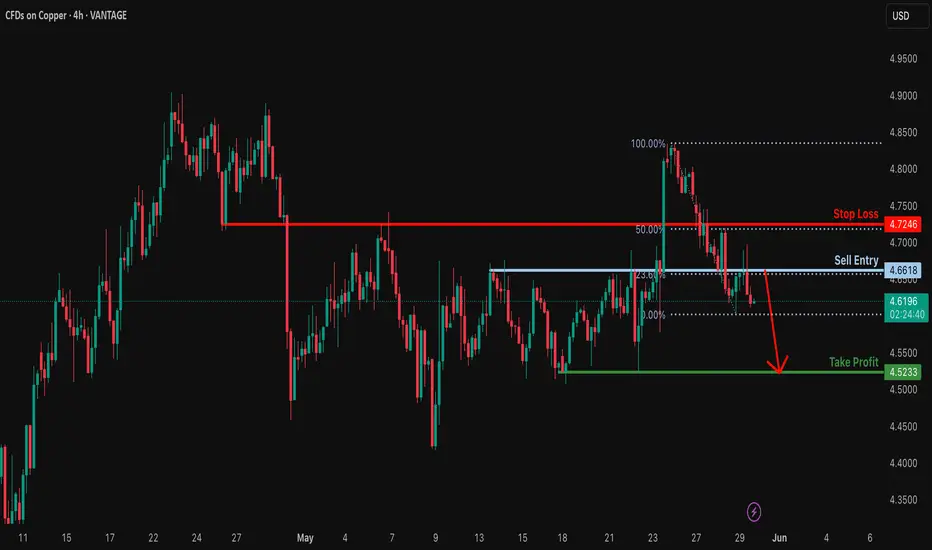
Bearish drop?COPPER has rejected off the resistance level which is a pullback resistance that lines up with the 23.6% Fibonacci retracement and could drop from this level to our take profit.
Entry: 4.6618
Why we like it:
There is a pullback resistance that lines up with the 23.6% Fibonacci retracement.
Stop loss: 4.7246
Why we like it:
There is a pullback resistance leel that lines up with the 50% Fibonacci retracement.
Take profit: 4.5233
Why we like it:
There is a pullback support level.
njoying your TradingView experience? Review us!
Please be advised that the information presented on TradingView is provided to Vantage (‘Vantage Global Limited’, ‘we’) by a third-party provider (‘Everest Fortune Group’). Please be reminded that you are solely responsible for the trading decisions on your account. There is a very high degree of risk involved in trading. Any information and/or content is intended entirely for research, educational and informational purposes only and does not constitute investment or consultation advice or investment strategy. The information is not tailored to the investment needs of any specific person and therefore does not involve a consideration of any of the investment objectives, financial situation or needs of any viewer that may receive it. Kindly also note that past performance is not a reliable indicator of future results. Actual results may differ materially from those anticipated in forward-looking or past performance statements. We assume no liability as to the accuracy or completeness of any of the information and/or content provided herein and the Company cannot be held responsible for any omission, mistake nor for any loss or damage including without limitation to any loss of profit which may arise from reliance on any information supplied by Everest Fortune Group.
Copper Nears Breakout–Fundamentals and Technicals Both Say “Buy"Copper, often called “the metal with a PhD in economics”, is sending a clear message: we’re entering a new bullish era.
As of mid-May 2025, Copper is trading above $4.85 per pound, approaching the psychological $5.00 level — a key threshold that could trigger further upside momentum.
________________________________________
🔎 Fundamentals: A Perfect Storm of Demand and Supply Pressure
Copper is no longer just about cyclical demand — it's about structural shifts:
• 🟩 Demand is exploding thanks to:
- Accelerated electrification (EVs use up to 4x more copper than traditional cars)
- Renewable energy infrastructure (cables, turbines, transformers)
- China’s infrastructure push and global energy transition
• 🟥 Supply remains constrained:
- Inventories at multi-year lows (LME + SHFE down over 40% YoY)
- Underinvestment in mining: new copper projects take 8–10 years to develop
- Smelting disruptions in Peru and DRC
- China controls ~70% of global refining capacity — a geopolitical risk amid trade tensions
📊 Big Banks Are Bullish:
• Goldman Sachs sees $10,700/ton within 12 months
• Morgan Stanley targets $9,500/ton by end of 2025
• J.P. Morgan: "Copper is at the heart of a multi-year base metals upcycle"
________________________________________
📉 Technical Outlook: Higher Lows, Strong Rebounds, and a Breakout in Sight
From a charting perspective, Copper’s structure confirms what the fundamentals are screaming:
• After topping around $5.00 in March 2022, the price dropped sharply to just above $3.00 by mid-summer
• That area marked a strong support zone, coinciding with old resistance from 2017–2018
• A higher low at $3.50 was made in October 2023, setting the tone for a new bullish phase
• Since then, Copper has respected a clear ascending trendline
🚨 The drop in late March / early April (coinciding with the start of the Tariff Saga) brought high volatility, sending price briefly from above $5.00 to around $4.00 support. But bulls stepped in fast.
Now, price is back near $5.00, threatening a major breakout.
________________________________________
🎯 What’s Next?
If Copper breaks above the $5.00 resistance zone, we could see acceleration toward the $7.00 level — a feasible medium-term target, supported by both supply/demand dynamics and price structure.
________________________________________
📊 Trading Plan:
With fundamentals and technicals aligned, the strategy is straightforward:
Buy dips, especially toward $4.60–$4.70, and look for confirmation of breakout above $5.00 for medium-term positioning.
________________________________________
📌 Big moves need big reasons — and Copper has plenty.
This may be just the beginning of a multi-year opportunity. 🚀

Bearish reversal off pullback resistance?COPPER is rising towards the resistance level which is a pullback resistance that aligns with the 145% Fibonacci extension and could reverse from this level to our take profit.
Entry: 4.8773
Why we like it:
There is a pullback resistance level that lines up with the 145% Fibonacci extension.
Stop loss: 4.9762
Why we like it:
There is a pullback resistance level.
Take profit: 4.7206
Why we like it:
There is an overlap support level.
Enjoying your TradingView experience? Review us!
Please be advised that the information presented on TradingView is provided to Vantage (‘Vantage Global Limited’, ‘we’) by a third-party provider (‘Everest Fortune Group’). Please be reminded that you are solely responsible for the trading decisions on your account. There is a very high degree of risk involved in trading. Any information and/or content is intended entirely for research, educational and informational purposes only and does not constitute investment or consultation advice or investment strategy. The information is not tailored to the investment needs of any specific person and therefore does not involve a consideration of any of the investment objectives, financial situation or needs of any viewer that may receive it. Kindly also note that past performance is not a reliable indicator of future results. Actual results may differ materially from those anticipated in forward-looking or past performance statements. We assume no liability as to the accuracy or completeness of any of the information and/or content provided herein and the Company cannot be held responsible for any omission, mistake nor for any loss or damage including without limitation to any loss of profit which may arise from reliance on any information supplied by Everest Fortune Group.

Analyzing Copper Prices Using Fibonacci ExtensionCopper, often referred to as "Dr. Copper" due to its ability to forecast economic trends, remains one of the most critical commodities in the global market.
Traders and analysts often use technical tools to forecast price movements, and Fibonacci extensions are one such tool. After testing the first golden level, it decided to dive 🏊♂️
Let's see if it belly flops again at the next golden level!
Stay tuned for the drama. 📉

Ready to Rob the Copper Market? XCU/USD Heist Plan Revealed!🌍 Hello Global Traders! 🌟
Money Makers, Risk Takers, and Market Shakers! 🤑💸✈️
Dive into our XCU/USD "Copper" Metals Market heist, crafted with the signature 🔥Thief Trading Style🔥, blending sharp technicals and deep fundamentals. Follow the strategy outlined in the TradingView chart, focusing on a long entry targeting the high-risk Yellow ATR Zone. Expect a wild ride with overbought conditions, consolidation, and potential trend reversals where bearish players lurk. 🏆💰 Celebrate your wins, traders—you’ve earned it! 💪🎉
📈 Entry: Storm the Vault!
The market’s ripe for a bullish grab! 💥 For Pullback trade place buy limit orders within the most recent 15 or 30-minute swing low/high levels. Set alerts on your chart to stay locked in. 🔔
🛑 Stop Loss: Guard Your Loot!
Set your Thief SL at the nearest swing low on the 3H timeframe for day/swing trades. Adjust based on your risk tolerance, lot size, and number of orders. Safety first! 🔒
🎯 Targets: Claim Your Prize!
🏴☠️ Short-Term Target: 5.10000
👀 Scalpers, Listen Up!
Stick to long-side scalps. Got deep pockets? Jump in now! Otherwise, join swing traders for the heist. Use trailing stop-loss to lock in gains and protect your stash. 💰
🐂 Why XCU/USD "Copper" is Hot!
The Fiber’s bullish surge is fueled by key fundamentals. Dive into Macro, COT Reports, Quantitative Analysis, Sentiment, Intermarket trends, and future targets via the linkss below for the full scoop. 👉🔗. Stay informed to stay ahead! 📰
⚠️ Trading Alert: News & Position Management
News releases can shake the market like a heist gone wrong! 🗞️ To protect your profits:
🚫 Avoid new trades during news events.
🛡️ Use trailing stops to secure running positions.
💥 Boost the Heist!
Hit the Boost Button to supercharge our Thief Trading Strategy! 💪 Every click strengthens our crew, making it easier to swipe profits daily. Join the squad, trade smart, and let’s make money rain! 🌧️💵

Copper Prices Take a Dive? Copper's price might take a dive from $4.64, thanks to the Bat harmonic pattern.
Looks like Batman’s not saving this one! 🦇📉

Super bullish on Copper! A close above the white trend line would trigger the next leg up. I do believe it can break to new ATH if it get enough momentum on the break out.
Time will tell for sure!
OANDA:XCUUSD IG:COPPER CAPITALCOM:COPPER

Copper expectation. 1HCopper setting up for bullish trend. According to fib, its setting up to bull trend in the bullish zone. Breakout is very soon. Its following trend lines but showing signs of breaking out due to support. trade accordingly towards destination.

Copper Cup and Handle ready to explode to 10,677Copper is an interesting market because it tends to follow the major markets.
It doesn't have that safe haven status feel and every broker quotes Copper differently.
Whether you're trading on US or LSE, it is subjective to the broker.
Right, now it's priming itself for great upside which could signal upside for general markets and indices.
Hopefully, the recession fears may come to an end. But we can only hope.
Once the price breaks above the brim level, the target will set to around 10,677.
Disclosure: I am part of Trade Nation's Influencer program and receive a monthly fee for using their TradingView charts in my analysis.

CopperXCUUSD
- Bearish Channel as an corrective pattern in Short Time Frame
- Change of Characteristics
- S / R Level
- Completed " 12345 " Impulsive Waves and " AB " Corrective Waves
- Break of Structure

Copper Prices Plummet Following Golden Crab Level BreachRecent market analysis indicates a potential downward price correction for copper, initiating from a significant technical level known as the "Crab's Golden Ratio."
Understanding this pivotal point is crucial for informed investment decisions.

Copper showing signs of weaknessCopper is pulling back after hitting strong resistance.
My outlook hasn’t changed — I’m expecting further downside, with targets at 4.65 and then 4.50.
As a reminder, I closed my previous short position ahead of the weekend, in line with my trading rule not to hold shorts over weekends.
At current levels, I am prepared to re-enter the position.
📝Trading Plan:
Entering a short position, placing the stop just above today’s high.

Sell!Hello all. Copper is near a very critical zone ant it will fall. do u agree? tell me why? CM if you agree or don not agree.

Copper – Sell Limit Setup (Medium-Term Swing)Published: 11/04/2025
Trade Summary
Type: Sell Limit
Entry: 9,655
Target: 8,725
Stop Loss: 10,020
Risk/Reward Ratio: ~2.5:1
Duration: Medium-Term Swing
📊 Technical View
Copper has staged a sharp rebound after the March 2025 decline. Price has now returned to the 61.8% Fibonacci retracement level, a common turning point. There is also an unfilled gap at 9,669.6, which may act as a magnet for price and attract renewed selling interest.
🧠 Fundamental Insight
Institutional interest has been steadily declining since January 2025, indicating smart money is pulling back. Meanwhile, retail traders have increased their exposure—a typical contrarian indicator pointing toward potential further downside.
📆 Seasonal Trend
From April 18 to June 27, copper prices have historically declined 64.8% of the time over the past 55 years, with an average drop of 3.60%.
Disclosure: I am part of Trade Nation's Influencer program and receive a monthly fee for using their TradingView charts in my analysis.

CopperXCUUSD
- Rising Wedge as an corrective pattern in Short Time Frame
- Resistance Level
- Change of Characteristics
- Fibonacci Level - 61.80%
- Completed " 123 " Impulsive Waves

Copper at Resistance: A Short Setup in PlayCopper has reached a strong resistance level on the daily chart.
The uptrend is fading, and visually, all signs point to a correction.
On the hourly chart, a good short entry point is shaping up.
However, the stop needs to be set quite high — 2%. So the position size should be adjusted accordingly — kept small.

Copper Rebounding from a 3-month low!Copper is bouncing back with incredible energy after hitting a 3-month low!
Get ready to see it surge towards $4.84!
But hold on tight, because after that, it's time for the "Copper Crab" to unleash a powerful dive, plunging back down into the depths!
Exciting times ahead for copper traders!
SEYED.

Bullish bounce?COPPER has bounced off the support level which is an overlap support and could rise from this level to our take profit.
Entry: 4.5751
Why we like it:
There is an overlap support level.
Stop loss: 4.4681
Why we like it:
There is a pullback support level.
Take profit: 4.8155
Why we like it:
There is a pullback resistance level that aligns with the 61.8% Fibonacci retracement.
Enjoying your TradingView experience? Review us!
Please be advised that the information presented on TradingView is provided to Vantage (‘Vantage Global Limited’, ‘we’) by a third-party provider (‘Everest Fortune Group’). Please be reminded that you are solely responsible for the trading decisions on your account. There is a very high degree of risk involved in trading. Any information and/or content is intended entirely for research, educational and informational purposes only and does not constitute investment or consultation advice or investment strategy. The information is not tailored to the investment needs of any specific person and therefore does not involve a consideration of any of the investment objectives, financial situation or needs of any viewer that may receive it. Kindly also note that past performance is not a reliable indicator of future results. Actual results may differ materially from those anticipated in forward-looking or past performance statements. We assume no liability as to the accuracy or completeness of any of the information and/or content provided herein and the Company cannot be held responsible for any omission, mistake nor for any loss or damage including without limitation to any loss of profit which may arise from reliance on any information supplied by Everest Fortune Group.

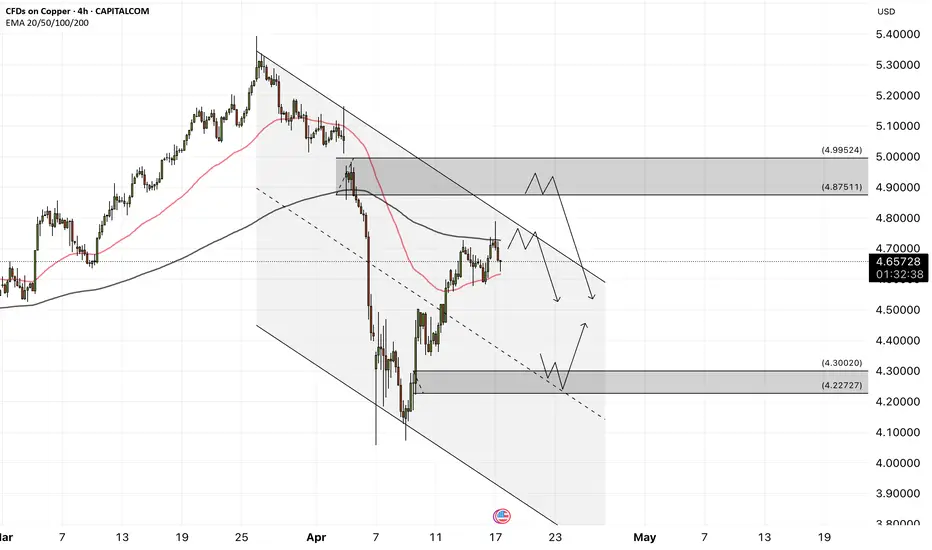
Copper: Markets are waiting for the continuation of trade tensioCopper is located between the EMA200 and EMA50 on the 4-hour timeframe and is moving in its descending channel. An upward correction of copper will provide us with a good risk-reward selling position. If the downward trend continues, we can buy copper at the next demand zone.
The World Trade Organization (WTO) has significantly downgraded its outlook for global merchandise trade in its latest report, now forecasting a 0.2% contraction in 2025. Previously, it had projected a 3% growth. The organization warned that if the United States fully enforces its reciprocal tariffs and their effects intensify, global trade could shrink by as much as 1.5%.
While the temporary suspension of some tariffs recently announced by Washington has somewhat eased the downturn in trade, the WTO emphasized that substantial downside risks remain. However, for 2026, the organization painted a more optimistic picture, anticipating a moderate 2.5% rebound in trade growth.
In a pointed address, Chinese Vice Premier He Lifeng sent a clear message to the international community, especially the U.S., asserting that China has no intention of backing down and will stand firm if its interests are threatened. His remarks came as a new wave of heavy U.S. tariffs—including duties as high as 245% on certain Chinese exports—has reignited tensions between the two economic powers.
He Lifeng affirmed that China remains a reliable trade partner for the world. He also announced increased government support for Chinese businesses engaged in foreign trade and encouraged them to leverage opportunities at the Canton Fair and explore broader global markets. According to him, China’s vast domestic market could become a key destination for high-quality imported goods.
Alongside these economic and diplomatic messages, Chinese officials’ rhetoric has turned more confrontational in response to recent U.S. actions. He dismissed what he called the U.S.’s “numerical games” and warned that China’s response to threats would be decisive. Stressing the importance of a healthy business environment, he urged officials to implement supportive policies effectively, ensuring foreign trade and economic activity proceed with greater transparency, efficiency, and ease.
Meanwhile, the global maritime shipping industry has entered a concerning phase. New data from Vizion shows that bookings for shipments to the U.S. have sharply declined following the implementation of new tariffs by the American government.
This sudden drop occurred just one week after the tariffs were imposed and reflects how businesses are reacting to deep policy uncertainty. High-traffic routes such as Shanghai to Los Angeles—which typically take 20–30 days—and routes through the Panama Canal to New York—which add another 15 days—have seen notable declines in bookings. This downturn is occurring precisely when summer orders should be peaking.
The data clearly indicates that the anticipated decline in U.S. port volumes will materialize soon and with greater intensity in May. The plunge in bookings is sounding alarms not just for importers and retailers but also for the broader logistics industry, ports, and even Asian manufacturers, potentially leading to a slowdown in all these sectors.
In parallel, Deutsche Bank’s latest report sharply downgraded the U.S. economic growth forecast for 2025 while raising inflation projections, signaling a shift in the bank’s analysis toward a stagflation scenario.
According to the report, U.S. GDP is expected to grow by only 0.9% on a quarterly basis in 2025—markedly lower than earlier estimates. Key factors behind this revision include trade tariffs, policy uncertainty, and tighter financial conditions. The new wave of tariffs, particularly those targeting Chinese imports, has been cited as a major driver of renewed inflationary pressures.
On the monetary front, Deutsche Bank warned that the abrupt economic policies of the U.S. administration have created unprecedented instability in the global financial system—an impact that will likely persist even if some tariffs are temporarily rolled back. The report also raised concerns about the future of the U.S. dollar as the world’s reserve currency and suggested that the country’s ability to finance its growing fiscal deficits could be seriously undermined.
Potential bullish rise?COPPER has bounced off the support level which is an overlap support and could rise from this level to our take profit.
Entry: 4.5751
Why we like it:
There is an overlap support level.
Stop loss: 4.4681
Why we like it:
There is a pullback support level that is slightly above the 38.2% Fibonacci retracement.
Take profit: 4.8155
Why we like it:
There is a pullback resistance level that lines up with the 61.8% Fibonacci retracement.
Enjoying your TradingView experience? Review us!
Please be advised that the information presented on TradingView is provided to Vantage (‘Vantage Global Limited’, ‘we’) by a third-party provider (‘Everest Fortune Group’). Please be reminded that you are solely responsible for the trading decisions on your account. There is a very high degree of risk involved in trading. Any information and/or content is intended entirely for research, educational and informational purposes only and does not constitute investment or consultation advice or investment strategy. The information is not tailored to the investment needs of any specific person and therefore does not involve a consideration of any of the investment objectives, financial situation or needs of any viewer that may receive it. Kindly also note that past performance is not a reliable indicator of future results. Actual results may differ materially from those anticipated in forward-looking or past performance statements. We assume no liability as to the accuracy or completeness of any of the information and/or content provided herein and the Company cannot be held responsible for any omission, mistake nor for any loss or damage including without limitation to any loss of profit which may arise from reliance on any information supplied by Everest Fortune Group.

Potential bullish rise?COPPER has broken out of the resistance level which is a pullback resistance and could rise from this level to our take profit.
Entry: 4.4701
Why we like it:
There is a pullback resistance level.
Stop loss: 4.3024
Why we like it:
There is an overlap support level that lines up with the 50% Fibonacci retracement.
Take profit: 4.7893
Why we like it:
There is a pullback resistance level that is slightly below the 61.8% Fibonacci retracement.
Enjoying your TradingView experience? Review us!
Please be advised that the information presented on TradingView is provided to Vantage (‘Vantage Global Limited’, ‘we’) by a third-party provider (‘Everest Fortune Group’). Please be reminded that you are solely responsible for the trading decisions on your account. There is a very high degree of risk involved in trading. Any information and/or content is intended entirely for research, educational and informational purposes only and does not constitute investment or consultation advice or investment strategy. The information is not tailored to the investment needs of any specific person and therefore does not involve a consideration of any of the investment objectives, financial situation or needs of any viewer that may receive it. Kindly also note that past performance is not a reliable indicator of future results. Actual results may differ materially from those anticipated in forward-looking or past performance statements. We assume no liability as to the accuracy or completeness of any of the information and/or content provided herein and the Company cannot be held responsible for any omission, mistake nor for any loss or damage including without limitation to any loss of profit which may arise from reliance on any information supplied by Everest Fortune Group.

COPPER – Chart Breakdown🟢 Copper is showing a recovery after a strong drop, now hovering above the 4.50280 support zone. Bulls are eyeing the next key resistance at 4.82320.
🔑 Marked Levels:
• Support: 4.50280 🛡 | 4.27241 ⚠ | 4.04129 🚨
• Resistance: 4.82320 ❌ | 5.09840 ❌ | 5.39367 🧱
📈 Outlook:
• Bullish Bias: If price holds above 4.50280, it may retest 4.82320.
• Bearish Outlook: Rejection around 4.82320 or a failure to stay above 4.50280 may open the door for deeper pullbacks toward 4.27241.
🎯 Wait for confirmations and follow your trading plan — market still volatile!
📘 Not financial advice. Trade responsibly.
