CopperThe Copper after COVID-19 underwent changes, this utility metal use in Electronic devices, Telecom industries, Kitchen appliance and … . due to quarantine and preferring online jobs and increasing communicating between firms via internet and working from home, The online businesses and works developed and the producing Electronic instruments and telecom infrastructures raised.
Now we are in highest value for this metal and countries started to vaccination of all people, So it seems be better for traders to going to short. I think it will has a correction during the next couple of weeks.
XCUUSD trade ideas

Copper prices are facing bearish pressure, potential reversalCopper prices are reversing nicely from our first resistance and facing bearish pressure from our descending trend line where we could see a reversal below this level. Ichimoku cloud and 20 EMA are showing signs of bearish pressure as well, in line with our bearish bias.

COPPER (XCU/USD) – Week 10 – Is the pullback over?Copper respected our previous analysis and erased 2 weeks of gains reaching the liquidity pool that is highlighted on the chart. From there the price found some support and it looks like it’s gaining some bullish momentum.
Still early days, but we are expecting the price to increase and head towards the resistance level that we highlighted on the chart. Don’t forget that at this point we strongly need a bigger corrective structure to develop, so the bullish trend could be short-lived.
Trade with care.
Best regards,
Financial Flagship
Disclaimer: The analysis provided is purely informative and it should not be used as financial advice. Remember that you need a plan before you start trading; so, take this knowledge and use it as a guidebook that will ultimately help you understand the market and easily predict your next move.

Copper Short SetupCopper Short Setup
🔵 Entry: 4.0263
🟢 TP & RR: $3.8877 (1.89)
⛔ Stop Loss: $4.0996
Trade Reasons:
✔️ Position in direction of the trend
✔️ Price reversed at the upper diagonal trend line

Copper prices are facing bearish pressure, potential reversalCopper prices are facing bearish pressure from our descending trend line and our first resistance where we could see a reversal below this level. Ichimoku cloud and 20 EMA are showing signs of bearish pressure as well, in line with our bearish bias.

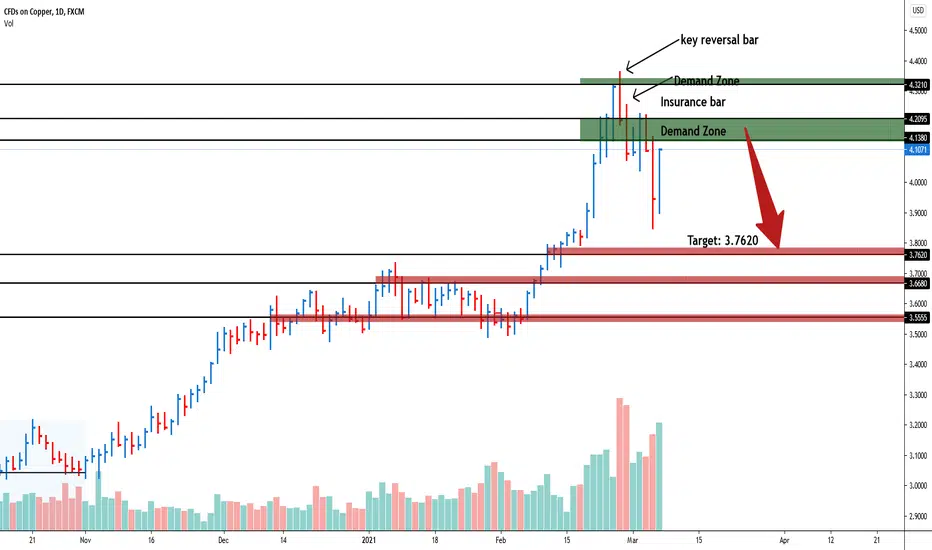
COPPER Daily Key Reversal Bar Pointing Weakness migth be 3.762025th Daily copper bar key reversal bar made a new high closed off the low. 26th daily bar widespread down bar closed off the low. 4.1380 first demand zone for short, second demand zone 4.4200. 3.7620 might be first target on downside on short position.
COPPER (XCU/USD) – Week 9 – Anticipating a bearish pullback.The copper market edged to new highs at the beginning of last week, with the price almost reaching $4.40 level before starting an aggressive bearish impulse.
It seems that the consolidation that we were talking about in our previous analysis started, as we expect more bearish momentum for this week. If we break the trendline and consolidate underneath, there is a big chance that we will hit the liquidity pool area highlighted on our chart.
Trade with care.
Best regards,
Financial Flagship
Disclaimer: The analysis provided is purely informative and it should not be used as financial advice. Remember that you need a plan before you start trading; so, take this knowledge and use it as a guidebook that will ultimately help you understand the market and easily predict your next move.

Copper prices broke key support, potential for further downsideCopper prices are facing bearish pressure from our descending trend line and approaching our first resistance where we could see a reversal below this level. Ichimoku cloud and 20 EMA are showing signs of bearish pressure as well, in line with our bearish bias.

XCUUSD Copper Breaking for next leg Hi there,
COPPER is very strong bullish and breaking for next leg watch for more upside and look for new high.
Sharp break below the flag will invalidate the buy.
Good luck

Copper is approaching support, potential bounceCopper prices are approaching our support, in line with our horizontal swing low support, 78.6% fibonacci retracement and 100% fibonacci extension where we could see a bounce above this level to our first resistance target. Stochastic is showing signs of bullish pressure as well, in line with our bullish bias.

Selling CopperSupply and Demand tracements + Bonds Yields going back up. Aiming for TP 1 at 3.5
TP 2 3.303

Copper is facing bullish pressure, potential for further upside Copper prices bounced nicely from our first support previously to reach our resistance target. We maintain our bullish outlook on Copper as prices are facing bullish pressure from our first support in line with our 61.8% fibonacci retracement and 78.6% fibonacci extension. A break above our upside confirmation level could see a further push up to our first resistance target.


Copper is approaching support, potential bounceCopper prices are approaching our first support, in line with our 38.2% fibonacci retracement and 78.6% fibonacci extension, where we could see further upside above this level. Stochastic is showing a bullish divergence as well, in line with our bullish bias.


Copper is approaching support, potential bounce Copper prices are facing bullish pressure from our first support, in line with our 38.2% fibonacci retracement and 78.6% fibonacci extension, where we could see further upside above this level.


COPPER (XCU/USD) – Week 8 – Caution required.The copper market edged to new highs, with prices pushing above $4 a pound, its highest level since September 2011. However, we recommend caution as the rally looks a little unstable and overbought and a strong “bearish” impulse could be waiting around the corner. Yes, we are in a strong weekly uptrend, but we need at some point to start a bigger degree corrective pattern.
For this week, we expect the price to pullback towards the trendline, having a big chance to make a new higher-high.
Trade with care.
Best regards,
Financial Flagship
Disclaimer: The analysis provided is purely informative and it should not be used as financial advice. Remember that you need a plan before you start trading; so, take this knowledge and use it as a guidebook that will ultimately help you understand the market and easily predict your next move.

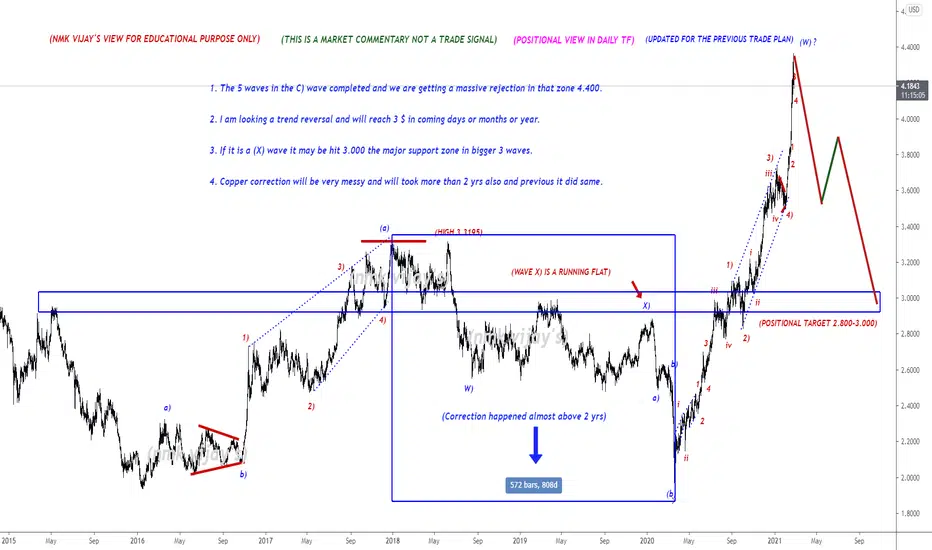
COPEER-Completed 5 waves in "C" wave @ the HIGH.Dear friends,
Don't follow me blindly...what i am sharing here, is my knowledge not signals
I am sharing my view through Elliott waves from past 4 yrs....i learned tons and tons here and market taught me lot and still teaching and i am listening to the market...and i am getting a lot of PM's regarding NEGATIVE COMMENTS from my friends...i am sharing here my view for a educational purpose and i am still a learner and i am sharing not my only my view and my experience if u PURELY LISTENNED to my MARKET COMMENTARY... i am not a market mover...just i am keep changing my view according to the PRICE ACTION and i written detailly about that in market commentary...there is no short cut to earn money and cant make a fast cash...if u do that also it may go like that....
My ambition is to create an awareness to the traders, to promote the education not to do BLINDLY...If u look my past 4 yrs chart and now...i fine tuned or refined my strategy...and still looking for finetune...so if u r following my trade plans as a signal its not my fault...If you are not encouraging also not mind but dont discourage...if you are not comment also dont leave the negative comments, if you are not motivate also dont demotivate...because NAGATIVE is more powerful than POSITIVE...i wont care about such comments...because of your comments i wont stop anything in MY PRACTICE...it will take time and to digest such comments for first 2-3 days and again i rebuilt my positive activity and my view and then again i keep start my sharing...i dont need a roadblocks in my journey. If it happen also i need to cross that and i continue...but that crossing time is DELAY for my journey to reach my GOAL...so try to be a friend...just learn or leave .if you didnt like a page in your story book just turn that... Don't look that, Like that dont look my chart...just skip that...thanks lot ...here some quotes by BRUCE LEE...
1. I fear not the man who has practiced 10,000 kicks once, but i fear the man who has practiced one kick 10,000 times "
2. A GOAL is not always meant to be reached, it often serves simply as something to AIM at
3. Those who are UNAWARE they are walking in darkness will never seek the light
4. To hell with circumstances i create the opportunities
5. I don't teach you anything. I just help you to know yourself
6. Always be yourself, express yourself, have a faith in yourself, do not go out and look for a successful personality and duplicate it.
7. Don't fear failure... in great attempts it is glorious even to fail
8. Absorb what is useful, reject what is useless, add what is specifically your own
9. Notice that stiffest tree is most easily cracked, while the bamboo or willow survives by bending with the wind
10. The successful warrior is the average man with laser-like FOUCS -
Market Commentary:
LEARNING ELLIOTT WAVES IS LITTLE BIT TOUGH (FOR ME IN BEGINNING) BUT I TOOK IT AS A CHALLENGE AND THAT IS NOT IMPOSSIBLE ALSO...
First have an look for the positional trend i shared here previous....if you are a follower of me...and sometimes i will share the counter trend trade also in 15 mins and 1hr...but that is risky ones...so if the trend is bearish or bullish, if i am expecting the correction...book the profit there and wait the correction to end and again go with the trend....DONT TRADE THE COUNTER TRADE SETUP...you will took loss too...try to identify the short term pull back and the long term pull back after that took small lots in the short term PB with strict stop and go with big lots in the trend side that is long term. I WONT TOOK ALL THE TRADE PLAN SHARED HERE...
Read the market commentary inside the chart what i shared here carefully and try to learn Elliott waves...otherwise its tough to understand the market commentary and my analysis. I wont give a entry, stop loss and take profit in my chart...it is only for EDUCATIONAL PURPOSE and i am sharing how i am analyzing the pair and labeling them according to the Elliott wave theory...I AM JUST SHOWING THE TREND HOW IT MAY GO AND MY VIEW(it may wrong too)..so DON'T FOLLOW BLINDLY MY CHART..take this as a reference and if it correlate to you strategy took the trade as per your strategy...DON'T ASK ABOUT YOUR RUNNING TRADES i wont comment on them and I WONT SUGGEST TO TAKE MY TRADE SETUP.
I am a technical analyst based on trendline, channel, fib retracements, expansion, stochastic for divergence, EMA's and MA's are finding the pull backs and MAJOR IS ELLIOTT WAVES...those mentioned above are using as a TOOLS only. I am not a fundamental, sentimental trader...but only the fundamental will boost my technical analysis to reach my target or sometimes it will go against me and then i will manage the trade according to the Elliott waves alternate views...Each and every trade plan i am sharing here has a alternate view and i am sharing only the most probabilities(70-80%) here...sometimes the other (20-30%) may market do..then i will change the wave counts and labeling according to the price action.
All labeling and wave counts done by me by manually and i will keep change according to the LIVE MARKET PRICE ACTION. So dont bias, hope on my trade plans...try to learn and make your own strategy...Following is not that much easy...I AM NOT RESPONSIBLE FOR ANY LOSSES IF U TOOK THE TRADE ACCORDING TO MY TRADE PLANS....THANKS LOT..CHEERS
Copper is facing bullish pressure, potential for further upsideCopper prices are facing bullish pressure from our first support, where we could see further upside above this level. Stochastic is showing signs of bullish pressure as well, in line with our bullish bias.

Copper Short SetupCopper Short Setup
🔵 Entry: $4.327
🟢 TP & RR: $4.140 (2.02)
⛔ Stop Loss: $4.420
Trade Reasons:
✔️ 1.618 Fib Level Extension
✔️Market Flow overbought level
📝 Fairly basic setup, trying to capitilize on a potential pullback.

Copper is facing bullish pressure, potential for further upsideCopper prices are facing bullish pressure from our first support, where we could see further upside above this level. Ichimoku cloud and EMA are showing signs of bullish pressure as well, in line with our bullish bias.
