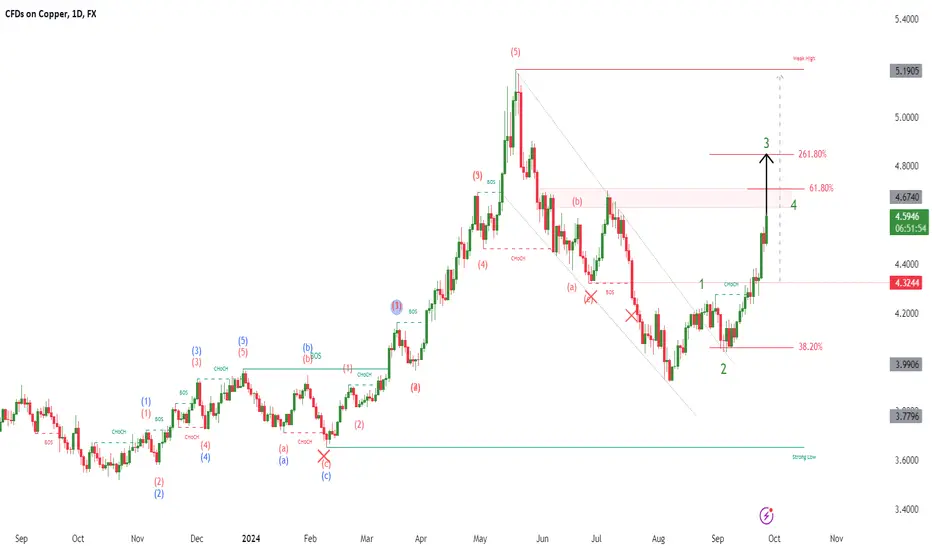
Copper prepares for the takeoffCopper is consolidating at the support zone, preparing for the upswing. November-December are the best seasonal months for this commodity according to the 15-year seasonal historical studies. Metals group is being pushed higher amid the "soft landing" narrative starting to evolve in the markets. Precious metals are already on the move, Copper might be next.
Today is the second day of recovery which gives a decent timing for building a long position with a first target of $4.7, and next possible targets above this area.
Don't forget - this is just the idea, always do your own research before taking any risk.
XCUUSD trade ideas

Copper Pair : XCUUSD ( Copper / U.S Dollar )
Description :
Bearish Channel as an Corrective Pattern in Short Time Frame
Break of Structure
Fibonacci Level - 61.80% / 78.60%
CHOCH
Demand Zone

Potential bullish rise?COPPER has reacted off the resistance level which is an overlap resistance and could rise from this level to our take profit.
Entry: 4.3566
Why we like it:
There is an overlap resistance level.
Stop loss: 4.2689
Why we like it:
There is a pullback support level.
Take profit: 4.4561
Why we like it:
There is a pullback support level that aligns with the 50% Fibonacci retracement.
Enjoying your TradingView experience? Review us!
Please be advised that the information presented on TradingView is provided to Vantage (‘Vantage Global Limited’, ‘we’) by a third-party provider (‘Everest Fortune Group’). Please be reminded that you are solely responsible for the trading decisions on your account. There is a very high degree of risk involved in trading. Any information and/or content is intended entirely for research, educational and informational purposes only and does not constitute investment or consultation advice or investment strategy. The information is not tailored to the investment needs of any specific person and therefore does not involve a consideration of any of the investment objectives, financial situation or needs of any viewer that may receive it. Kindly also note that past performance is not a reliable indicator of future results. Actual results may differ materially from those anticipated in forward-looking or past performance statements. We assume no liability as to the accuracy or completeness of any of the information and/or content provided herein and the Company cannot be held responsible for any omission, mistake nor for any loss or damage including without limitation to any loss of profit which may arise from reliance on any information supplied by Everest Fortune Group.

CopperPair : XCUUSD ( Copper / U.S Dollar )
Description :
Completed " 12345 " Impulsive Waves
Falling Wedge as an Corrective Pattern in Short Time Frame
Fibonacci Level - 61.80% / 78.60%
Break of Structure
Demand Zone


#Copper #Elliot #D.zElliott wave 4 is over and we are completing wave 5. The price reacts to the demand zone at the same time.
int:4/3146
sl:4/2761

Heading into pullback resistance?COPPER is rising towards the resistance level which is a pullback resistance that is slightly below the 38.2% Fibonacci retracement and could reverse from this level to our take profit.
Entry: 4.3566
Why we like it:
There is a pullback resistance level that is slightly below the 38.2% Fibonacci retracement.
Stop loss: 4.4606
Why we like it:
There is a pullback resistance level that lines up with the 50% Fibonacci retracement.
Take profit: 4.2603
Why we like it:
There is an overlap support level that lines up with the 61.8% Fibonacci retracement.
Enjoying your TradingView experience? Review us!
Please be advised that the information presented on TradingView is provided to Vantage (‘Vantage Global Limited’, ‘we’) by a third-party provider (‘Everest Fortune Group’). Please be reminded that you are solely responsible for the trading decisions on your account. There is a very high degree of risk involved in trading. Any information and/or content is intended entirely for research, educational and informational purposes only and does not constitute investment or consultation advice or investment strategy. The information is not tailored to the investment needs of any specific person and therefore does not involve a consideration of any of the investment objectives, financial situation or needs of any viewer that may receive it. Kindly also note that past performance is not a reliable indicator of future results. Actual results may differ materially from those anticipated in forward-looking or past performance statements. We assume no liability as to the accuracy or completeness of any of the information and/or content provided herein and the Company cannot be held responsible for any omission, mistake nor for any loss or damage including without limitation to any loss of profit which may arise from reliance on any information supplied by Everest Fortune Group.

coppercopper will continue on the demand foot,the industrial application and commercial demand will push price high.
the on going middle east tension will support demand and push price back into 5$ zone

COPPERCOPPER, copper have huge commercial and industrial application. The price will continue to surge and on the weekly line chart the price action is giving a double bottom a bullish price action and the neckline is broken and retested.
i expect the structure to keep its promise

copper bullishThe copper chart looks very strong. The price changed direction before reaching the pivot area at 4.33. It will reach 4.68 levels again in the coming weeks, along with market expectations.

Copper 10-10Pair : XCUUSD ( Copper / U.S Dollar )
Description :
Resistance Level
Completed " 12345 " Impulsive Waves
Break of Structure
RSI - Divergence
Bearish Channel as an Corrective Pattern in Short Time Frame

Copper Pulls Back as China Optimism FadesCopper extended the August rebound into autumn and reached three-month highs, helped by the Fed’s jumbo rate cut and massive stimulus from Chinese authorities aiming to prop the economy and the property sector. However the measures do little to address the structural problems and the real estate market is unlikely to return to its former glory, while the lack of follow through on the fiscal front this week caused prior optimism to subside. Furthermore, the Fed has struck a more cautious approach towards further easing and Friday’s strong jobs report supported the reserved commentary. Markets have now priced out previous aggressive bets for 75 bps of cuts this year, aligning with the Fed’s 50 bps projections.
Copper pulls back as a result, threatening the EMA200 (black line) and the 50% Fibonacci of the recent recovery. A breach would pause the upside bias, send the non-ferrous metal into the daily Ichimoku Cloud and expose it to the ascending trend line from the August lows. Deeper correction however does not look easy under the current technical and fundamental backdrop.
There are still hopes for additional Chinese stimulus (potentially within the weekend), while prospects of US soft-landing and easier monetary policies in major economies can support higher prices. So do the AI boom and the green energy transition. Copper tries to defend the EMA200 that maintains its recovery momentum. This will allow it to push again towards 4.791, but we are cautious around further strength at this stage.
Stratos Markets Limited (www.fxcm.com):
CFDs are complex instruments and come with a high risk of losing money rapidly due to leverage. 64% of retail investor accounts lose money when trading CFDs with this provider . You should consider whether you understand how CFDs work and whether you can afford to take the high risk of losing your money.
Stratos Europe Ltd (trading as “FXCM” or “FXCM EU”) (www.fxcm.com):
CFDs are complex instruments and come with a high risk of losing money rapidly due to leverage. 66% of retail investor accounts lose money when trading CFDs with this provider . You should consider whether you understand how CFDs work and whether you can afford to take the high risk of losing your money.
Stratos Trading Pty. Limited (www.fxcm.com):
Trading FX/CFDs carries significant risks. FXCM AU (AFSL 309763). Please read the Financial Services Guide, Product Disclosure Statement, Target Market Determination and Terms of Business at www.fxcm.com
Stratos Global LLC (www.fxcm.com):
Losses can exceed deposits.
Any opinions, news, research, analyses, prices, other information, or links to third-party sites contained on this video are provided on an "as-is" basis, as general market commentary and do not constitute investment advice. The market commentary has not been prepared in accordance with legal requirements designed to promote the independence of investment research, and it is therefore not subject to any prohibition on dealing ahead of dissemination. Although this commentary is not produced by an independent source, FXCM takes all sufficient steps to eliminate or prevent any conflicts of interests arising out of the production and dissemination of this communication. The employees of FXCM commit to acting in the clients' best interests and represent their views without misleading, deceiving, or otherwise impairing the clients' ability to make informed investment decisions. For more information about the FXCM's internal organizational and administrative arrangements for the prevention of conflicts, please refer to the Firms' Managing Conflicts Policy. Please ensure that you read and understand our Full Disclaimer and Liability provision concerning the foregoing Information, which can be accessed via FXCM`s website:
Stratos Markets Limited clients please see: www.fxcm.com
Stratos Europe Ltd clients please see: www.fxcm.com
Stratos Trading Pty. Limited clients please see: www.fxcm.com
Stratos Global LLC clients please see: www.fxcm.com
Past Performance is not an indicator of future results.

coppercopper is following a structure and the the trend of the price will make a move up.price is on a confluence and the more probability the greater the wining ratio

#COPPER 4HThe copper market on the 4-hour chart is showing signs of a bearish trend, with a notable support level breakdown. This indicates weakening buying pressure, leading to a potential sell opportunity.
Key Insights:
1. Support Breakdown: The price has recently breached a critical support level, suggesting a shift in market sentiment from bullish to bearish.
2. Pattern Formation: Prior to the breakdown, a bearish pattern (such as a descending triangle or head and shoulders) was forming, hinting at a reversal or continuation of a downtrend.
3.Volume Confirmation: Increased selling volume at the time of the breakdown reinforces the potential for further downside movement.
4.Target Zones:
- Immediate downside targets lie at previous lows or Fibonacci retracement levels.
- If the selling momentum continues, a deeper decline could be anticipated, potentially testing major support zones.
5.Stop-Loss Considerations: A protective stop-loss above the broken support or the latest swing high is advised to manage risk in case of a reversal.
Trading Strategy:
Entry: Enter sell positions after confirmation of the support breakdown on the 4H chart.
Take Profit: Set take-profit levels at key support levels below the breakdown point.
Stop Loss: Place a stop loss slightly above the previous support (now turned resistance) or the latest swing high.
This technical analysis suggests that if the current conditions hold, selling #COPPER on the 4-hour timeframe could be a strong move for short-term traders.

Is copper leading the heat upwards, or is it misconducting us?On the 4H CAPITALCOM:COPPER has formed a rising wedge. Following the drop from Aug 27 it hit the Fib sweet spot, retraced, and then dropped quite a bit. It has now turned and crossed significant Fib levels on its way up and is currently resting on the 61.8% level. The 50EMA is also crossing up through the 100EMA. A retrace into the sweet spot (50% - 61.8%) could be considered a false break, as it would also break the lower wedge line. There is some resistance ahead, in my opinion the strongest will be in the $4.30 area as this is the most recent high. Looking further back, the high is $5.172. There is also news coming out of China that demand is picking up. My first target would be the resistance around $4.30, this would also be a break of structure on the daily, and if this breaks the next recent high is $4.689 from early July.

COPPERPair : Copper CU
Description :
Completed " 12345 " Impulsive Waves
Break of Structure
Bearish Channel as an Corrective Pattern in Short Time Frame
RSI - Divergence
O-B

Copper on a possible breakout retest, resumption of a half-cycleCopper on a possible breakout retest, resumption of a half-cycle low.
28 days of what appears to be a weekly and daily cycle low. There could be significant gains until the end of October.
Entry: 9.984
Stop Loss (SL): 8.520
(The chart may look slightly different for you depending on the instrument you use.)

Copper 1D Long – Targeting 0.5-0.6 Fibonacci LevelsCopper is showing signs of a potential bullish move on the daily chart. The setup suggests a possible retracement before a continuation to higher levels. We’re targeting the 0.5 to 0.6 Fibonacci retracement levels, with price targets set between 4.5000 and 4.7000.
Technical Analysis:
• Fibonacci Levels: The 0.5 to 0.6 Fibonacci retracement levels align with previous resistance areas, making them key targets for this move.
• Trendline Breakout: The price has broken through a descending trendline, signaling a potential shift in momentum to the upside.
• Retest Expectation: We might see a retest of the breakout level before the price resumes its upward movement.
Trade Setup:
• Entry: Enter a long position on a potential retest or near the current level, anticipating further upward movement.
• Target: The primary targets are the 4.5000 to 4.7000 range, which aligns with the 0.5-0.6 Fibonacci levels.
• Stop-Loss: Remember, this is a swing trade, so it could take a few days to potentially extend to weeks. It’s important to understand this trading style and adjust your position size accordingly to accommodate the longer timeframe and potential market fluctuations.
This Copper trade leverages a potential shift in trend with clear targets and risk management strategies. Keep an eye on the retest for a better entry, and stay focused on the price action as it develops.
Note: Please remember to adjust this trade idea according to your individual trading conditions, including position size, broker-specific price variations, and any relevant external factors. Every trader’s situation is unique, so it’s crucial to tailor your approach to your own risk tolerance and market environment.

Copper CUPair : Copper CU
Description :
Completed " 1234 " Impulsive Waves
Break of Structure
RSI - Divergence
Falling Wedge as an Corrective Pattern in Short Time Frame
Demand Zone
Copper Gets Double Boost from China Stimulus & Fed Jumbo CutThe Fed’s outsized pivot last week and guidance for multiple cuts ahead helped copper’s recovery, as it increases chances of a soft landing for the worlds largest economy. Furthermore, lower rates are expected to bring mortgages down and help the real estate market.
Copper got a second boost this week, from a massive monetary stimulus package from China - the world’s top consumer. Authorities have been enhancing their efforts to prop the sputtering economy recently and the new measures constitute a step up. Crucially, these include lower mortgage rates on existing home loans and a reduction in rates for second homes, in further support for the ailing property sector.
These developments lead copper towards a third straight profitable week and the best month since April, with bulls now getting the opportunity to tackle 4.700. Along with the return of AI euphoria that drives the rebound of the chip industry (where copper is a critical component), there are prospects for further gains.
On the other hand, the Fed’s frontloading creates risk for inflation persistence and less cuts in the future, while China’s actions are in the right direction, but bolder measures are needed on the fiscal front. Furthermore, the move looks stretched technically so a pullback towards the EMA200 (black line) would not be unreasonable. However, the downside appears well protected and sustained weakness below the EMA200 looks hard.
Stratos Markets Limited (www.fxcm.com):
CFDs are complex instruments and come with a high risk of losing money rapidly due to leverage. 62% of retail investor accounts lose money when trading CFDs with this provider . You should consider whether you understand how CFDs work and whether you can afford to take the high risk of losing your money.
Stratos Europe Ltd (trading as “FXCM” or “FXCM EU”) (www.fxcm.com):
CFDs are complex instruments and come with a high risk of losing money rapidly due to leverage. 59% of retail investor accounts lose money when trading CFDs with this provider . You should consider whether you understand how CFDs work and whether you can afford to take the high risk of losing your money.
Stratos Trading Pty. Limited (www.fxcm.com):
Trading FX/CFDs carries significant risks. FXCM AU (AFSL 309763). Please read the Financial Services Guide, Product Disclosure Statement, Target Market Determination and Terms of Business at www.fxcm.com
Stratos Global LLC (www.fxcm.com):
Losses can exceed deposits.
Any opinions, news, research, analyses, prices, other information, or links to third-party sites contained on this video are provided on an "as-is" basis, as general market commentary and do not constitute investment advice. The market commentary has not been prepared in accordance with legal requirements designed to promote the independence of investment research, and it is therefore not subject to any prohibition on dealing ahead of dissemination. Although this commentary is not produced by an independent source, FXCM takes all sufficient steps to eliminate or prevent any conflicts of interests arising out of the production and dissemination of this communication. The employees of FXCM commit to acting in the clients' best interests and represent their views without misleading, deceiving, or otherwise impairing the clients' ability to make informed investment decisions. For more information about the FXCM's internal organizational and administrative arrangements for the prevention of conflicts, please refer to the Firms' Managing Conflicts Policy. Please ensure that you read and understand our Full Disclaimer and Liability provision concerning the foregoing Information, which can be accessed via FXCM`s website:
Stratos Markets Limited clients please see: www.fxcm.com
Stratos Europe Ltd clients please see: www.fxcm.com
Stratos Trading Pty. Limited clients please see: www.fxcm.com
Stratos Global LLC clients please see: www.fxcm.com
Past Performance is not an indicator of future results.

Copper Supported by the Fed’s Jumbo CutAfter May’s record peak, copper prices slumped as demand optimism went away due to US and China economic fears, EV adoption slowdown and AI euphoria giving way to skepticism. However, copper staged a rebound, as China has been stepping up its effort to prop the economy, while AI optimism returned recently lifting tech and chip-making sectors. Furthermore US recession fears were quelled after the Fed slashed rates by a jumbo 0.5% last week and pointed to aggressive easing ahead, in what could be a boon for the property sectors where copper is used heavily.
These forces have helped the non-ferrous metal regain control above the EMA200, providing the launch pad for reclaiming the 4.500 handle. This would bring the summer high in the spotlight (4.700), although this level has a higher degree of difficulty.
On the other hand, the Fed’s frontloading creates risk of renewed inflation pressures that could lead to a shallower easing path, while China economic problems persist and the real estate sector remains in distress. Copper starts the current week on the back foot, unable to capitalize on its recent bounce. This sustains risk of sub-EMA200 moves that would pause the momentum, but the downside contains many buffers and prolonged weakness does not look easy, technically nor fundamentally.
Stratos Markets Limited (www.fxcm.com):
CFDs are complex instruments and come with a high risk of losing money rapidly due to leverage. 62% of retail investor accounts lose money when trading CFDs with this provider . You should consider whether you understand how CFDs work and whether you can afford to take the high risk of losing your money.
Stratos Europe Ltd (trading as “FXCM” or “FXCM EU”) (www.fxcm.com):
CFDs are complex instruments and come with a high risk of losing money rapidly due to leverage. 59% of retail investor accounts lose money when trading CFDs with this provider . You should consider whether you understand how CFDs work and whether you can afford to take the high risk of losing your money.
Stratos Trading Pty. Limited (www.fxcm.com):
Trading FX/CFDs carries significant risks. FXCM AU (AFSL 309763). Please read the Financial Services Guide, Product Disclosure Statement, Target Market Determination and Terms of Business at www.fxcm.com
Stratos Global LLC (www.fxcm.com):
Losses can exceed deposits.
Any opinions, news, research, analyses, prices, other information, or links to third-party sites contained on this video are provided on an "as-is" basis, as general market commentary and do not constitute investment advice. The market commentary has not been prepared in accordance with legal requirements designed to promote the independence of investment research, and it is therefore not subject to any prohibition on dealing ahead of dissemination. Although this commentary is not produced by an independent source, FXCM takes all sufficient steps to eliminate or prevent any conflicts of interests arising out of the production and dissemination of this communication. The employees of FXCM commit to acting in the clients' best interests and represent their views without misleading, deceiving, or otherwise impairing the clients' ability to make informed investment decisions. For more information about the FXCM's internal organizational and administrative arrangements for the prevention of conflicts, please refer to the Firms' Managing Conflicts Policy. Please ensure that you read and understand our Full Disclaimer and Liability provision concerning the foregoing Information, which can be accessed via FXCM`s website:
Stratos Markets Limited clients please see: www.fxcm.com
Stratos Europe Ltd clients please see: www.fxcm.com
Stratos Trading Pty. Limited clients please see: www.fxcm.com
Stratos Global LLC clients please see: www.fxcm.com
Past Performance is not an indicator of future results.

Bullish momentum to extend?COPPER is falling towards the support level which is a pullback support that align with the 23.6% Fibonacci retracement and could bounce from this level to our take profit.
Entry: 4.2646
Why we like it:
There is a pullback support level that aligns with the 23.6% Fibonacci retracement.
Stop loss: 4.2003
Why we like it:
There is an overlap support level that lines up with the 38.2% Fibonacci retracement.
Take profit: 4.3858
Why we like it:
There is a pullback resistance level that lines up with the 138.2% Fibonacci extension.
Enjoying your TradingView experience? Review us!
Please be advised that the information presented on TradingView is provided to Vantage (‘Vantage Global Limited’, ‘we’) by a third-party provider (‘Everest Fortune Group’). Please be reminded that you are solely responsible for the trading decisions on your account. There is a very high degree of risk involved in trading. Any information and/or content is intended entirely for research, educational and informational purposes only and does not constitute investment or consultation advice or investment strategy. The information is not tailored to the investment needs of any specific person and therefore does not involve a consideration of any of the investment objectives, financial situation or needs of any viewer that may receive it. Kindly also note that past performance is not a reliable indicator of future results. Actual results may differ materially from those anticipated in forward-looking or past performance statements. We assume no liability as to the accuracy or completeness of any of the information and/or content provided herein and the Company cannot be held responsible for any omission, mistake nor for any loss or damage including without limitation to any loss of profit which may arise from reliance on any information supplied by Everest Fortune Group.

XCUUSDPair : XCUUSD ( Copper / U.S Dollar )
Description :
Completed " 12345 " Impulsive Waves and " ABC " Corrective Waves
Break of Structure
Fibonacci Level - 78.60%
Symmetrical Triangle as an Corrective Pattern in Short Time Frame
Demand Zone
