XRP $1.95DISCLAIMER:
This analysis is for educational and informational purposes only and does not constitute financial advice. I am not a licensed financial advisor or professional trader. Always do your own research and consult with a qualified financial professional before making any trading decisions.
Key facts today
Key stats
About XRP
One of the old timers of the cryptoverse, Ripple was founded in 2012 as a digital payment network for businesses and institutions. Kinda like crypto’s SWIFT, if you like. And its native token XRP earns brownie points for being one of the most environmentally friendly and cheap-to-transfer cryptos — which is good considering that’s its main use case. However, since 2020, Ripple has been caught up with the SEC due to selling XRP as an allegedly unregistered security, which has been a thorn in its side for a while.
Related pairs

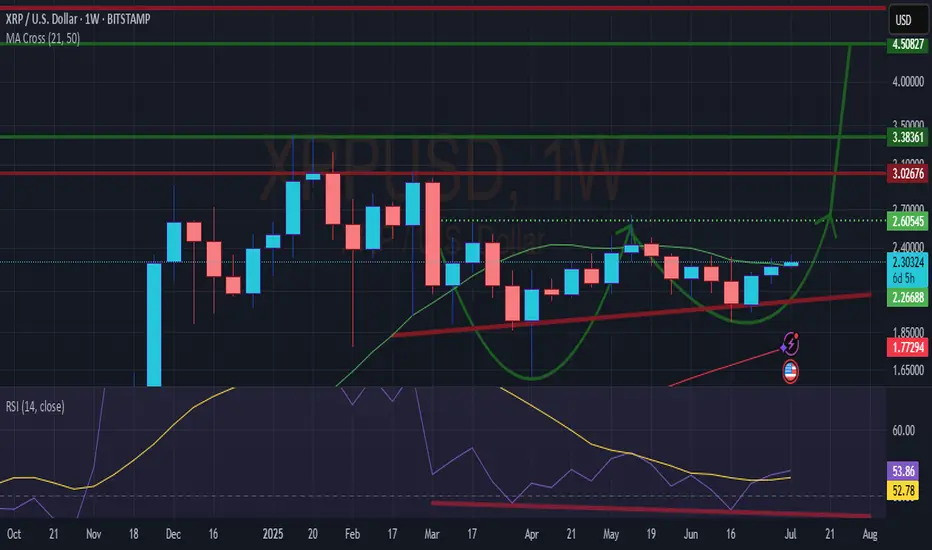
XRP Breakout with Target at $4.80XRP just broke out of a typical complex wave 4 Elliott wave formation by completing the last 2D-candle. Consider taking profits in steps as wave 5 is often surprisingly short and disappointing. A $5–6 target is possible if bullish momentum persists, but monitor for early reversal signs.

ABC Correction to 0.702FIB?The B Leg might be in, UNLESS it breaks the ATH, this chart is invalid.
IMO, the real C leg WILL hit $0.94 -$0.74 hitting the 0.702FIB to hit the back test and $13/$17 narrative.

XRP .. few weeks before next bull?A new low is possible before Bull run!
it may be huge or one candle ,,
don't take the fractal exactly as you see for every movement

XRPUSD Double BottomHi all, looking on the weekly, this might be a larger run ahead of us.
The weekly shows a Double Bottom, With Hidden Bullish Divergence.
Should reach $4.5 according to the larger cup size, maybe $5.
The divergence makes it more probable to break out.
Not financial advice, just my next move.
Happy
$1.21.... 0.702fib retestdont hate, but xrp didnt break out of the flag pole yet and potentially building a C leg down to $1.21 to retest the 0.702fib.
$1.21 being a wick grab if youre an xrp crackhead buying at 3am.
BUT, if xrp does breakout of the flag pole, buy the C leg on the backtest of the top of the pole.

XRP ($15-$22) (Might Overextend to $27-$33)XRP ($15-$22) (Might Overextend to $27-$33). I am not sure about the next bear market bottom, my numbers have been coming to $4.50-$6.50

XRPIT has rejection from base AOi and looks like it will head up till the base line rejection of xrp

XRP: A Trader's Gambit or an Investor's FortuneXRP at the Crossroads: A Trader's Gambit or an Investor's Fortune?
The digital asset XRP currently finds itself in a fascinating and precarious position, presenting a narrative so divided it could belong to two entirely different assets. For the short-term trader, the charts are painting a picture

XRP / USD - SHORT TERM TREND UPDATEXRP is coiled in a large symmetrical triangle across all major timeframes (4H, 1D, 1W), with momentum building. The key level to watch is a breakout above $2.50 with strong volume, which could push price toward $3.20–$3.40. On the downside, if $2.00 breaks with conviction, expect a retest of the $1.

See all ideas
Displays a symbol's price movements over previous years to identify recurring trends.
Curated watchlists where XRPUSD is featured.

Eco-friendly crypto tokens: Green cryptocurrencies
14 No. of Symbols

Gen 1 crypto: from little acorns grow
15 No. of Symbols

Top altcoins: Choose your alternatives carefully
28 No. of Symbols
See all sparks
Frequently Asked Questions
XRP (XRP) reached its highest price on Feb 16, 2018 — it amounted to 501.102 USD. Find more insights on the XRP price chart.
See the list of crypto gainers and choose what best fits your strategy.
See the list of crypto gainers and choose what best fits your strategy.
XRP (XRP) reached the lowest price of 0.538 USD on Mar 29, 2018. View more XRP dynamics on the price chart.
See the list of crypto losers to find unexpected opportunities.
See the list of crypto losers to find unexpected opportunities.
The safest choice when buying XRP is to go to a well-known crypto exchange. Some of the popular names are Binance, Coinbase, Kraken. But you'll have to find a reliable broker and create an account first. You can trade XRP right from TradingView charts — just choose a broker and connect to your account.
You can discuss XRP (XRP) with other users in our public chats, Minds or in the comments to Ideas.