XRP $1.95DISCLAIMER:
This analysis is for educational and informational purposes only and does not constitute financial advice. I am not a licensed financial advisor or professional trader. Always do your own research and consult with a qualified financial professional before making any trading decisions.
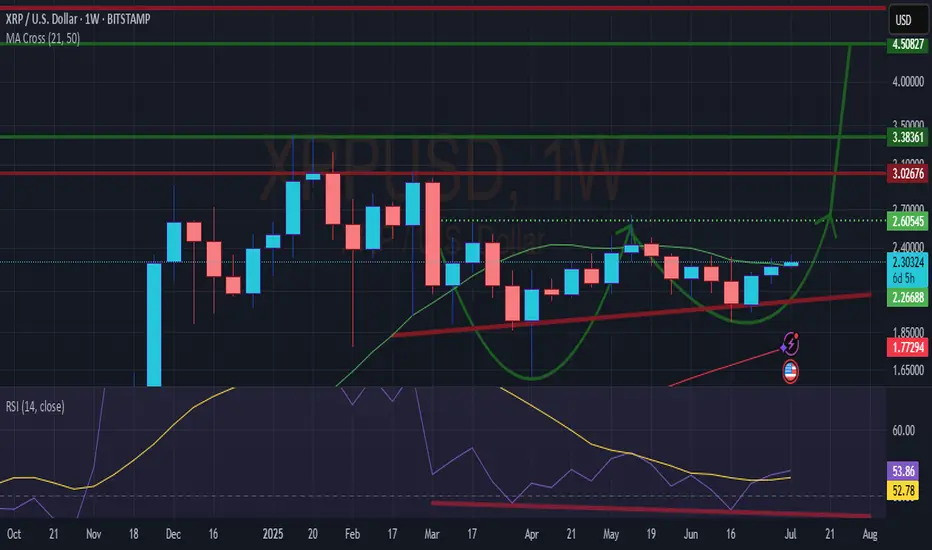
XRP is showing clear signs of weakness as price approaches the long-term descending trendline. Back on May 14th, we saw a strong bearish reaction — a thick-bodied candle rejecting directly off the trendline. Since then, price has struggled to revisit the trendline, failing to even tap it again.
Most recently, XRP has been leaving repeated upside wicks, suggesting aggressive sell orders are filling around the 1.27 extension, which I believe is being defended by a hidden bearish order block. Price action confirms that buyers are being absorbed before a full retest of the trendline.
This reinforces the short bias with a setup targeting a break below $1.95.
• Entry: Below $2.22
• Stop Loss: $2.2675
• Take Profit: $1.95
XRPUSD trade ideas

XRP Breakout with Target at $4.80XRP just broke out of a typical complex wave 4 Elliott wave formation by completing the last 2D-candle. Consider taking profits in steps as wave 5 is often surprisingly short and disappointing. A $5–6 target is possible if bullish momentum persists, but monitor for early reversal signs.

ABC Correction to 0.702FIB?The B Leg might be in, UNLESS it breaks the ATH, this chart is invalid.
IMO, the real C leg WILL hit $0.94 -$0.74 hitting the 0.702FIB to hit the back test and $13/$17 narrative.

XRP .. few weeks before next bull?A new low is possible before Bull run!
it may be huge or one candle ,,
don't take the fractal exactly as you see for every movement

XRPUSD Double BottomHi all, looking on the weekly, this might be a larger run ahead of us.
The weekly shows a Double Bottom, With Hidden Bullish Divergence.
Should reach $4.5 according to the larger cup size, maybe $5.
The divergence makes it more probable to break out.
Not financial advice, just my next move.
Happy & safe trading.
$1.21.... 0.702fib retestdont hate, but xrp didnt break out of the flag pole yet and potentially building a C leg down to $1.21 to retest the 0.702fib.
$1.21 being a wick grab if youre an xrp crackhead buying at 3am.
BUT, if xrp does breakout of the flag pole, buy the C leg on the backtest of the top of the pole.

XRP ($15-$22) (Might Overextend to $27-$33)XRP ($15-$22) (Might Overextend to $27-$33). I am not sure about the next bear market bottom, my numbers have been coming to $4.50-$6.50

XRPIT has rejection from base AOi and looks like it will head up till the base line rejection of xrp

XRP: A Trader's Gambit or an Investor's FortuneXRP at the Crossroads: A Trader's Gambit or an Investor's Fortune?
The digital asset XRP currently finds itself in a fascinating and precarious position, presenting a narrative so divided it could belong to two entirely different assets. For the short-term trader, the charts are painting a picture of tension and potential reversal, a technical puzzle where a wrong move could be costly. For the long-term investor, the horizon holds the promise of a revolutionary technology poised to disrupt a trillion-dollar industry, with price targets that seem almost unimaginable from today's standpoint. This analysis delves into this profound dichotomy, exploring the immediate bearish signals that tempt traders to short, while simultaneously mapping out the ambitious, utility-driven path that could lead XRP to astronomical new heights.
The Short-Term Squeeze: A Technical Tightrope Walk
Observing XRP's recent price action is like watching a high-stakes chess match. The token has demonstrated a textbook reaction to a critical trendline, a move that likely ensnared traders who were too quick to bet on a price collapse. By bouncing precisely where technical theory suggested it might, it "trapped" these early sellers, forcing them to reconsider their positions as the price stabilized and began to creep upward.
Following this maneuver, the price has embarked on a cautious ascent from the $2.20 support zone. As of early July, XRP has managed to climb above the $2.2320 mark and is holding its ground above the 100-hourly Simple Moving Average, both of which are constructive short-term signals. The immediate focus has now shifted to a key resistance level at $2.285. A decisive break above this ceiling could signal that the bulls have taken control, potentially triggering a new wave of buying pressure.
However, a significant hurdle lies in wait. On the hourly chart, a short-term contracting triangle has formed, with its upper boundary creating firm resistance at the $2.280 level. Such patterns are known to be harbingers of volatility; they represent a period of consolidation and coiling energy before the price makes a powerful move in one direction. While a breakout to the upside is possible, the bearish case remains equally compelling.
This bearish outlook is centered on a previously marked supply zone that the price is now approaching. A supply zone is an area on the chart where a glut of sell orders is historically clustered. If the price pushes into this zone without first building a stronger foundation of support by drawing in buying interest (grabbing liquidity) from lower levels, it risks hitting a brick wall. The selling pressure could overwhelm the buying momentum, leading to a swift and strong rejection. For traders anticipating this outcome, it presents a prime opportunity to initiate a short position, betting on a significant price decline. The level of $2.28 is therefore not just a resistance point; it's a critical battleground that will likely dictate the next major directional move.
The Long-Term Vision: The $35 Moonshot Fueled by Global Remittances
To truly understand the fervent belief held by long-term XRP holders, one must look beyond the flickering candles of the hourly charts and focus on the asset's fundamental purpose. The most powerful bullish argument for XRP is not based on technical patterns, but on its potential to fundamentally reshape the global remittance market.
The remittance industry—the process of individuals sending money across borders to their families—is a colossal and ever-growing sector of the global economy. Projections indicate that this market will swell from nearly $800 billion to over $1.06 trillion by 2029. For decades, this system has been notoriously inefficient, characterized by exorbitant fees that eat into the funds sent home and settlement times that can stretch for days, leaving families waiting for critical support.
This is the problem that Ripple, the technology company behind XRP, was designed to solve. By utilizing XRP as a neutral bridge asset, Ripple's payment network can facilitate cross-border transactions in a matter of seconds, not days. The cost of these transactions is a tiny fraction of what traditional banking intermediaries charge. This value proposition of speed and savings is not merely theoretical; Ripple has been actively forging partnerships to implement this technology in key remittance corridors, including those connecting to Mexico, the Philippines, Brazil, and nations in the Middle East.
The audacious price prediction of $35 per XRP stems from a model that quantifies this potential. The logic unfolds as follows: if XRP were to successfully capture a significant portion, say 25%, of the projected $1.06 trillion remittance market by 2029, the network's intrinsic value would be immense. Applying a valuation multiple similar to those of established payment processing giants, the network could be valued at over $500 billion. With a circulating supply of approximately 60 billion tokens, a simple calculation yields a fundamental value of around $8.90 per XRP.
However, the cryptocurrency market is driven by more than just underlying utility; it is heavily influenced by demand, speculation, and investor sentiment. The model accounts for this by applying a "demand premium." If widespread adoption and recognition of XRP's role create a surge in demand, this could act as a multiplier on its fundamental value. A 4x demand premium, a figure not uncommon during crypto bull markets, applied to the $8.90 base valuation, is what brings the target to an eye-watering $35.56. This forecast, while undeniably ambitious, is anchored in the tangible prospect of solving a multi-trillion-dollar real-world problem.
Bridging the Gap: Catalysts for a New Era
The journey from a price of around $2.22 to a potential $35 is long, and its success hinges on several critical factors. A major cloud that long hung over XRP was its legal battle in the United States, which created uncertainty and stifled institutional adoption. However, significant legal victories have provided much-needed regulatory clarity, affirming that XRP itself is not inherently a security. This has been a pivotal de-risking event, opening the doors for financial institutions to begin integrating and utilizing the asset with newfound confidence.
The next major potential catalyst on the horizon is the approval of a spot XRP Exchange-Traded Fund (ETF). Following the successful launch of ETFs for other major cryptocurrencies, many in the industry see an XRP ETF as a logical next step. Such a product would be a game-changer, providing a regulated and easily accessible bridge for a vast pool of capital from traditional finance to flow into the XRP market. It would allow pension funds, asset managers, and retail investors to gain exposure to XRP through their standard brokerage accounts, potentially triggering a massive wave of demand.
Of course, the path is not without its challenges. XRP operates in a competitive environment, with other blockchain projects and even modernizing traditional systems like SWIFT vying for a piece of the cross-border payments pie. Continued innovation, network growth, and the expansion of strategic partnerships will be paramount to securing its market position.
Conclusion: A Dichotomy of Destiny
In its current state, XRP embodies the dual nature of the cryptocurrency market. It is at once a playground for nimble traders, who see the immediate risks and rewards in its tight price consolidation, and a beacon for long-term visionaries, who see the blueprint for a future global financial standard. The bearish case for a short-term rejection from the $2.28 supply zone is technically sound and warrants caution. A failure to break through this level could easily send the price back down to retest lower supports.
Simultaneously, the long-term bullish thesis is one of the most compelling in the entire digital asset space. It is not built on hype alone, but on a clear and demonstrable utility aimed at a vast and inefficient market. The prospect of a $35 XRP is a testament to this potential.
Ultimately, the decision of whether to view XRP as a short-term trade or a long-term investment is a reflection of one's own timeline, risk tolerance, and belief in its underlying technology. XRP is at a critical inflection point, and whether it succumbs to short-term pressures or breaks free to pursue its grander ambitions will be a defining story in the continuing evolution of finance.

XRP / USD - SHORT TERM TREND UPDATEXRP is coiled in a large symmetrical triangle across all major timeframes (4H, 1D, 1W), with momentum building. The key level to watch is a breakout above $2.50 with strong volume, which could push price toward $3.20–$3.40. On the downside, if $2.00 breaks with conviction, expect a retest of the $1.80–$1.60 range. MACD and RSI on both the daily and 4H show bullish setups, and volume is low — suggesting a breakout is near. The move is likely to happen within the next few days to two weeks as price nears the triangle apex.

XRP: Ripple Ready to Unleash a Tsunami?Ripple (XRP) is coiling like a spring—ready to explode. After five clean re-tests of a powerful demand zone, buyers have repeatedly stepped in to defend key levels, launching 40–75% swings each time. Is this the moment it unleashes the wave?
🔍 Technical Breakdown:
✅ Demand Zone Strength
XRP is bouncing from a long-tested demand zone (5+ re-tests). Each bounce led to substantial upside momentum.
✅ Bull Flag Retest
XRP previously broke out of a large bull flag and has been holding the flag’s top trendline for over 40 days—acting as strong support.
✅ Higher Low Structure
Price formed a higher low (H/L) and has climbed steadily for two weeks—building bullish structure.
✅ Volume Profile
Price reclaimed ground above the high-volume node, signaling accumulation strength.
✅ Market Cipher B Divergence
A weekly hidden bullish divergence is present—not massive, but notable—hinting at momentum shift.
⚠️ What to Watch:
Volume is key: Current consolidation shows a decline in volume—a surge could ignite the breakout.
Confirmation for conservative traders: Wait for a break and hold above $2.33 with volume, or a retest of that level.
If past demand zone reactions repeat, a breakout could be imminent.
What do you think?
📈 As always—this is not financial advice. Do your own research.
🧭 Happy Hunting!

XRP: $10 Breakout? Watch These Algorithmic Windows!This XRP analysis highlights "algorithmic departure windows" (blue circles) where explosive price moves can occur.
Whenever price enters a blue circle, XRP can launch to $10 or higher instantly or within 33 days—no matter the news.
**Key Dates to Watch:
**Possible Departure: July 10, 2025 (fundamentals align)
**Other Windows: May 19 - August 11, 2025; October 22 – November 18, 2025
**Major Target Zone: $8.50–$11.50 (December 25, 2025 – January 26, 2026)
History shows that once price breaks out from these departure windows, XRP can reach its upper targets rapidly—sometimes in a single day, but almost always within 33 days or less.
News is the excuse for the moves—algorithms deliver the predetermined price.

XRP - First ConfirmationPlease refer to our previous post:
After pointing out the gravestone doji in the last post that was likely to send price downwards, we also listed the way this major bearish signal could be reversed. We stated "The only way this can be negated in the short term is if we print a green daily candle tomorrow negating the confirmation of the gravestone doji."
That is exactly what we saw. We printed a green daily candle the next day that negated the bearishness of that gravestone doji. Now we are seeing the early signs of a massive XRP breakout.
Now we want to watch for the second confirmation to confirm the breakout. This could come in two forms. Either price drops back down to the orange trendline and confirm that level of old resistance as new support or price continues its rally to the upside and breaks our previous LTF high around $2.65.

Wait for XRPXRP has been consolidating above the $2 level for nearly seven months.
The current resistance is defined by a descending trendline that originates from mid-January 2025.
A breakout above this trendline would signal renewed bullish momentum—and could present a strong entry opportunity.
Disclaimer:
This analysis is based on my personnal views and is not a financial advice. Risk is under your control.

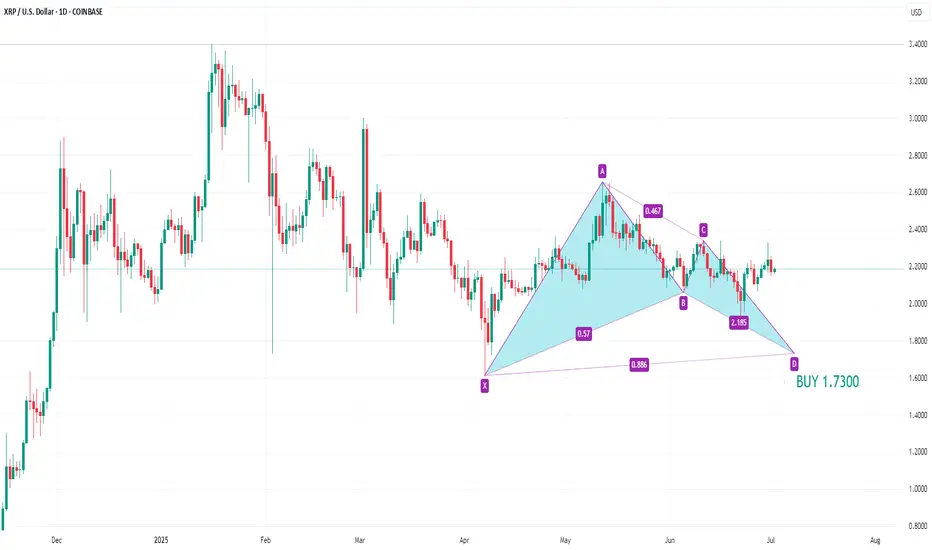
XRPUSD BUY 1.7300Recently, XRPUSD has been fluctuating and the trend is not obvious. Currently, we can pay attention to the support near 1.7300, which is the buying position of the potential bullish bat pattern.
XRP consolidation close to done, 10$ next- update on this analysis, made more than half a year ago:
- since then Ripple has been consolidating at a high level
- history doesn´t repeat but it does rhyme is the famous saying - in case of XRP it looks like price action is literally repeating the 2017 playbook with an initial impulse - consolidation - followed by another impulse
- target of the macro triangle pattern is north of 10$ per XRP, likely to get reached by the end of the year

XRP/USDT Monthly Chart: History Repeating Itself?Hey traders! Let’s dive into this monthly XRP/USDT chart. I’ll be honest — I’m skeptical about this outcome, but let’s break it down because it could actually happen!
The chart screams déjà vu, with XRP’s price action mirroring the 2014-2018 period. Back then, XRP broke out from its 2014 ATH in 2017, leading to a massive rally. Fast forward to now, and we’re seeing a similar setup, but with a twist. XRP is struggling to break through the 2018 ATH resistance zone around $3.31, which reminds me of the Breakout Consolidation phase we saw in 2017. Historically, this consolidation led to a breakout, and the chart hints at a potential repeat!
If XRP breaks out soon, we could see a parabolic move, potentially targeting much higher levels. However, the current resistance is a tough hurdle, and if it fails, we might see a pullback to lower supports.
Key Levels to Watch:
Resistance: $3.31 (2018 ATH)
Support: $1.643 (previous consolidation low)
Breakout Target: To be determined (potentially parabolic)
Breakdown Risk: $0.650
I’m not fully convinced, but the setup is intriguing — could this be XRP’s moment to shine? What do you think? Let’s discuss below!


XRP is about to break out again, on its way to our $10 target.XRP is finally breaking out of consolidation — momentum is building towards our first major target at $10!
🎯 Target 1: $10
🎯 Target 2: $15–$20
Let’s go! 🚀 Good luck, everyone!

"XRP/USD: Bullish Raid Alert! Ride or Escape Fast!"🚨 XRP/USD HEIST ALERT: Bullish Loot Grab Before the Escape! (Thief Trading Style) 🚨
🌟 Greetings, Market Pirates & Profit Raiders! 🌟
(Hola! Oi! Bonjour! Hallo! Marhaba!)
🔥 Thief Trading Strategy Activated! 🔥
Based on ruthless technical + fundamental analysis, here’s how we SWIPE THE LOOT from XRP/USD (Ripple vs. Dollar). Follow the chart’s Long Entry blueprint—our target is the high-risk YELLOW ATR ZONE (overbought, consolidation, potential reversal). Beware of traps! Bears and cops lurk here, but we strike smart.
🏴☠️ ENTRY:
"Vault’s cracked—bullish loot is FREE GAME!"
Buy Limit Orders preferred (15-30 min timeframe near swing lows/highs).
Aggressive? Swipe instantly—just mind the cops (liquidity traps).
🛑 STOP LOSS (Save Your Loot!):
Swing Thieves: 4H recent wick low ($2.1500).
Risk Tactics: Adjust SL based on your trade size, orders, and guts.
🎯 TARGETS:
Main Take: $2.5400 (or escape earlier if momentum fades).
Scalpers: Longs ONLY! Trail your SL—no greedy holds!
💣 KEY DRIVERS (Why This Heist Works):
Bullish momentum brewing (check fundamentals, COT, on-chain data 👉go ahead to klick 🔗).
NEWS ALERT: Avoid fresh trades during high-impact news—protect open positions with trailing stops!
💥 BOOST THIS HEIST!
Hit 👍 LIKE, 🔔 FOLLOW, and 💬 COMMENT to fuel our next robbery plan. Together, we steal the market’s cash—EVERY. SINGLE. DAY.
📢 Final Warning: Markets shift FAST. Stay sharp, adapt, and CASH OUT BEFORE THE COPS ARRIVE.
🤑 Stay tuned—more heists incoming! 🐱👤🚀


XRP SKYROCKETS AND BREAKSOUT PRICE RANGE! ⭐️In a pretty crazy twist and turn of events we're seeing XRP absolutely skyrocket and breakout with this morning's announcement on behalf of President Donald Trump with his Truth Social media platform announcing it had filed for a Crypto Blue Chip ETF with the SEC.
⭐️ The Blue Chip ETF proposal includes 70% holdings in Bitcoin, 15% in Ethereum, 8% in Solana alongside 5% in XRP and 2% in CRO which is from Crypto.com. This notably has led to the breakout with XRP that we're currently seeing with the crypto already up 12% since the day started and news broke out. It's still early morning too so we'll see how the market reacts as the day continues and traders wake up to the news.
⭐️The past few weeks have seen XRP stuck within this horizontal channel and constant tug a war between $1.90-$2.30 with this breakout and the last week signaling bullish optimism towards the crypto alongside news of the BNY-Mellon deal with BNY Mellon set to become the Custodian for Ripple's RLUSD Stable coin. And for those that don't know BNY-Mellon is America's oldest bank having been founded in 1784 and with an estimated $45.7 trillion in assets under custody and/or administration. To say in the least this is a big step for Ripple showing more institutional growth.
⭐️To note also is this as I'll show below on Bitcoin's chart:
⭐️ It's crazy to say but we've just seen Bitcoin form a new All-Time High at $118,100 alongside the Crypto Blue Chip announcement, more than likely with investors and institutions flocking to buy in before the ETF get's approved and likely in anticipation of a bullish shift.
⭐️ We've already seen the crypto space weather the storm through the last few weeks and months with everything that's happened from global escalations to all the new bills and changes in the government. Through thick and thin the crypto space has proved resilient and investors are taking note.
⭐️ Have to run for work but wanted to get a quick idea out there, especially since this news just broke out. Some pretty crazy stuff and I'll be watching these levels here to see if things continue or if the news has simply given us a breakout, regardless it's a win-win with all this news only pushing the directive and story towards crypto and digital assets for many. I'll attach a link below to an article on the Blue-Chip ETF for reference as well.
⭐️ Thanks so much as always and all the best till then, feel free to keep posted for more updates and ideas as we continue on this journey we've been riding the last few years already. It's been a lot but it's got much more to go. Let's keep at it and keep our heads up.
⭐️ Reference on Crypto Blue Chip ETF:
apnews.com
Best regards,
~ Rock'

XRP: Break Above $2.338 Opens Path to $2.480FenzoFx—Ripple (XRP) eased near weekly highs of $2.338, with Stochastic and RSI 14 signaling overbought conditions. The trend stays bullish above the anchored VWAP or $2.165, but consolidation toward $2.2240 is expected before resuming.
A break above $2.338 would target the next supply zone at $2.480.
