XRP Army - prepare for a 72% crash to 0.6 USD! (lifetime chance)The current price of XRP is 2.19 USD, and I predict a big crash in 2025/2026 to 0.6 USD. Yes, I know you may think that that's completely impossible, especially if you are high on your XRP holdings, but I can assure you that this is going to happen! What can you do?
If you are a hodler, then you need to prepare for your portfolio to drop by 72%. Can you really handle this situation? If not, you need to take some action.
If you are a trader and you still speculate on the price increase, you can consider exiting your position. If you bought before the huge pump, take your profit now.
If you are a trader and you bought after the pump, that means at the TOP, you basically FOMOed-IN. It's time to take a small loss or exit your position at break-even. If you found yourself in one of the situations above, you have some work to do. And you need to do the work as soon as possible, before XRP starts crashing, which can be any day now. Otherwise, I strongly recommend entering a short position on futures on a strong resistance if you want to make money on XRP.
Now, importantly, why do I think XRP will crash? Technically, XRP is in a big range and has been in a range since 2017. Nothing changed at all after the pump; the price is still inside this ascending triangle. After the huge pump, the price created a big FVG (Fair Value GAP), and historically this has been a big issue for XRP because we went down each time and wiped out the GAPs. Don't forget that XRP is something like a bitch coin, it's doing weird moves, and it's always ranging and taking liquidity from traders, like a casino. Smart traders can take advantage of it and trade it, but you need to have a strategy. Right now it's obvious that XRP is going to go down in the next months!
Write a comment with your altcoin + hit the like button, and I will make an analysis for you in response. Trading is not hard if you have a good coach! This is not a trade setup, as there is no stop-loss or profit target. I share my trades privately. Thank you, and I wish you successful trades!
XRPUSDT trade ideas

Breakout loading on $XRPBreakout loading on CRYPTOCAP:XRP 🚀
Accumulating heavily here as the price coils inside a massive triangle.
Q3 could be explosive, chart points to a breakout toward $4.60
Retweet if you're BULLISH !!

When Holding is Suicide, Hope Is a KillerStill holding… just waiting for it to come back?
You’re not alone. Most traders enter with confidence and exit with fear. But in some situations, holding isn’t strategy — it’s just slow motion account suicide.
If you’ve ever lost sleep after refusing to close a position, this one’s for you.
Hello✌
Spend 3 minutes ⏰ reading this educational material.
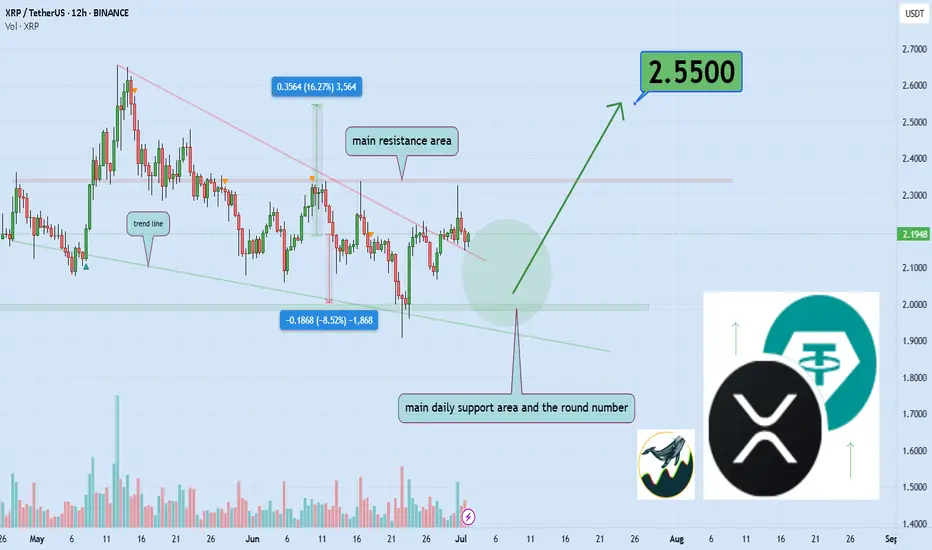
🎯 Analytical Insight on XRP:
XRP is approaching a major daily support zone, aligned with the psychological level of $2.00. This area has historically provided strong buying interest. A potential rebound from this level could lead to a minimum upside of 16%, with a medium-term target around $2.55. 📈
Now , let's dive into the educational section,
🚩 Still Holding? It’s Probably Not About the Chart Anymore
The biggest lie traders tell themselves:
“It’ll bounce back… just give it time.”
But in reality:
Holding a loser drains your mental capital more than your actual balance
The longer you wait without data, the more emotional your decisions get
The market doesn't care about your entry, your hope, or your patience
As they say in trading:
Hope is not a strategy.
And often, it’s the fastest way to wreck your capital quietly.
📊 TradingView Tools to Know When Holding Is Dangerous
Sometimes, charts whisper before they scream. These 4 tools on TradingView help you see when "holding on" is no longer a smart move but a trap. Let’s break them down and make them practical:
1. Volume Profile
This shows you exactly where most buying and selling occurred. If price drops below the highest volume zone, it means conviction is gone.
How to use it:
Right click the chart → Add Indicator → Select "Volume Profile Fixed Range" → Drag across the last trend leg.
2. RSI Divergence
Still holding while RSI shows bearish divergence? That’s a red flag. It signals trend exhaustion.
How to check:
Apply RSI 14. If price makes a higher high but RSI makes a lower high, you're likely holding into weakness.
3. Smart Money Concepts (SMC)
Look for Liquidity Grabs, Breaker Blocks, or Order Blocks. These reveal where big players exit often while you're still hoping.
How to find it:
Go to Indicators → Search “Smart Money Concepts” → Pick a high rated free version.
4. Session Volume / Ranges
If you’re stuck holding during sideways chop, your money is freezing.
How to identify it:
Add Session Volume or Range indicators. If you see price compressing without expansion, it’s not worth staying in.
🪤 5 Situations Where Holding Is Silent Suicide
The market is ranging with no true breakout in sight
Indicators are flashing weakness but you're still “waiting”
You’re only holding because exiting would feel like admitting failure
You missed the exit and now you’re emotionally attached
You fell in love with the fundamentals of a coin and lost objectivity
🧲 Greed vs Hope — Know the Difference
Greed wants more.
Hope just doesn’t want to lose.
Both will blind you from the truth on your chart.
📉 Real World Case: Holding Through a Pumped Altcoin
Last week, thousands held on to a hyped altcoin.
But here’s what the chart said:
RSI was overbought for 3 days straight
Momentum was fading on every push
Smart money exited and left retail praying
Result?
A 48 percent drop in 5 days.
The ones who held are still "hoping" today.
🧘 The Golden Rule of Holding
Before you decide to hold a losing position, ask yourself:
Is this based on actual chart structure or just denial?
Am I trying to avoid the pain of realizing a loss?
If I had no position, would I open this trade right now?
If the answer is no, it’s probably time to get out.
🧭 Final Take
Sometimes holding is wisdom.
Other times, it’s just avoidance wrapped in hope.
Use real data. Use real tools. Make real decisions.
And if it’s time to close that trade, do it before it drags you down deeper.
✨ Need a little love!
We put so much love and time into bringing you useful content & your support truly keeps us going. don’t be shy—drop a comment below. We’d love to hear from you! 💛
Big thanks , Mad Whale 🐋
📜Please remember to do your own research before making any investment decisions. Also, don’t forget to check the disclaimer at the bottom of each post for more details.
$XRP Breakout Loading: 20% Rally on the Horizon?CRYPTOCAP:XRP is showing strength after bouncing from a key support zone.
Price is pushing toward the descending trendline, and a breakout above it could trigger a 20% move toward $2.5376.
MACD is showing early bullish signs. Breakout watch is on!
DYRO, NFA

XRP is preparing to break through supportXRPUSDT is not yet ready for growth.
The important support level is 2.081. The price cannot stray far from it and has been attacking it for several hours amid a locally weak market.
Scenario: Consolidation with price compression towards 2.081. (descending triangle)
A breakout of support could lead to a decline.
Two targets: 2.032, 1.984

XRP Support Holds After Being Tested 12 Times...Everything below $2 is quickly bought. No crash is good news. Not having bearish action and bearish follow up on sellers pressure is bullish. XRP is bullish and has been consolidating for months. The longer XRP trades above $2, the stronger will be the bullish wave that follows. We are getting very close.
Good evening (morning) my fellow Cryptocurrency trader, I hope you are having a nice day.
The same level has been tested over and over and over since December 2024 and it continues to hold. XRP managed to wick below $2 more than twelve times, this support continues to hold. When prices move lower, buyers quickly show up.
Look at this, before 7-April XRP was moving below $2 very often. After 7-April, only twice. Big difference. This reveals a bullish bias. When the market was bearish, this support was tested more often than not. As soon as XRP turned bullish, it was tested only once recently and once after the 7-April bottom.
This little dynamic here shows that the bulls have the upper-hand and this is all we need to know. Knowing that the bulls have the advantage, when the market breaks it is going to break up. A bullish continuation. It is confirmed and it is only a matter of time.
How long? Only the market knows but it is not far away. The longer it takes, the stronger the bullish wave that follows. Strong growth is likely to develop within days.
Namaste.

Pair: XRP/USDTSession: NY Open
Framework: Smart Money Concepts x Goldbach Precision
Swept the Asia Low — textbook liquidity grab.
Price retraced perfectly into a Goldbach Fair Value Gap (FVG) following the sweep, aligning beautifully with Smart Money logic.
This setup confirms internal liquidity was cleared and we're now respecting a high-probability demand zone.
The confluence of the Goldbach FVG + accumulation range + OB is giving this long position serious weight.
Holding the 2.0767 entry, with stop loss tight below the sweep at 2.0669, targeting the high-efficiency zone above at 2.19.
12:1 RR still in play. Now we wait for structure to shift and price to deliver.
Stay sharp — premium is ahead.

XRP - Trade SetupLocal Price Action:
We are in the area of the major trend reversal zone. Since the price has left the zone by more than its own size, the zone has been reactivated and is tradable again according to the System.
Macro Price
The 0.5 level of the major trend reversal zone overlaps with the bearish target areas on the hourly chart. If we reach this level, I will open another long position in $XRP."

HolderStat┆XRPUSD held the supportBINANCE:XRPUSDT on the 16h chart is showing strength above $2.05 after breaking out from consolidation. The path is clear toward $2.30 and $2.60 as buyers regain control. The bullish pattern sequence continues to develop.

It reaches a maximum of $2.5 and then decreases to $1.5The price is rising in the lower timeframe. But it can eventually go up to $2.5 and then it will fall to the $1.5 range, which is -40%.
Please do not invest long-term in the downtrend
If you like, follow me to get better signals.

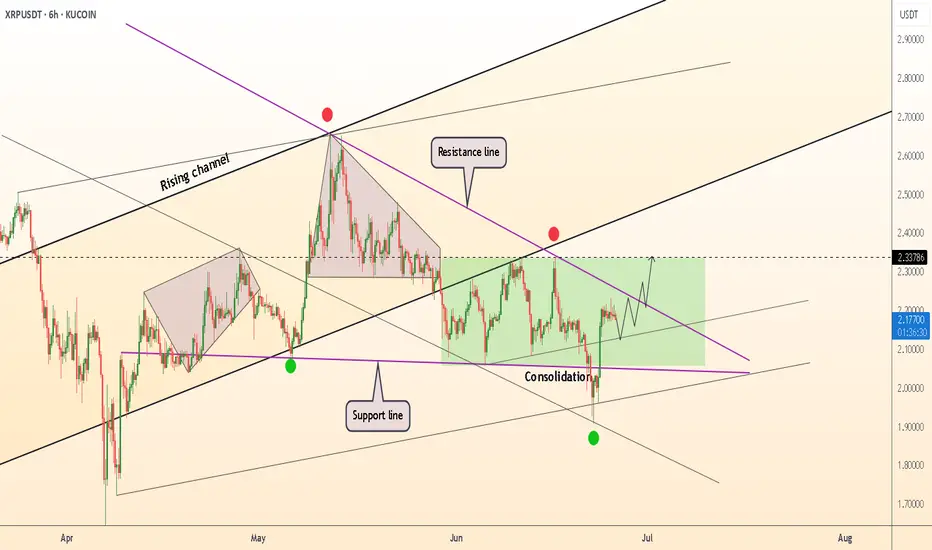
XRP Update ATH - T1 - 10% move Long | Potentially 100% mid JulyXRP is moving in the bullish channel. I believe we need 2 more touches:
1. Resistance Line
2. Support Line
Expectations 7-14 Days and the

DeGRAM | XRPUSD seeks to retest of the resistance line📊 Technical Analysis
● A third rebound from the rising purple support (green dots) printed a bullish engulfing that has already forced price back above the short-term grey down-trend, signalling a momentum shift.
● XRP is now coiling inside a contracting triangle capped by the purple resistance line near 2.40; the 18 ¢ consolidation width implies 2.45 on a break, while the April pivot at 2.65 lines up with the upper channel for the next objective.
💡 Fundamental Analysis
● Ahead of the 23 July SEC – Ripple status hearing, HSBC’s digital-asset unit announced a pilot using XRP for cross-border settlement, lifting social volume and spot bids.
✨ Summary
Buy 2.10-2.20; confirmed close above 2.40/2.45 targets 2.60-2.65. Thesis void on a 16 h close below 1.98.
-------------------
Share your opinion in the comments and support the idea with a like. Thanks for your support!

Lingrid | XRPUSDT sideways MOVEMENT ContinuesBINANCE:XRPUSDT is consolidating within a defined horizontal channel, currently sitting just above the 2.06 support after multiple fake breaks and failed attempts at a higher high. A bullish rebound from this zone could launch price back toward the descending resistance trendline. The 2.2240 level marks a key reaction point that may cap any breakout attempt short-term.
📈 Key Levels
Buy zone: 2.05–2.10
Sell trigger: breakdown below 2.05
Target: 2.22
Buy trigger: confirmation bounce above 2.10
💡 Risks
Sideways consolidation may extend, delaying breakout
Strong rejection near 2.22 trendline could trigger reversal
Break below 1.9730 confirms bearish continuation
Traders, if you liked this idea or if you have your own opinion about it, write in the comments. I will be glad 👩💻

XRP/USDT Bullish Breakout Anticipation XRP/USDT Bullish Breakout Anticipation 🚀
Technical Analysis:
The chart illustrates a potential bullish setup for XRP/USDT based on price structure, support/resistance levels, and harmonic movements.
🔍 Key Observations:
Rejection From Major Support Zone (1.95 - 2.00):
Price previously tested a strong demand zone (marked as “SUPPORT”) and showed significant rejection with bullish candlestick momentum.
Series of Higher Lows ✅:
The price structure shows consecutive higher lows (green arrows), indicating rising buying pressure and bullish intent.
Break of Intermediate Resistance (2.15 - 2.18):
A breakout from the neckline area confirms bullish continuation. Price is currently retesting this level, turning resistance into support.
Target Zone at 2.35 - 2.36 🟦:
A clean target area marked by historical resistance and previous high (red arrow).
Projection indicates a possible move toward 2.3512 USDT, aligning with the measured move from the breakout structure.
Bullish Harmonic Pattern Completion 🔼:
The chart also displays a harmonic pattern completion near the recent low, suggesting a reversal point aligning with market reaction.
🎯 Trading Plan:
Entry Zone: Current retest around 2.15 - 2.18 is favorable.
Target: 2.3512 (as per projection and prior resistance zone).
Invalidation: Break below 2.10 and especially under the key support (2.00) would invalidate the setup.
📌 XRP/USDT is showing bullish strength as long as it holds above the breakout level. A sustained move could trigger momentum towards the 2.35 target zone. 💪📊

XRP/USDT Poised for Breakout from Symmetrical Triangle!Pattern Identified: Symmetrical Triangle
The symmetrical triangle is a consolidation pattern formed by a series of lower highs and higher lows, converging into a triangle shape. It reflects market indecision and often precedes a significant breakout, either upward or downward, depending on momentum and volume.
🔍 Pattern Description:
Upper Resistance Line (Descending): Connecting the lower highs since February 2025.
Lower Support Line (Ascending): Connecting the higher lows since December 2024.
Consolidation Zone: Price has been moving sideways within the triangle, indicating accumulation.
Critical Breakout Level: Around $2.23 — the price is currently testing this resistance.
📈 Bullish Scenario:
If the price successfully breaks above the upper triangle resistance with strong volume:
Target 1: $2.5855 (previous minor resistance)
Target 2: $2.9534 (key historical resistance)
Target 3: $3.2781
Maximum Target: $3.40 (local previous high and psychological level)
Breakout Confirmation: A daily candle close above $2.30 with significant volume could signal a long entry.
📉 Bearish Scenario:
If the price fails to break out and instead breaks down below the lower trendline:
Support 1: $2.00 (psychological & horizontal support)
Support 2: $1.85
Major Support: $1.55 (strong historical demand zone)
Breakdown Confirmation: A daily close below the lower triangle boundary with high volume would signal further downside.
📌 Summary:
XRP is nearing the apex of a symmetrical triangle — a major move is imminent.
A confirmed breakout could trigger a rally towards $3.40.
A breakdown may lead to a drop toward $1.55.
Recommendation: Wait for confirmation before entering long or short positions.
#XRP #XRPUSDT #CryptoBreakout #SymmetricalTriangle #XRPAnalysis #Altcoins #TradingView #TechnicalAnalysis #BullishCrypto #CryptoSignal

$XRP ALERTCRYPTOCAP:XRP price is pushing toward breakout resistance!
Don't FOMO in yet — confirmation comes above the red zone!
Break and hold above signals bullish continuation
Rejection could lead to a pullback to the demand zone!
Resistance zone: $2.35- $2.63
Support zone: $1.92 - $2.07
Patience brings profits!

DeGRAM | XRPUSD in the consolidation zone📊 Technical Analysis
● A liquidity sweep to $2.00 closed back inside the six-week green range, printing a hammer on the rising-channel base—confirming the dip as a spring rather than a breakdown.
● Price is compressing against the purple April trend-cap; each pull-back now holds a higher low, and a box-range measured move projects a pop toward the dotted pivot at $2.34 and the channel median near $2.60 once $2.24 gives way.
💡 Fundamental Analysis
● Derivatives funding has flipped positive and cumulative OI on major venues is up ~10 % since 23 Jun, signalling fresh long positioning ahead of July’s SEC–Ripple status hearing.
✨ Summary
Buy $2.10-2.18; breakout above $2.24 targets $2.34 → $2.60. Bias void on a 6 h close below $1.98.
-------------------
Share your opinion in the comments and support the idea with a like. Thanks for your support!
$XRP Keep an eye on the marked support zone... If price revisitCRYPTOCAP:XRP Keep an eye on the marked support zone...
If price revisits this range, it could offer a solid entry opportunity before the next major breakout toward the $3–$5 region.

An in-depth explanation of the XRP setupHi traders,
The thesis is explained in detail in this video!
CRYPTO:XRPUSD BINANCE:XRPBTC

Weekly trading plan for XRPLast week's BINANCE:XRPUSDT price action followed our projected path but ultimately failed to reach the first target. The price now appears to be consolidating in a triangular pattern, so I've outlined two detailed scenarios. While further downside remains the primary expectation, a sharp breakout above the local high would delay the anticipated correction
Write a comment with your coins & hit the like button and I will make an analysis for you
The author's opinion may differ from yours,
Consider your risks.
Wish you successful trades ! mura

XRP's situation+ Target PredictionThe XRP is in a Bullish phase by a Falling Wedge Pattern.
A falling wedge indicates the potential for price to reach to $3.
Note if the PRZ ZONE is broken downwards with the strength of Bearish candles , this analysis of ours will be failed.
Best regards CobraVanguard.💚

XRPUSDTHi snipers. The price of XRP has reached the channel ceiling on the one-day time frame and has also broken the black line, which is the 103-day moving average. The RSI is also in the neutral zone. As the price crosses the channel ceiling, expect significant price growth along with positive news. This is not a trading offer. I am learning and practicing. Good luck.

XRPUSDT 1D#XRP has formed a bullish pennant on the daily chart — keep an eye on it.
In case of a breakout above the pattern resistance and the daily MA50, the targets are:
🎯 $2.5067
🎯 $2.7175
🎯 $3.0177
🎯 $3.4000
⚠️ Always use a tight stop-loss to manage risk and protect your capital.
