XRP Looking Better But... Mixed. Comment, Support Me!XRP is looking much better now. It closed four days green after a higher low but something is off.
I mean, it is good you can see the chart the rising channel but I am sensing some weakness. There is zero volume.
Normally, when the retrace ends and produces a higher low there is always at least a small spike in volume. But, it can happen that there is no volume because it is early and there will be long-term growth and so volume only shows up when resistance is being removed.
Since doubt can creep upon us we focus on the price and the chart.
Higher low the bears showed no strength with several days green we can see prices continue to increase. Let's keep it easy.
Set at stop below $2.07 and go all-in. Do what you think is right already LONG on XRPUSDT since 30-May. We have to wait and see for the market to produce the results.
I mean, what is your take?
You are an expert too give me something, give me something in the comments because it is not an easy chart but it is clearly pointing higher. The problem is that sometimes the chart signals are fake.
Leave a comment with your view.
Thank you for reading.
Namaste.
XRPUSDT trade ideas

XRP is preparing for breakout !XRP / USDT
Xrp is forming small flag pattern above previous big accumulation zone
Looks like a breakout could happen soon
Keep an eye on this chart and trade / follow accordingly
Best of wishes
Ripple Analysis - What Shall we Expect !!!If the price can break through this channel's resistance, I expect it to reach $2.5 in a short time.
Stay Awesome , CobraVanguard

Crypto Patience or Crypto Poison? Escape the Trap of HopeIs sitting on a losing position without a plan still called patience—or just chronic self-deception? How many times have we told ourselves, “Just one more pump, and it’ll come back,” only to watch our capital get sliced in half?
Hello✌
Spend 3 minutes ⏰ reading this educational material.
🎯 Analytical Insight on XRP:
XRP is currently testing a key daily support zone, aligning with a descending trendline — a high-probability confluence area 📉. If this level holds, a potential upside move of around 17% could follow, with a primary target set near 2.65. Risk management remains essential as price action unfolds 🚀.
This analysis dives into one of the harshest truths in the market: when patience stops being a strength and becomes your biggest weakness.
🧩 The Victim Mindset: Why Do We Hold?
Most traders hold losing positions not because of logic—but because of fear. Fear of being wrong. Fear of realizing the loss. So the mind creates false hope to avoid pain. Every extra minute you “wait,” without a proper update to your thesis, you're letting the market control you—not the other way around.
📊 Smart Usage of TradingView Tools
TradingView isn’t just for drawing lines—it gives you smart tools that help prevent emotional traps. Let’s explore a few that can reshape your trading mindset:
Risk/Reward Ratio Tool: If you haven’t defined your loss tolerance from the start, patience becomes meaningless. This tool visually shows you whether your hold is strategic—or just emotional.
Fixed Range Volume Profile: Traders often get stuck in zones of high trading volume. This tool shows where the market traps liquidity and traders alike.
Alerts: If you don’t set exit alerts beforehand, emotions will make the decision for you. Use alerts to guide your logic—not your fears.
Replay Tool: Go back in time, relive your bad decisions, and study them. This helps build psychological awareness through chart practice—not just technical analysis.
Using these tools consistently turns your trades into structured decisions, rather than emotional guesses. TradingView gives you everything—you just have to use it wisely.
🪤 Patience or Behavioral Trap?
Have you noticed how after long periods of “holding,” your next move tends to make things even worse? That’s called a behavioral trap. After investing time and energy into a trade, you subconsciously want to “recover” that loss. So you increase your risk—or worse—re-enter the same losing coin.
🔍 Mental Positions vs. Market Positions
Most traders think they only have a position on the chart. But there's also a mental position—made of hope, fear, regret, or ego. More often than not, it's the mental position that makes us stay stuck—not the chart itself.
🧠 Spotting Real Patience vs. Emotional Holding
A quick checklist to test your patience:
Did you define your stop-loss and target before entering?
Are you holding because of a technical level—or just fear of realizing a loss?
Did you update your analysis—or are you clinging to outdated hope?
If this trade setup happened again, would you still hold?
💣 When "HODL" Becomes Mental Paralysis
In crypto, “HODL” isn’t always strategy—it can become mental paralysis. You can’t sell, not because of logic, but because of fear. That’s not conviction—that’s a warning sign.
🧱 Didn't Go Risk-Free? Then Patience Is Gambling
Patience only makes sense if your position is at least partially risk-free. If your capital is still fully exposed, your so-called patience is just emotional gambling. The market has no mercy for those without a plan.
🧭 Smart Exits: The Only Productive Patienc e
Sometimes patience means waiting for a better exit—not for a complete recovery. Kill your fantasy scenarios and look at what risk control really means. If your patience isn’t supported by structure, it’s a ticking time bomb.
🔚 Final Thoughts
Patience in crypto is not always a virtue. Without proper tools, structure, and psychological awareness, it becomes destructive. Use TradingView's tools wisely, build discipline, and know when you're waiting with logic—or just with fear.
📜 Please remember to do your own research before making any investment decisions. Also, don’t forget to check the disclaimer at the bottom of each post for more details.
✨ Need a little love!
We put so much love and time into bringing you useful content & your support truly keeps us going. don’t be shy—drop a comment below. We’d love to hear from you! 💛
Big thanks,
Mad Whale 🐋

XRP: 100% Gain in couple of weeks!Get ready for 100% surge in the coming weeks, but before that another low to grab liquidity is essential.
Place your buy order around 2$ mark and enjoy.
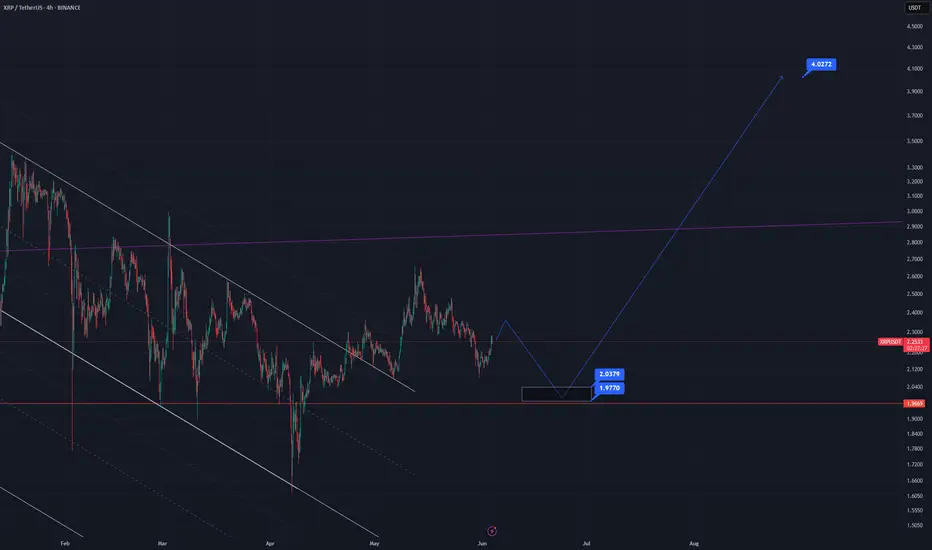
XRP Moves Forward—How To Maximize Profits, Aim At $4.5 Or Higher5-June gave us the confirmation for a higher low.
8-June is telling us the continuation of the bullish move is true. XRP moves forward.
How are you doing my friend in this beautiful Sunday?
I hope you are doing great.
The bottom happened 7-April, the peak happened 12-May.
24 Days for the retrace to be completed, between 12-May and 5-June.
It's been 27 days since we last saw some bullish action, almost an entire month.
I fully understand how people become bored, it is just too long, the market never moves straight up. But this can be taken in different ways. If the market were to move straight up, there is no chance to adapt, to recover, to plan and to learn. Now that the market made a full pause, we are ready for a new wave of growth and this time we can maximize profits on the way up.
How to maximize profits?
Hold strong. Hold long. Wait for higher targets.
Let's revisit the targets and how to approach them.
The "selling for profits" strategy where we sell a portion at each target is for blind traders. This method is used when we are trading with a high level of uncertainty about the next wave top. This method we can ignore here because we know where prices are headed next. To maximize profits with XRPUSDT, ignore $2.71, ignore $3.02, ignore the new ATH and aim straight at $4.51 with your full position with high lev. That's how to maximize profits.
Take some profits at this level only to buy more when the next retrace shows up. We are going higher, so you can keep on holding and wait for $6 or more. While we ignore the lower targets, when prices are higher we do not ignore them anymore. It doesn't matter how far up it goes, but we have to be careful after reaching $4.4.
Aim high because we are going high. The market is preparing for several months of sustained growth. Some of the older projects, mid-size and small size based on market cap., are showing signals of an entire year of bullish action ahead. It is not yet confirmed, but if it happens, this will be the biggest and best bull market in the altcoins history. A very big one.
For example, XRP peaks early because it started early and we get maximum profits from this pair. When the correction starts for XRP, the rest of the market continues growing. We can move capital from this pair to smaller pairs. And there will be thousands of those.
While XRP can grow 50% in a matter of weeks or months, a small pair can grow 150% in a single day. We have to take advantage of the big and the small ones. Diversification.
If you enjoy the content, consider follow.
Thanks for the continued support.
I'll see you at the top.
Namaste.

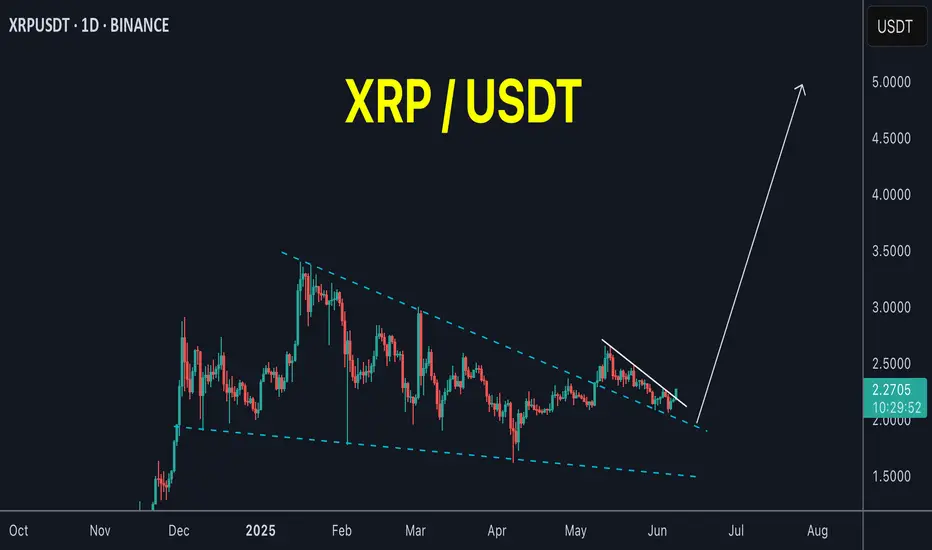
XRP Bullish, The Retrace is Over! Aim HighWhat we need to consider here is the size and duration of each move.
The rise from 7-April through 12-May amounts to 64%.
The retrace from 12-May to present week amounts to 24%.
» So the retrace is more than a third part the size of the advance.
The rise lasted 6 weeks.
The retrace so far has 3 weeks.
» So the retrace is half the length of the rise.
Both these readings are super standard for a bull market. A retrace can easily end this week or early next week followed by 2-3 months of growth. Within this new wave of growth, there will be other retraces but a correction only comes at the end of the main wave. After the correction comes another advance and then a bear market.
Ok. We have a higher low and the chart is pointing up.
After three weeks of bearish action there is no sellers pressure, trading volume is really low.
The bears have no steam, no force, no momentum; the bears are gone.
Knowing this, we can aim high...
The retrace is over!
Thanks a lot for your continued support.
Namaste.

#XRPUSDT: $4 Is One The Way, Get Ready! Comment Your Views! Long term view on #XRP shows an extreme bullish projection, where price hitting $4 price range; there are three targets along the way which can be set according to individual interest and knowledge. We ourselves expect price to grow gradually over time and think long term with the help of fundamentals and economical side price surely can hit $4 target or may went beyond that.
If you like our work please like and comment for more such analysis.
Good luck,
Team Setupsfx_

XRP Repeating 2024 Setup? Monitor the RangeCRYPTOCAP:XRP is once again in a familiar phase — accumulation. After its previous range-bound phase led to a powerful breakout, we’re now seeing a similar structure forming on the weekly chart.
The price is consolidating within a clear range, showing signs of strength but awaiting a breakout to confirm the next move. History suggests this kind of accumulation can often lead to explosive upside — but patience is key here.
📌 Key takeaway: Until a clean breakout occurs, it’s best to observe, not chase. Keep your eyes on the upper range boundary for confirmation.
Let the market come to you.
DYOR, NFA
Thanks for following along — stay tuned for more updates!

This isn’t distribution. It’s preparation.XRP has spent the last sessions consolidating just under a 15M OB — not failing, just gathering energy. Most traders confuse rejection for weakness. Smart Money sees opportunity.
What matters:
We’ve got stacked 15M OBs above 2.2544 and 2.2805 — liquidity zones that will either break or sweep
Price just tapped the local low while holding above volume cluster support
If we reclaim the midrange and hold above 2.2400, the setup for expansion into 2.2805 is in play
Lose 2.2348? Expect a deeper rotation to the 2.1862 demand zone
There’s no need to predict here. Just follow structure. Volume confirms intent, and the reaction around these OBs will dictate the next leg.
Execution:
Reclaim 2.2544 → long toward 2.2805
Clean breakdown? Step aside and re-evaluate near 2.19
Bias is bullish unless 2.2348 gets invalidated with conviction
You don’t need more signals. You need fewer distractions. The chart is already speaking.
More like this? Setup-first, noise-free — check the profile description.

Xrp Buy zone📊 XRP/USDT Chart Breakdown
1️⃣ Price Structure Overview
* The chart spans roughly from November 2024 to June 2025.
* We observe clear market structure changes:
* BOS (Break of Structure) and CHoCH (Change of Character) labels mark shifts between bullish and bearish trends.
* The current price is consolidating around the \$2.17–\$2.18 level.
* Recent local low at \~ \$2.06 (marked as a strong liquidity area).
2️⃣ Key Levels and Zones
* Demand Zones (Support)
* \$2.06 (strong low marked).
* Grey and blue shaded zones from \~ \$2.00–\$2.18 acting as a major support cluster.
* Supply Zones (Resistance)
* \$2.42 (0.382 Fib retracement).
* \~\$2.85 (0.618 Fib) to \$3.19 (recent weak high) – high probability resistance on rally.
* Psychological resistance around \$3.00.
3️⃣ Fibonacci Retracement & Extension
* The Fib tool is applied from the last significant swing high (\~\$3.22)cto the current local swing low (\~\$2.06).
* Fib Key Levels:
* 0.382 → \$2.42
* 0.5 → \$2.64
* 0.618 → \$2.85
* Full extension → \$3.22
* Price currently testing the 0.382–0.5 range, signaling potential bullish continuation if broken.
4️⃣ Liquidity Zones
* The blue shaded region (\~\$2.00–\$2.18) is a major liquidity zone with strong historical reaction.
* Multiple CHoCH points in May-June indicate a possible trend shift to bullish if price holds above \$2.06 and clears \$2.42.
5️⃣ Market Context
* Daily Structure:Range-bound but with an emerging bullish bias after the \$2.06 low held.
* Current Pattern: Accumulation phase after liquidation sweep below \$2.06, possibly gearing for breakout if market conditions stay favorable.
🏆 Correlation with BTC – Recent 7 Weeks of Bullish Momentum
1️⃣ BTC Context
* Bitcoin has been on a sustained 7-week bullish run, breaking key resistance levels and reaching new 2025 highs.
* This has improved overall crypto market sentiment, leading to increasing altcoin interest.
* BTC Dominance is slightly high but showing signs of topping → good for large-cap altcoins like XRP.
2️⃣ Impact on XRP
* XRP is attempting to reclaim major levels and follow BTC’s momentum.
* BTC’s rally is pulling liquidity into the crypto market, benefiting XRP’s chances of a **breakout above \$2.42–\$2.64.
* If BTC consolidates or slightly pulls back without major weakness, XRP could see a strong move towards **\$2.85–\$3.00.
---
3️⃣ Watch For
* BTC holding above recent highs → more confidence for altcoins.
* BTC correcting sharply → XRP may retest **\$2.06** or lower.
* XRP key breakout: **\$2.42–\$2.64** → if broken with volume, targets \$2.85+.
📈 Summary
✅ XRP is currently in **accumulation mode** above a strong demand zone.
✅ Market structure shows **recent CHoCH indicating potential bullish reversal**.
✅ BTC’s 7-week rally has provided a **favorable environment** for XRP to rally if momentum continues.
✅ Critical level to reclaim: **\$2.42**.
✅ Bullish target if broken: **\$2.85–\$3.22**.
✅ Caution: BTC correction could stall XRP at current support.

It wasn’t a breakout. It was a sweep.BINANCE:XRPUSDT.P didn’t rally to trend — it rallied to rebalance. The high at 2.2744 was always a liquidity draw, not a destination. Now that the market has taken what it needed, we trade the reaction — not the impulse.
Here’s how this unfolds:
Price tapped into a clean 1H OB and immediately rejected
Below that, we’ve got confluence between OB + FVG zones around 2.2220 and 2.2070 — that’s the re-entry window
Fibonacci levels reinforce the structure:
• 0.5 at 2.2287
• 0.618 at 2.2180
• 0.786 near 2.0266 — last line before deeper rotation
If price holds above the OB and starts to consolidate into a bullish MSS, I expect a rotation back toward the premium wick at 2.2744 — maybe even higher depending on volume profile buildup.
But if we lose 2.2070 decisively, all eyes go to 2.1697 and then 2.1831 — where the real volume sits.
Execution bias:
Accumulation above 2.2070 → bullish continuation valid
Break and hold below? Reversion into deeper discount zones likely
Targeting the sweep of 2.2528 and eventual test of 2.30+ if structure confirms
The move isn’t over. It’s transitioning. You either read the shift or get caught in it.
More setups built on narrative and price logic? They’re in the profile description. I don’t chase — I position.

XRP/USDT Reversal Play: Bounce from Strong Demand Zone🔍 Chart Analysis:
🟫 Strong Supply Zone: The price has bounced perfectly off a strong demand zone (labeled "strong supply zone" in the chart, but likely intended to be demand), showing buyer interest near the $2.05–$2.12 range.
📉 Recent Downtrend: XRP recently experienced a sharp decline, but the price has now touched this critical zone, suggesting a potential bullish reversal.
🔁 Potential U-Shaped Recovery: A rounded reversal pattern is indicated with the red curve, aiming for a U-shaped recovery targeting higher resistance levels.
📊 EMA 70 (2.2932): Current price is trading below the EMA, which acts as a short-term resistance. A break above it would be bullish confirmation.
📌 1st Resistance: Around $2.2932, which aligns with the EMA. This is the first challenge for bulls.
📌 2nd Resistance: Near $2.40–$2.47, a critical barrier before long-term targets.
🎯 Long-Term Target: Set near $2.63, the peak from the previous rally, aligning with major resistance.
🕯 Volume: Decent volume spike at the bounce, confirming interest from buyers.
🧠 Trade Setup: Reversal from Strong Demand Zone
📍 Entry Zone:
🔹 Enter between $2.12 – $2.15 (ideal after confirming a bounce or bullish candle above the zone)
🛡️ Stop-Loss (SL):
🔻 Place below the demand zone — $2.05
(Protects from deeper downside if support breaks)
🎯 Take Profit (TP) Targets:
TP1 – $2.29 (🟦 1st Resistance / EMA 70)
🔸 Partial profit booking here; break-even SL for the rest
TP2 – $2.40 (🟦 2nd Resistance)
🔸 Major resistance zone; expect a reaction
TP3 – $2.63 (🔴 Long-term Target / Previous High)
🔸 Full target for position holders
📊 Risk/Reward Ratio:
Approximately 1:2.5 to 1:3.5, depending on entry
🔔 Extra Notes:
📈 Watch for bullish engulfing or hammer candle confirmation before entering.
🔄 If price fails to reclaim EMA 70, re-evaluate trade.
🧠 Manage position size properly — avoid over-leverage.
🔮 Summary:
XRP is attempting a bullish reversal from a key demand zone with potential to target $2.47 and even $2.63 long term, provided it clears resistance at $2.29 and $2.40. The setup favors swing traders and position holders looking for a recovery play.
💡 Strategy Tagline:
"Buy the bounce, trail the breakout, ride the reversal!" 🚀📈💹
support my idea and comment down your thoughts thanks .

xrp long idea/classic patternI have been trading this pattern for a long time now, and I am waiting for a 3 top to form, the highest in the 3.55 zone from where a strong decline could occur. We have been preparing for a strong uptrend on the hrp at 40% for quite some time now

XRP tapped the 0.786 retracement and is reacting sharply — Smart📍 Key Entry Zone: 2.2182 (deep liquidity grab just under FVG 15m & BTS 15m zone)
🔁 Context: Liquidity sweep → FVG mitigation → Signs of displacement
Bullish Case 🎯
TP1: 2.2482 (0.5 fib + imbalance refill)
TP2: 2.2750 (0.236 fib — classic reaction zone)
TP3: 2.2989 (local high; likely liquidity target)
Max Target: 2.2819 (Volume Imbalance top POC zone)
Bearish Invalidation ⛔
A candle body close below 2.1975 invalidates the bullish structure (1.0 fib)
STB 15m block becomes absorption, not rejection — sign to reassess
Momentum shifts are born in the shadows of liquidity — and this looks like Smart Money speaking.
Check my profile for more tactical breakdowns and sniper entries.

#XRPUSDT #4h (Bitget Futures) Descending channel near breakoutRipple just printed a dragonfly doji resting 50MA regained support, looks ready for short-term recovery.
⚡️⚡️ #XRP/USDT ⚡️⚡️
Exchanges: Bitget Futures
Signal Type: Regular (Long)
Leverage: Isolated (8.0X)
Amount: 5.2%
Entry Zone:
2.2438 - 2.2088
Take-Profit Targets:
1) 2.3535
2) 2.4493
3) 2.5450
Stop Targets:
1) 2.1199
Published By: @Zblaba
CRYPTOCAP:XRP BITGET:XRPUSDT.P #4h #Ripple #MadeInUsa xrpl.org
Risk/Reward= 1:1.2 | 1:2.1 | 1:3.0
Expected Profit= +45.7% | +80.1% | +114.5%
Possible Loss= -38.2%
Estimated Gaintime= 1-2 weeks

XRP AccumulationI'm looking for a Model 2 on XRP, either from the liquidity, extreme demand, or extreme liquidity.

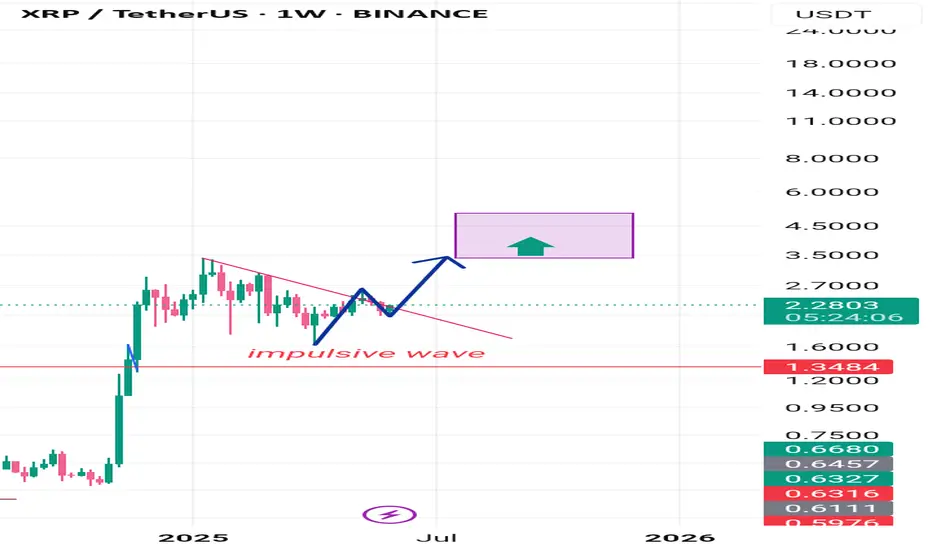
Ripple in impulsive wave, 3.5-5 target is possible personal idea: Ripple grew extensively in past bull run and went cool period, currently as the chart shows, in my opinion Ripple is starting new impulsive wave and in my opinion target of 3.5-5 easily accessible. Good 🙂luck 👍
They waited for confirmation. I bought the retrace.XRP didn’t reverse. It refined.
After reclaiming the rounded base and pushing into a 1H OB, price rotated perfectly into the 0.5 retracement at 2.1419 — tagging the breaker wick, respecting structure, and front-running the deeper 0.618 by a hair.
This isn’t weakness. It’s an engineered dip into fresh demand. Smart Money logic doesn’t require “green candles” — it requires imbalance filled and structure respected. That’s exactly what we have here.
Now, price is boxed between two intentions:
If we hold 2.1419, the draw becomes the 1H OB above — 2.1758 to 2.2060.
If we break that level with conviction, 2.1268–2.1052 will serve as the next rebalance zone before any macro continuation.
Execution tier:
✅ Long bias above: 2.1419
🎯 Target 1: 2.1758
🎯 Target 2: 2.2060
❌ Invalidation: Clean 1H body close below 2.1268
Retail waits for signals.
Smart Money builds in silence — and exits with intent.

XRPUSDTHi snipers. We are witnessing good news regarding XRP. The price has also grown well in the one-day timeframe and has reached a sensitive point. If it breaks and crosses the (black) moving average line, we will witness another price jump. I am learning and practicing. This is not a trading offer.

XRP Bearish? Bull Run ExhaustedFractal formed on 1 hr chart within 0.618-0.5 fib zone after price retraced towards 2.2 supply zone. Looks like bulls are exhausted. Expecting further downside below 2

XRP looks like a good area needs volume to push up throughThe volume shelf is holding down, respecting the trendline of a previous bullish area

Price delivered the signal — now it’s time to follow structure.XRP isn’t reacting randomly. It’s responding to engineered inefficiencies and prior OBs that most overlook. What looks like resistance to others is just a staging ground for continuation.
Here’s the play:
Price ran into the 1H OB at 2.2219 — hesitation here was expected
We’re now pulling back into the equilibrium zone, anchored by 0.382–0.618 fib (2.1886–2.1680)
This zone also aligns with the previous 1H OB — an accumulation base that already proved itself
If price holds above 2.1533 and shows rejection at the 0.5 fib (2.1783), I expect the next leg to take out 2.2219 and push toward the 4H OB.
Execution thesis:
Ideal long re-entry is in the 2.18–2.16 zone
Invalidation below 2.1346
Targets: 2.2476 → 2.3107, with 2.2219 as first test
This isn’t about chasing highs. It’s about aligning with structure and letting the draw on liquidity do its work.
Want more trades delivered with this level of clarity? The account description has them. I don’t forecast with hope — I forecast with models.
