Can Ripple hit $3.40 with 15% upside soon?Hello✌
let’s dive into a full analysis of the upcoming price potential for Ripple📈.
BINANCE:XRPUSDT is poised to challenge the $3.40 level soon, supported by a notable increase in market volume 📊. This price zone also coincides with a key support area aligned with sharp Fibonacci levels, offering a strong base for potential upward movement 🔥.
✨ Need a little love!
We pour love into every post your support keeps us inspired! 💛 Don’t be shy, we’d love to hear from you on comments. Big thanks , Mad Whale 🐋
XRPUSDT trade ideas

Lingrid | XRPUSDT Potential Upside BreakoutBINANCE:XRPUSDT is currently retesting its upward trendline and support near 2.20 after failing to hold above the June high. The asset remains in a higher-low structure with repeated attempts to break resistance around 2.35, indicating bullish accumulation. If the price holds this trendline, an upside breakout toward the 2.45 target zone becomes more likely.
📈 Key Levels
Buy zone: 2.20–2.17 (trendline + horizontal support)
Sell trigger: break and close below 2.15
Target: 2.45 resistance, followed by potential toward 2.60
Buy trigger: bullish reversal above 2.20 confirming trendline defense
💡 Risks
Breakdown below 2.20 opens downside risk to 1.92 support
Flat momentum may lead to range-bound movement
Resistance at 2.45 could stall rallies without volume support
If this idea resonates with you or you have your own opinion, traders, hit the comments. I’m excited to read your thoughts!

XRP - Time to buy again!The price has shown strong growth after breaking the head and shoulders pattern, and this upward trend may not end here. It could reach around $4 after a slight correction.
Best regards CobraVanguard.💚

Setupsfx_ | XRPUSDT: Time For Strong Bullish Price Distribution!As previously described, the price bullish reversal did exactly that. The price has moved nicely, and this may be just the beginning of a bigger move. Long-term, we believe XRP will hit a record high, possibly even surpassing $4.
Please use accurate risk management while trading XRP.
Good luck and trade safely!

XRPUSDT → Resistance ahead. Correction before growthBINANCE:XRPUSDT is rising after breaking through consolidation resistance. Bitcoin's rally supported the overall market momentum, but a new resistance zone lies ahead...
Bitcoin is testing its ATH and updating it, but is facing pressure and forming a false breakout. A correction in the flagship coin could trigger a correction in XRP, but if Bitcoin continues to storm the 112K area without a pullback, followed by a breakout, the market could find support and continue to rise.
After XRP broke through resistance, the coin entered a distribution phase and is testing an important resistance zone of 2.4488 - 2.4772. The inability to continue growth, a false breakout, and price consolidation in the selling zone could trigger a correction.
Resistance levels: 2.4488, 2.4772, 2.6524
Support levels: 2.3587, 2.3375, 2.2455
Despite breaking through resistance, XRP is still in a local downtrend. Pressure on the market is still present. The formation of a false breakout will indicate that growth is limited for now. However, if the price consolidates above 2.4772 and begins to break out of the local structure, we can expect growth to continue.
Best regards, R. Linda!

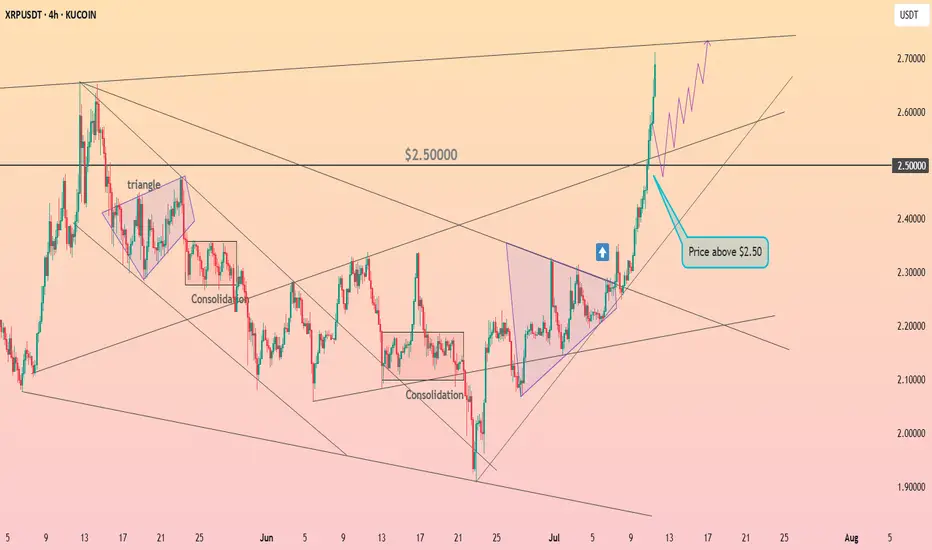
Xrp cup and hundleChart Xrp/usdt (4h)
Classic cup&hundle breakout in play. price broke above the neckline $2.5 with strong volume, followed by a clean retest of the breakout zone

$XRP Bull flag breakout done!🚨 CRYPTOCAP:XRP has exploded from a 7-month bull flag accumulation pattern! 📈🔥
A clean break above $2.40 unlocks the next leg:
→ $3.38
→ $5.10
→ $7.42 potential 🚀
This bull flag has detonated
You had 7 months to accumulate — now comes the markup. So far following the arrows from the last analysis. It should follow the next arrow to 7.5$ as well.

XRP $6.5, $9.5, $12.5 & $15.5 · Which One?XRP broke a small local downtrend and managed to close above a small resistance zone around $2.76. It managed to do this on a full green candle with rising volume.
XRPUSDT weekly is currently trading above all moving averages, extremely bullish: MA200, EMA377, EMA233, EMA89 and the rest.
If we look at a bull market cycle as a series of three steps, we have the first two missing the last one. Compare current action with 2021 while noticing the 1,2,3 numbers on the chart. This leaves us wondering about the next target: How high can XRP go in its next bullish move?
It seems something extraordinary is brewing behind the scenes, I can feel it. What we've been saying all along but rather than just words, a new feeling came up. "It is not the same to live through an event vs talking about it." That kind of feeling.
I can continue to say that market conditions are extremely positive now especially when we compare it to several years ago. But we have not seen the effect this positive conditions will have on the market, the price of the different projects and the charts, but we are getting close.
XRP has big plans and continue to grow, expand and evolve.
The 2021 bull market from bottom to top produced more than 1,800%. In 2025, if we start counting from the July 2024 low, a target of $6.50 would mean a total of ~1,585% growth. Market conditions are better now so we can aim higher, expect more.
A target of $9.51 sounds great, this would mean a nice ~230% from current price and from the same low as before, a total of ~2,400%. This sounds better but we can do more.
The next two targets based on an extension of the current trend would lead to $12.5 and $15.5. I'll let you calculate the potential yourself.
$6.5, $9.51, $12.5 or more; whatever the market ends up giving us, we are happy to be part of this adventure and we are always grateful for the amazing results.
Aim high. I will be here reading the charts live when we are getting close to the top. There will be time to sell, time to adapt, time to decide. There will be enough time for everything if you start now. Prepare now and success is yours.
We are early for the last phase of the XRP 2025 bull market. The first half is in, we are due the second half; it will be great.
Namaste.


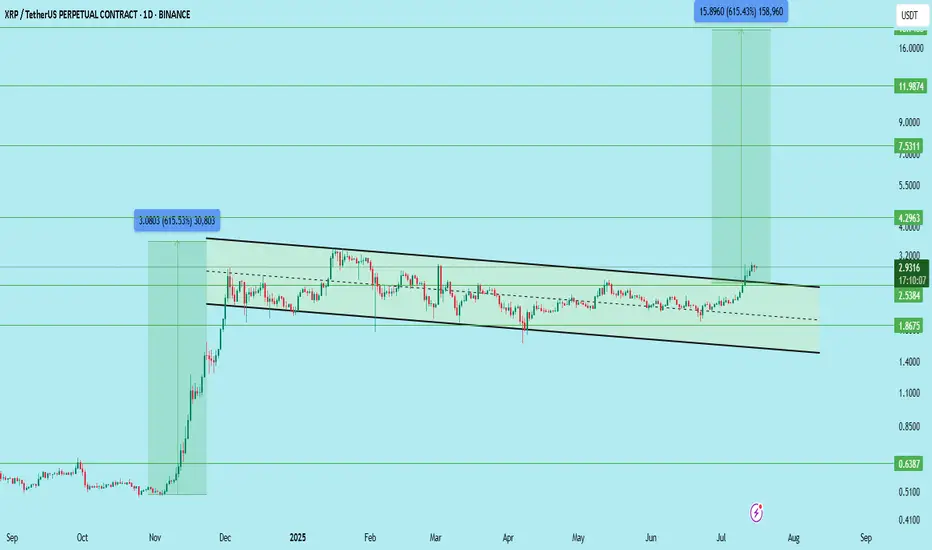
$XRPUSDT LONG TERM SETUP for SPOT !!CRYPTOCAP:XRP has officially broken out of its long-standing descending channel on the daily timeframe.
This is a major structure breakout and opens the door for a big move, but patience is key. Wait for a clean retest before entering the trade.
Trade Setup:
Entry (Ideal Retest Zone): $2.53 – $2.75
Stop Loss: Below $2.38
Resistance/Support Zones:
Immediate Support: $2.53
Resistance Levels: $4.29 / $7.53 / $11.98 / $18.00
Targets (Long-Term):
TP1: $4.29
TP2: $7.53
TP3: $11.98
TP4: $18.00
Potential Profit: Over 500%+ if it plays out fully
This is a long-term breakout structure — don’t rush. Wait for confirmation on the pullback.
DYOR | Not Financial Advice
XRP - Wait For It!Hello TradingView Family / Fellow Traders. This is Richard, also known as theSignalyst.
📈 Is history repeating itself? 🤔
XRP is now back at the $1.75–$2 support zone and forming a fresh inverse head and shoulders pattern.
As long as this support holds, we’ll be on the lookout for new long opportunities. 🟢
For the bulls to take over in the short term, a break above the green neckline is needed.
And for long-term control, a break above the red structure is essential. 🔺
For now, we wait patiently! ⏳
📚 Always follow your trading plan regarding entry, risk management, and trade management.
Good luck!
All Strategies Are Good; If Managed Properly!
~Rich

HolderStat┆XRPUSD above the $2.5KUCOIN:XRPUSDT has rallied sharply, breaking above the key $2.50 resistance following multiple consolidation and triangle patterns. Momentum remains strong, and price structure supports continuation toward the $2.75 resistance zone.
XRP USDT SHORT TRADE SETUPXRP/USDT is currently holding at a strong resistance zone, with a high probability of an downward price move. With a very good risk reward trade.

XRP new movement soon !XRP / USDT
XRP is on a long retest after breakout of accumulation zone weeks ago
successful retest here will result in strong bullish rally !
Keep an eye on it in the coming days 👀
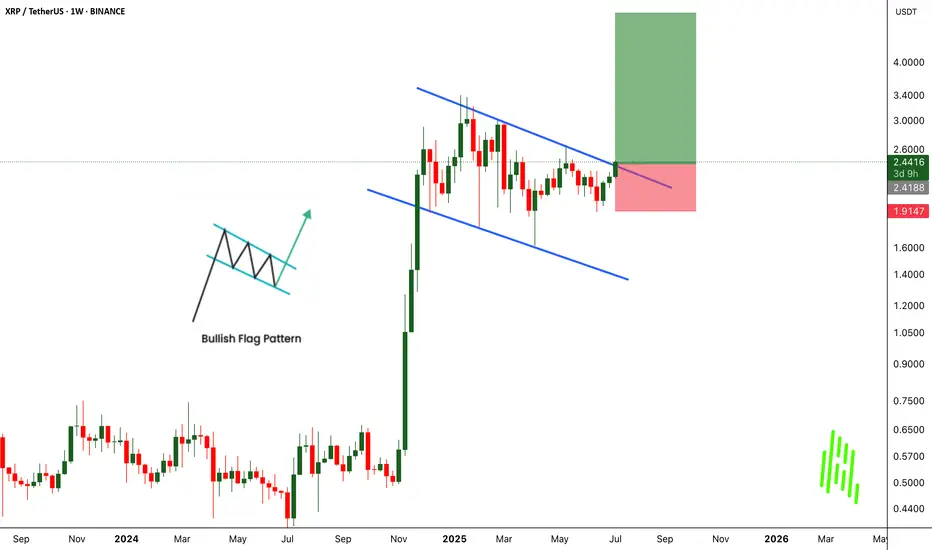
XRPUSDT Breaks Out of Bullish Flag - Big Moves Ahead!BINANCE:XRPUSDT has broken out of a classic bullish flag pattern on the weekly chart, signaling a strong continuation to the upside. This textbook setup is known for its high success rate, and the breakout suggests the potential for significant gains if momentum continues.
The CRYPTOCAP:XRP community remains strong, with long-term holders showing confidence and resilience. With the current market structure and support from loyal investors, there’s a real possibility for the price to double from this breakout zone.
The strategy is simple. Buy and hold for the long term. But as always, traders must manage risk carefully and use a proper stop loss. Let the flag fly high. CRYPTOCAP:XRP could be ready for a major pump from this level.
BINANCE:XRPUSDT Currently trading at $2.43
Buy level : Above $2.4
Stop loss : Below $1.9
Target : $5
Max leverage 3x
Always keep stop loss
Follow Our Tradingview Account for More Technical Analysis Updates, | Like, Share and Comment Your thoughts
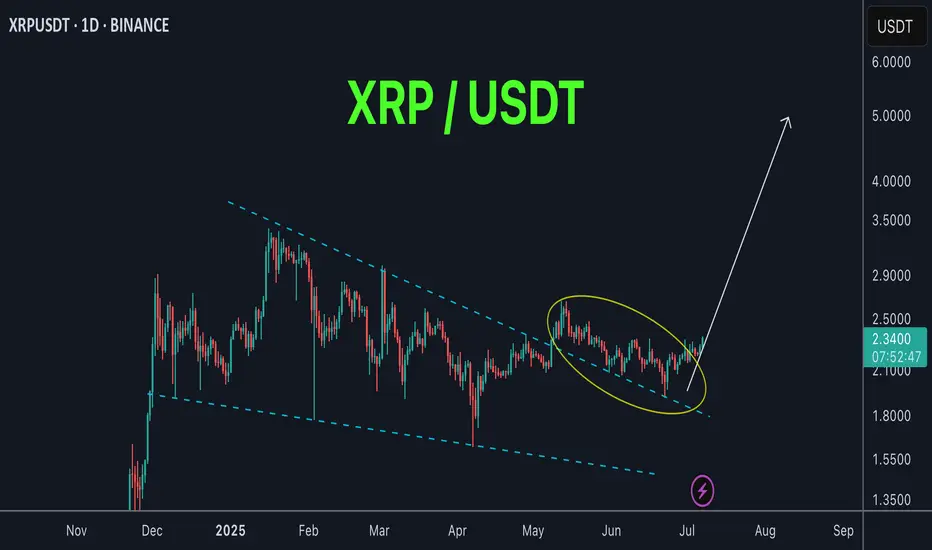
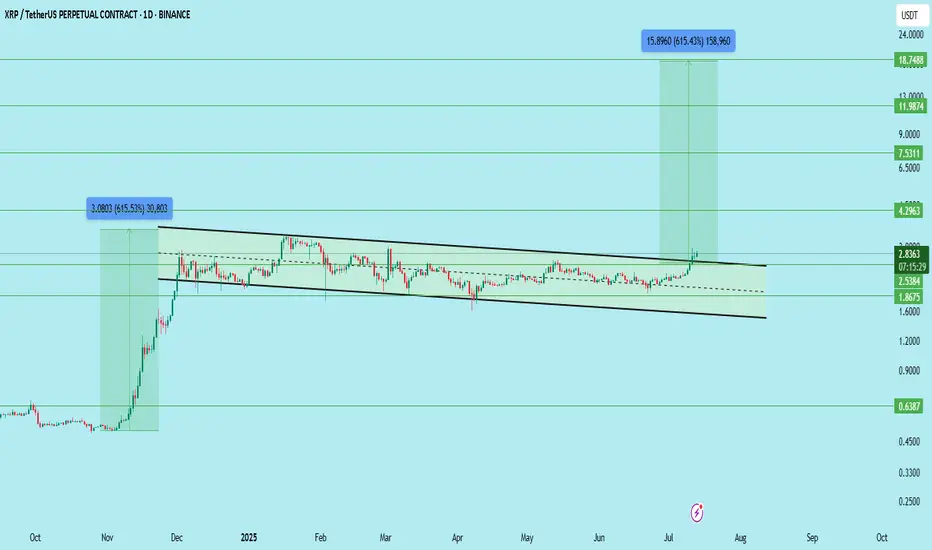
XRP/USDT – Long-Term Breakout Setup FormingXRP has broken out of a multi-month falling channel and is showing early signs of a macro bullish shift. However, price has printed a series of strong green candles, so waiting for a clean retest before entry is advised.
Key Levels:
Support Zones: 2.5384 | 2.00 | 1.8675
Resistance Zones: 2.8340 | 4.2963 | 7.5311 | 11.9874 | 18.7488
Breakout Level: 2.5384 (channel breakout and current structure retest area)
Setup Strategy:
Entry (Ideal): On retest near 2.53–2.60 support zone
Stop Loss: Below 2.00 (or tighter depending on risk appetite)
Target 1: 4.2963
Target 2: 7.5311
Target 3: 11.9874
Target 4 (Final): 18.7488
Upside Potential: Over 600% if the structure plays out fully
Structure Insight:
Multi-month falling channel breakout confirmed
Continuous green candles suggest short-term overextension
Safer entry lies in retest and hold of the breakout zone
Long-term accumulation zone forming between 2.53–2.83
This setup favors long-term investors and swing traders waiting for a macro move. Let the price come to you — avoid chasing.
DYOR | Not Financial Advice
#XRP #Ripple
XRP Ready To Grow: $4.5 w/ 5X Lev = 475% Profits PotentialThe last time XRP moved above EMA55 daily was in early November 2024, you know pretty well what happened right after. Just a few days after EMA55 was conquered as resistance XRP grew from a price of $0.54 to a peak of $2.90 in less than one month. It continued to rise and peaked again but this time at $3.40. The market turns bullish above EMA55 and this same signal is active, valid, live today.
XRPUSDT has been fighting with EMA55, fluctuating around this level, since late April. Now, this resistance is no more. The bullish bias is fully confirmed after a decisive higher low. This is it... This is all we need, the next target is up.
» 95% is the easy target at $4.50. With 5X lev. we get 475%.
We've done this together many times before... This is not the last target but since this is a strong resistance we can wait for the retrace and enter again once support is found. That is, there will be a stop at this level.
This is a strong chart setup. The price is not the best ever, it would be better to enter lower and that is why we have only 5X. With a lower price we can do 7X, 8X and even up to 10X. Hardly ever I recommend more than 10X, it just isn't necessary and the risk is too high.
I am wishing you great profits and continued success.
This is a friendly reminder to let you know that XRP is ready to grow.
Thank you for reading.
Namaste.

Good moment for try to Buy XRPGood moment for try to Buy XRP. We are in a sideways trend and are now approaching its upper border. We will take a breakout. Stop under the lower line of the channel. We'll see


XRPUSDT BINANCE:XRPUSDT Price broke above the downtrend line but faced resistance at 2.2770 dollars and started correcting. Key supports are at 2.1900 and 2.0800 dollars. If it bounces, resistances to watch are 2.2770, 2.3600, and 2.4620 dollars. Price is currently between key levels.
Key Levels:
Support: 2.1900 – 2.0800
Resistance: 2.2770 – 2.3600 – 2.4620
⚠️Contorl Risk management for trades.

DeGRAM | XRPUSD seeks to retest of the resistance line📊 Technical Analysis
● A third rebound from the rising purple support (green dots) printed a bullish engulfing that has already forced price back above the short-term grey down-trend, signalling a momentum shift.
● XRP is now coiling inside a contracting triangle capped by the purple resistance line near 2.40; the 18 ¢ consolidation width implies 2.45 on a break, while the April pivot at 2.65 lines up with the upper channel for the next objective.
💡 Fundamental Analysis
● Ahead of the 23 July SEC – Ripple status hearing, HSBC’s digital-asset unit announced a pilot using XRP for cross-border settlement, lifting social volume and spot bids.
✨ Summary
Buy 2.10-2.20; confirmed close above 2.40/2.45 targets 2.60-2.65. Thesis void on a 16 h close below 1.98.
-------------------
Share your opinion in the comments and support the idea with a like. Thanks for your support!

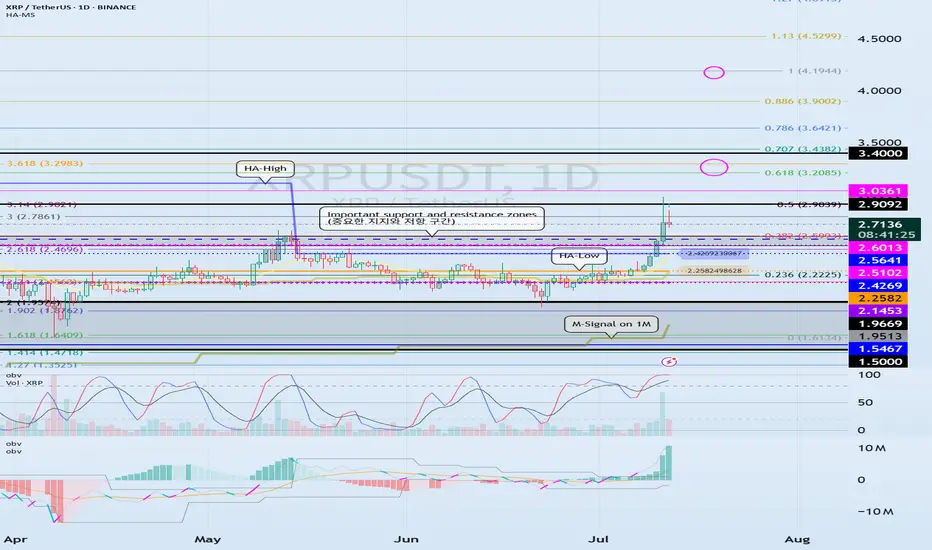
Check support above 2.5102-2.6013
Hello, traders.
If you "Follow", you can always get new information quickly.
Have a nice day today.
-------------------------------------
(XRPUSDT 1D chart)
It has broken through the important support and resistance zone.
Accordingly, the key is whether the price can be maintained above 2.5102-2.6013 and rise.
If the price is maintained above 2.5102-2.6013, it is possible that a stepwise rise will occur.
At this time,
1st: Right Fibonacci ratio 0.618(3.2085) ~ Left Fibonacci ratio 3.618(3.2983)
2nd: Right Fibonacci ratio 1(4.1944)
You need to check for support near the 1st and 2nd above.
The strong support area is 1.5-1.9669.
----------------------
The left Fibonacci ratio was drawn in the initial rising wave, and the right Fibonacci ratio was drawn in the recent rising wave.
Therefore, if the price rises above 3.618(3.2983) of the Fibonacci ratio drawn in the initial rising wave and maintains it, there is a high possibility of creating a new wave.
Since the Fibonacci ratio is a tool for analyzing the chart, it is not good to use this point as a support and resistance point.
Therefore, we need to check whether the DOM(60) indicator or the HA-High indicator is newly created and create a response strategy depending on whether there is support.
Currently, the DOM(60) indicator is formed at the 2.5102 point, and the HA-High indicator is formed at the 2.4269 point.
The basic trading strategy is to buy near the HA-Low indicator and sell near the HA-High indicator.
However, if it receives support in the HA-High ~ DOM(60) section and rises, it is likely to show a stepwise upward trend, and if it receives resistance in the DOM(-60) ~ HA-Low section and falls, it is likely to show a stepwise downward trend.
Therefore, trading begins by checking whether there is support in the DOM(-60) ~ HA-Low section and the HA-High ~ DOM(60) section.
-
Thank you for reading to the end.
I hope you have a successful transaction.
--------------------------------------------------
- Here is a description of the big picture.
(3-year bull market, 1-year bear market pattern)
I will explain more details when the bear market starts.
------------------------------------------------------
LIVE TRADE (XRP)Hello friends🙌
🔥Here we are with live trading Ripple, please follow capital management.
📈Given the resistance break, we can enter a buy trade and move with it to the specified targets.
🔥Follow us for more signals🔥
*Trade safely with us*
