(2-hour timeframe for WTI Crude Oil (USOIL).(2-hour timeframe for WTI Crude Oil (USOIL)), here’s the technical analysis and target zones:
🟦 Key Observations:
Price is trading in an ascending channel.
I'm using the Ichimoku Cloud for trend confirmation.
There are two clear target zones marked with arrows.
---
🎯 Target Levels (as shown

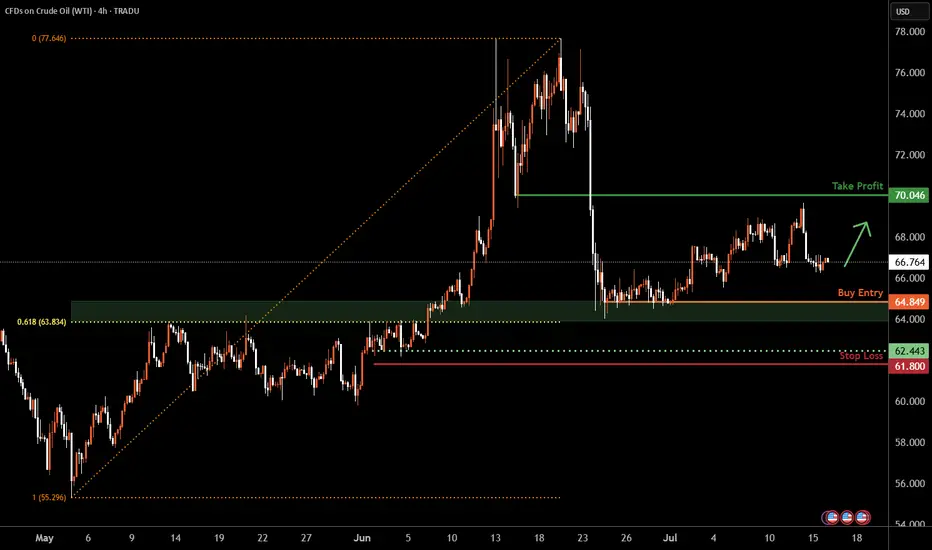
WTI Oil H4 | Potential bounce off a multi-swing-low supportWTI oil (USOIL) is falling towards a multi-swing-low support and could potentially bounce off this level to climb higher.
Buy entry is at 64.84 which is a multi-swing-low support that aligns closely with the 61.8% Fibonacci retracement.
Stop loss is at 61.80 which is a level that lies underneath a
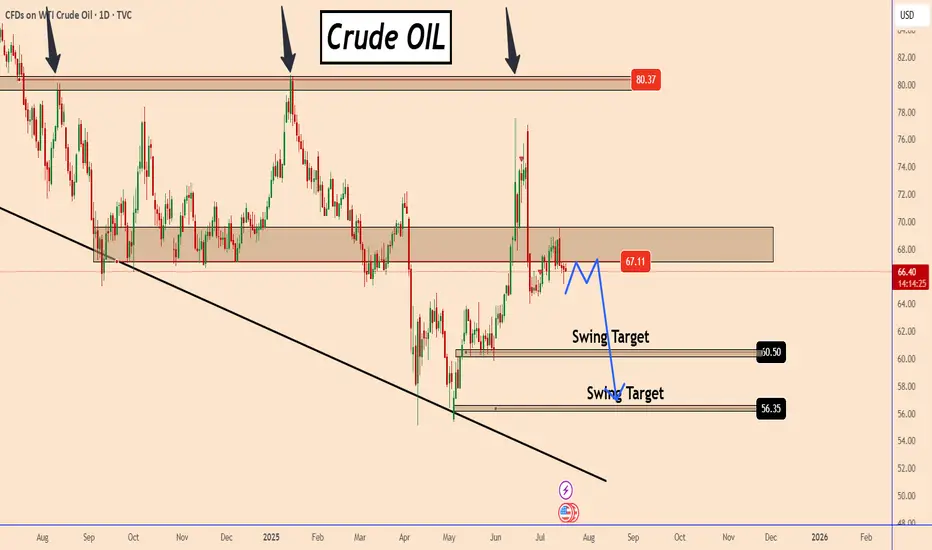
OIL: The Chances To Drop Are Growing FurtherOIL: The Chances To Drop Are Growing Further
OIL has days in this zone. Overall it's developing as I explained earlier.
The price increased a bit more than expected but again it's in a strong structure zone and is holding strong.
I think that OIL has to create a better pattern, but overall it lo
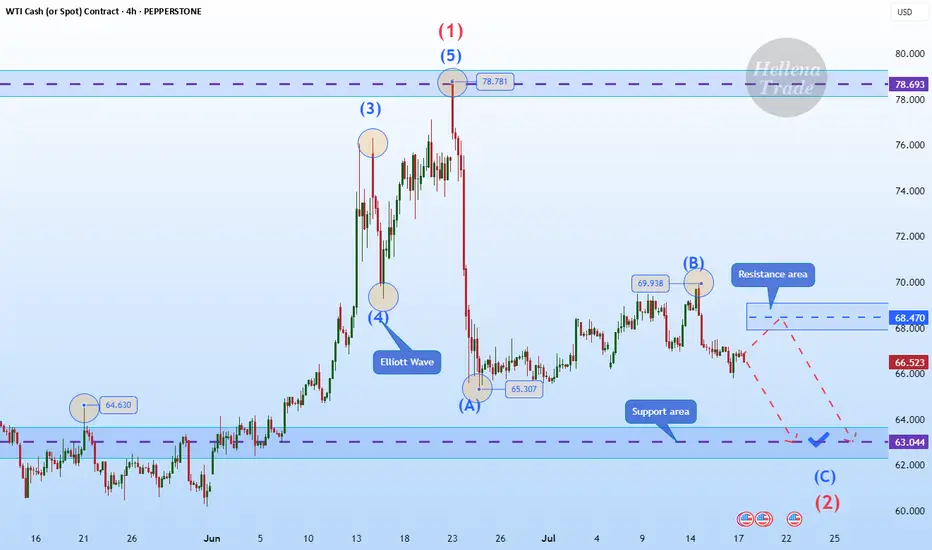
Hellena | Oil (4H): SHORT to support area of 63.000.Colleagues, I believe that wave “B” has formed at the level of 69.938, and now we expect the downward movement to continue with the aim of completing wave ‘C’ of the middle order and wave “2” of the higher order in the support area of 63,000.
It is quite possible that the price could reach the 60,0
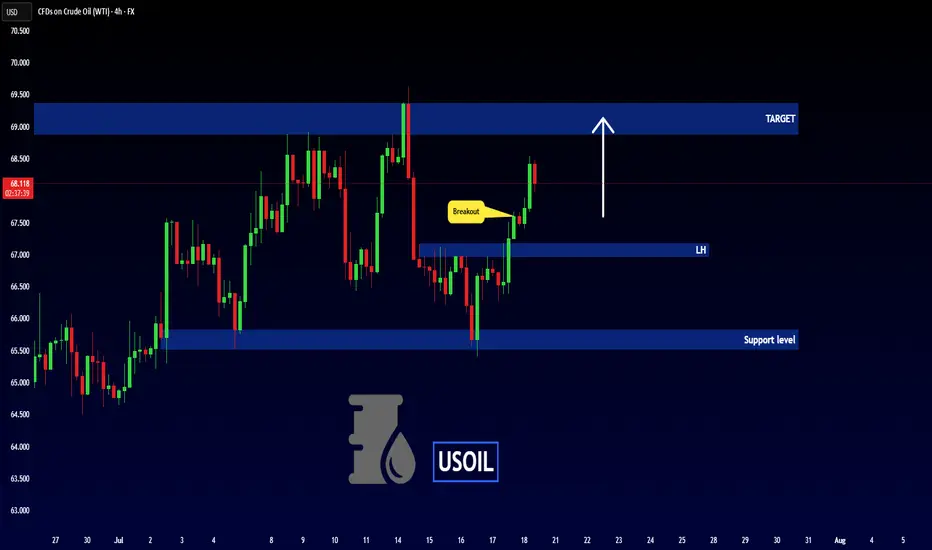
USOIL - BULLISH MOVE !Hello Traders !
The USOIL failed to create a new lower low!
The price broke the lower high (choch).
So, I expect a bullish move🚀
______________
TARGET: 68.880🎯
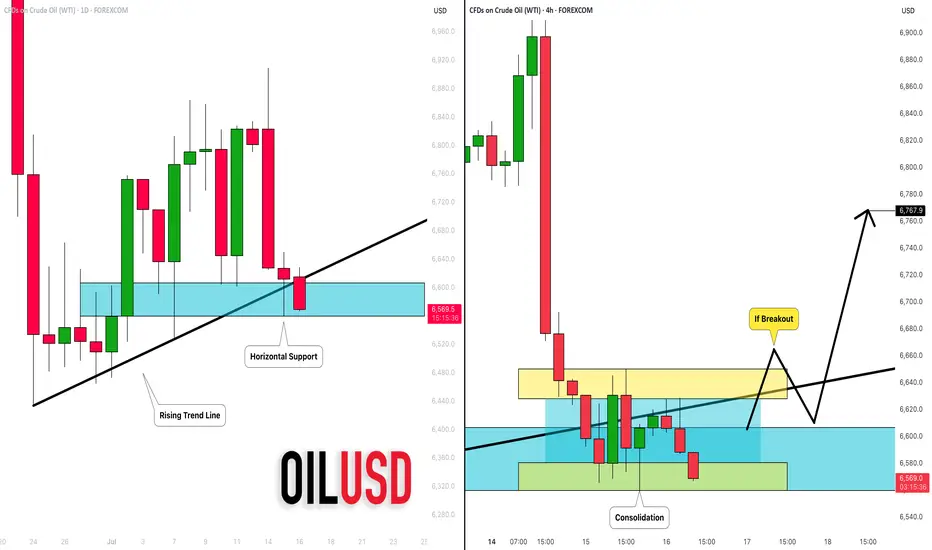
CRUDE OIL (WTI): Your Trading Plan Explained
Do not forget that today we expect Crude Oil Inventories data
release - it will be 10:30 am NY time.
Ahead of this news, the market is testing a significant daily support cluster
that is based on a rising trend line and a horizontal structure.
You signal to buy will be a bullish breakout of a m
Heading into 50% Fibonacci resitance?WTI Oil (XTI/USD) is rising towards the pivot and could reverse to the 1st support.
Pivot: 71.43
1st Support: 65.55
1st Resistance: 76.08
Risk Warning:
Trading Forex and CFDs carries a high level of risk to your capital and you should only trade with money you can afford to lose. Trading Forex a

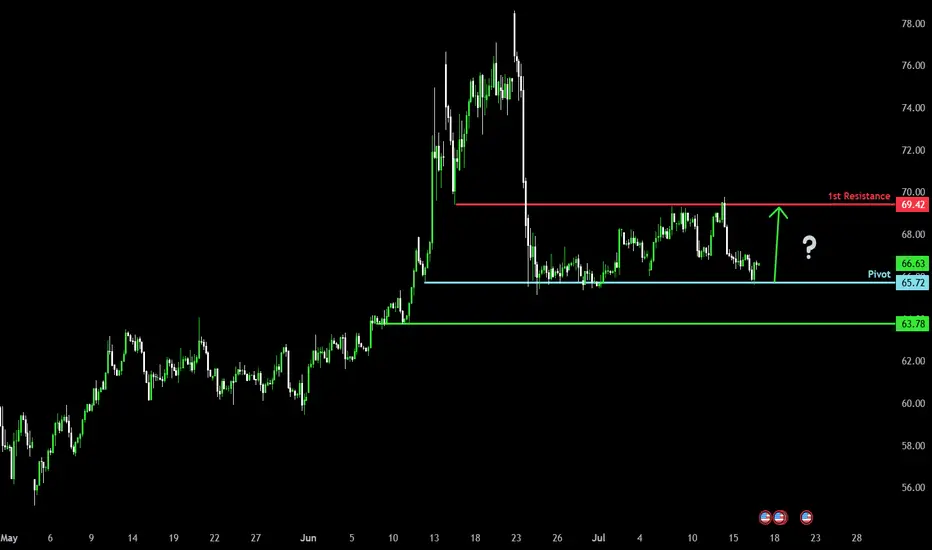
Bullish bounce off major support?WTI Oil (XTI/USD) has bounced off the pivot which has been identified as a pullback support and could rise to the 1st resistance.
Pivot: 65.72
1st Support: 63.78
1st Resistance: 69.42
Risk Warning:
Trading Forex and CFDs carries a high level of risk to your capital and you should only trade with
Retest fails on USOILOil dropped Wednesday on expectation of poor WTI stockpile data. Data confirmed bearish bias although retest of trend line proceeded. Retest has failed.
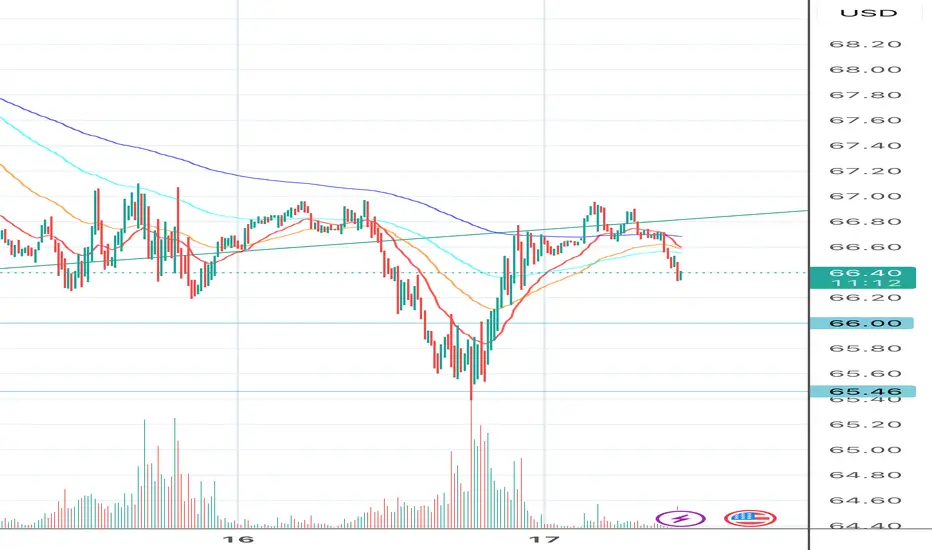
Crude Oil Short Setup
Entry: 66.40
SL: 67.20
TP: 64.85
Risk to Reward: 1.93
Bias: Bearish
I expect mid-term downside pressure on crude oil prices, mainly due to the following reasons:
The U.S. is mitigating the impact of energy tariffs by increasing domestic supply.
Pressure on OPEC to boost production is rising.

See all ideas
Displays a symbol's price movements over previous years to identify recurring trends.