Cable & Fibre!So, generally I'm happy with the way the market is going. Though a little bit uncertain about how high it wants to go before it resumes its downward spiral, things are going good so far.
Looking at Cable, on an hourly chart, we see that between 06:00 am and 08:00 am (New York Time), there is FVG fo
Explore the community

RBA Cut by 25bp: Where From Here?The Reserve Bank of Australia (RBA) finally delivered the 25bp cut I anticipated in July. I take a quick look at how they have updated the economic forecasts that matter, and how Aussie markets reacted.
Matt Simpson, Market Analyst at City Index and Forex.com

Bitcoin, Ethereum Breakout: 401(k) funds & the next "Altseason"Bitcoin is up 10% in August, driven by strong ETF inflows and a game-changing executive order allowing 401(k) retirement funds to invest in cryptocurrencies, potentially bringing trillions of dollars into the sector.
Technically, Bitcoin and Ethereum are breaking out toward multi-year highs, with B

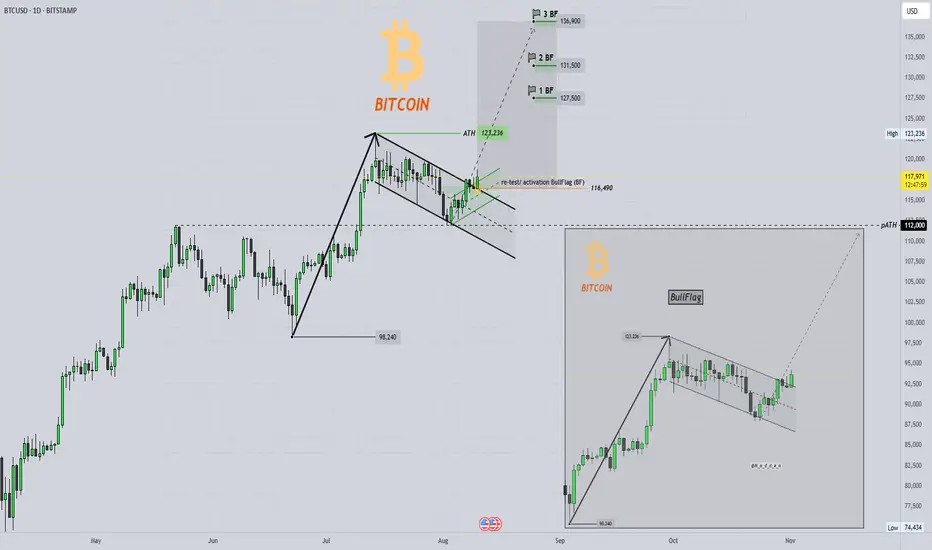
BITCOIN Bullflag and new all-time high ?!BULL FLAG and new all-time high 👀⏰
📇BTC daily-chart (BITSTAMP) and 💡everything important in the chart !
Bitcoin has broken out of its sideways consolidation and has recently successfully tested this channel (bull flag), thereby activating a potential bull flag.
The resulting targets (see example
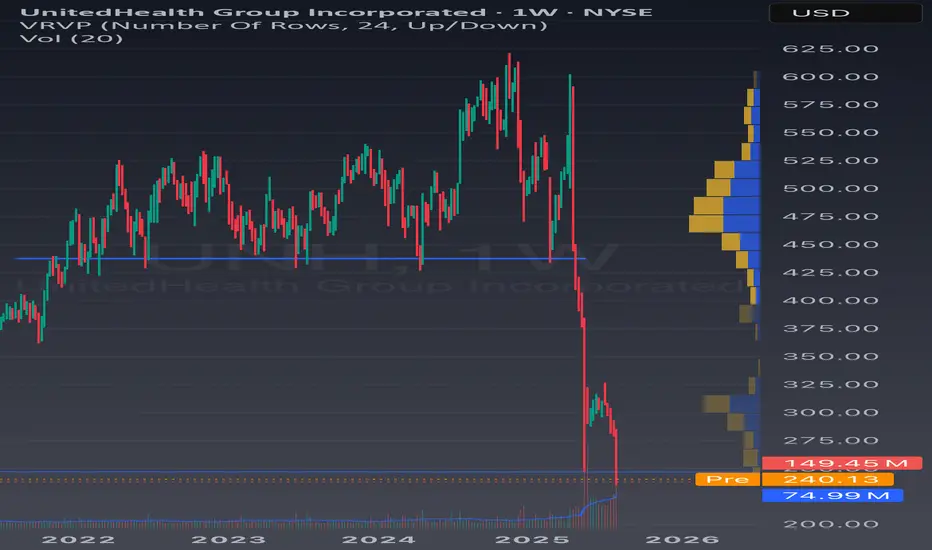
UnitedHealth: Deeply oversold but worth a closer lookUnitedHealth (UNH) is the largest private healthcare company in America. Eight million Medicare Advantage members. Optum’s network reaches tens of millions more. It has the data, the reach, and the pricing power. At today’s valuation, it’s worth adding to your watchlist. Forward P/E at 11× versus a

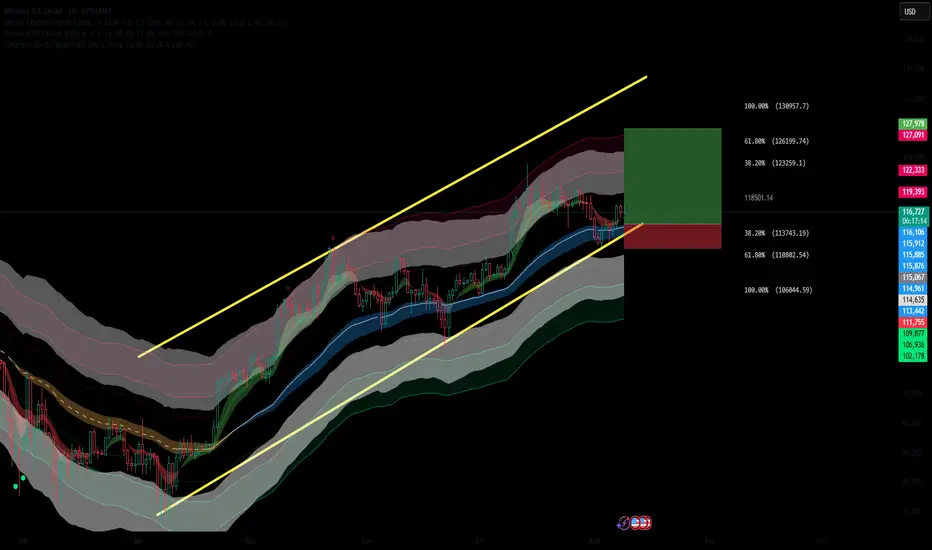
BTC Holding Strong: Fibonacci Levels Point to $130KBITSTAMP:BTCUSD is holding above a key dynamic support zone at the lower boundary of its ascending channel, with current price action signaling a potential continuation to the upside. This long setup is supported by multiple bullish confluences.
✅ Bullish Confluences:
Fibonacci Retracement Suppor
BITCOIN DAILY/4HR THE daily trendline and 4hr trendline break out will be watched for forward guidance.
if we break the top layer resistance we buy and target 123k current all time and high and factor the possibility of 135-130k-128k zone for next sell.
And our sell will be on break of steep ascending trendline a

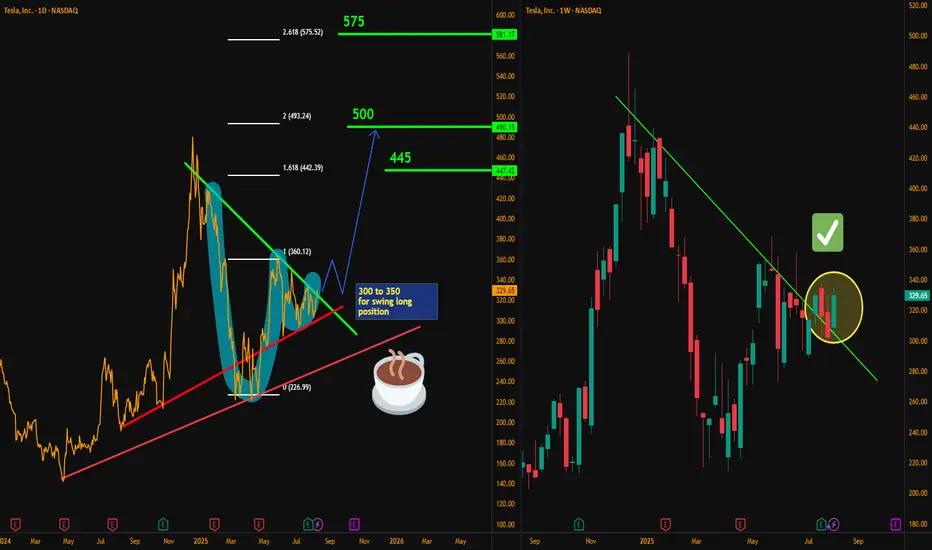
Tesla Roadmap: From $300 Zone to $575Hello traders, here’s my latest analysis on Tesla (TSLA) based on the weekly and daily timeframes. On the weekly chart, I have drawn a downtrend line starting from December 2024, and the recent price action shows a breakout above this line on a weekly close. This breakout is a promising sign that an
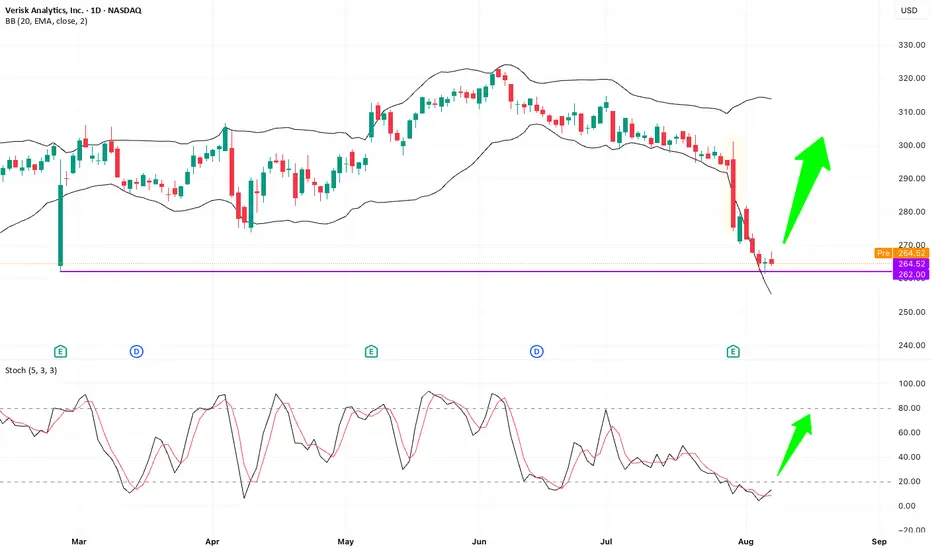
VRSK – Bullish Pin Bar at Key Support after Earnings Flush?NASDAQ: VRSK delivered good quarterly results, yet price action showed a sharp flush-down bar breaking below the lower Bollinger Band. Recently, price retested the key previous low level at $262, triggered some small stop-losses, and closed back at $262 with a bullish small pin bar. Double bottom se
EUR/CAD – 93% Traders Are SHORT! Bearish Reversal Brewing?The EUR/CAD pair is currently in a bullish trend, but multiple technical and sentiment signals are pointing toward a possible trend reversal.
🔍 Key Observations:
Trend: Bullish (but losing momentum)
Bearish Divergence: Price making higher highs while RSI indicators show lower highs.
Pattern:

See all editors' picks ideas
AMP Futures - Heikin Ashi meets bar Replay!In this idea we will demonstrate how to access the NEW Heikin Ashi bar replay feature in Tradingview.


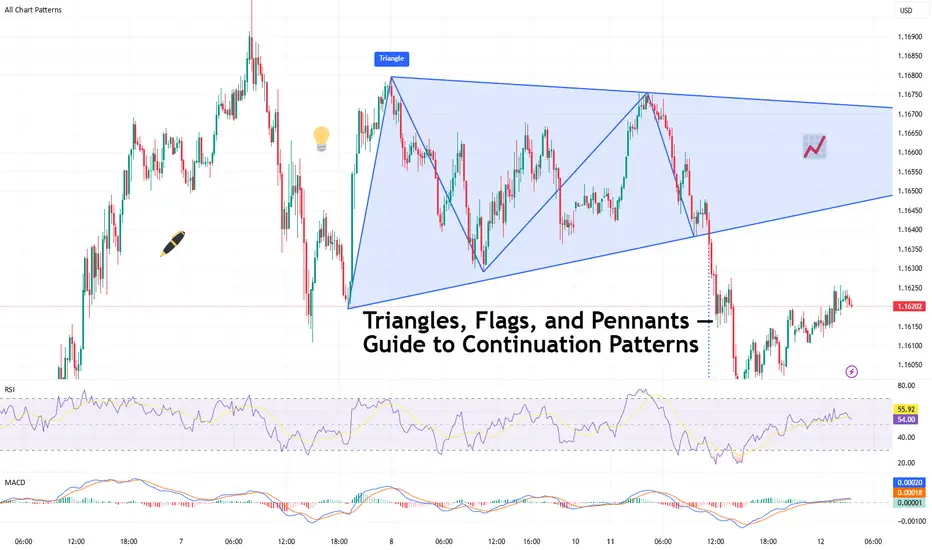
Triangles, Flags, and Pennants — Guide to Continuation PatternsChart patterns can be mysterious — until they’re not. Let’s break down the technical trio that tells you when a trend’s just taking a breather before it flexes again.
So your chart’s been pumping higher for weeks, and then… nothing. Price starts scribbling sideways. Cue panic? Maybe. But more like
Support & Resistance – Quick Guide In 5 StepsSupport and resistance are key concepts in technical analysis that help traders identify where price is likely to react.
Support acts like a floor — a level where buying interest is strong enough to prevent further declines.
Resistance acts like a ceiling — a level where selling pressure can

The Platinum BulletOver the years, I have posted a lot of educational content here on TradingView. Everything from Elliot waves to Wyckoff, psychology to Gann.
I have been lucky as a trader, 25 years doing this you pick up a thing or two. But above everything else, what you realise is that trading is a mindset game

The Illusion of ControlThere comes a point in every trader’s journey when you do everything right, and it still goes wrong.
You plan the trade meticulously, plot the levels, define your risk, wait patiently for the setup, and enter with the kind of discipline that would make any textbook proud. You follow your rules.
Turning Stock Declines Into Your Best Trading OpportunityTurning Stock Declines Into Your Best Trading Opportunity
When stocks fall dramatically, many investors panic. But what if those drops were actually the set-up for some of the most lucrative opportunities?
In this article, you’ll discover why sharp declines can set the stage for outsized gains
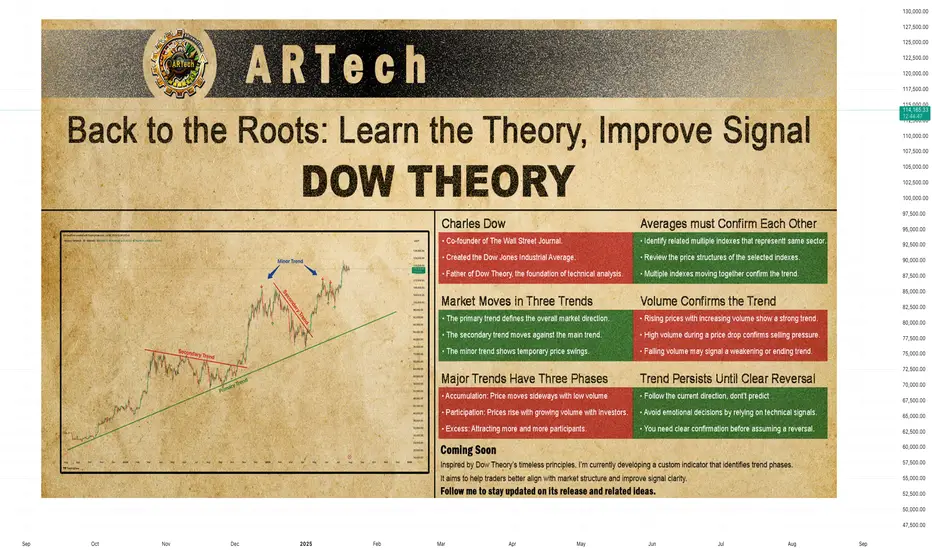
DOW THEORYBack to the Roots: Learn the Theory, Improve Signal
Charles Dow
Before we explore Dow Theory, let’s take a moment to understand who Charles Dow was — and why his ideas still matter today.
Charles Dow wasn’t a financial expert. He was a journalist with a sharp eye for market behavior. In the late
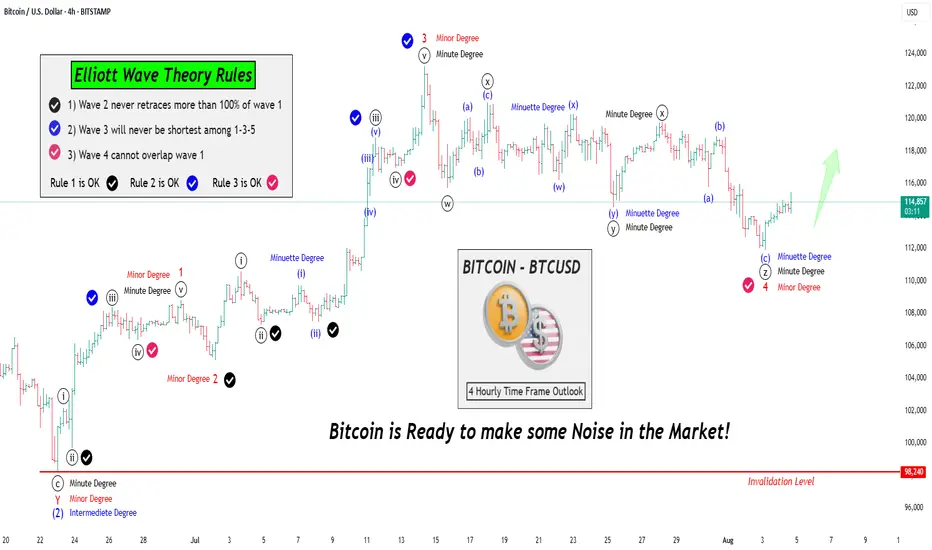
Let's learn & Apply Elliott Wave Rules on chart: BTCUSD BitcoinHello Friends,
Welcome to RK_Chaarts,
Friends, Today we are going to learn 3 Rules of the Elliott Wave theory, there are three principles and some patterns. Impulses move in a 1-2-3-4-5 pattern, either as an impulse or a motive wave. However, within impulses, there are three rules:
Rule No 1:
How to Use Engulfing Candles in TradingViewEngulfing patterns are among the most powerful candlestick formations because they signal strong momentum shifts and can help you spot dramatic trend reversal opportunities.
What You'll Learn:
• How to identify valid engulfing formations where one candle completely covers another's bo

See all editors' picks ideas
Cable & Fibre!So, generally I'm happy with the way the market is going. Though a little bit uncertain about how high it wants to go before it resumes its downward spiral, things are going good so far.
Looking at Cable, on an hourly chart, we see that between 06:00 am and 08:00 am (New York Time), there is FVG fo
RBA Cut by 25bp: Where From Here?The Reserve Bank of Australia (RBA) finally delivered the 25bp cut I anticipated in July. I take a quick look at how they have updated the economic forecasts that matter, and how Aussie markets reacted.
Matt Simpson, Market Analyst at City Index and Forex.com
AMP Futures - Heikin Ashi meets bar Replay!In this idea we will demonstrate how to access the NEW Heikin Ashi bar replay feature in Tradingview.
Bitcoin, Ethereum Breakout: 401(k) funds & the next "Altseason"Bitcoin is up 10% in August, driven by strong ETF inflows and a game-changing executive order allowing 401(k) retirement funds to invest in cryptocurrencies, potentially bringing trillions of dollars into the sector.
Technically, Bitcoin and Ethereum are breaking out toward multi-year highs, with B
BITCOIN DAILY/4HR THE daily trendline and 4hr trendline break out will be watched for forward guidance.
if we break the top layer resistance we buy and target 123k current all time and high and factor the possibility of 135-130k-128k zone for next sell.
And our sell will be on break of steep ascending trendline a
How to Use Engulfing Candles in TradingViewEngulfing patterns are among the most powerful candlestick formations because they signal strong momentum shifts and can help you spot dramatic trend reversal opportunities.
What You'll Learn:
• How to identify valid engulfing formations where one candle completely covers another's bo
GBPUSD Traders Beware: A Major Drop Could Be ComingThe classic rule says what doesn’t go up must come down. After a failed breakout at 1.3439, GBPUSD is struggling. With longs sitting on big gains from January’s low, a drop toward 1.3361 or even lower looks likely. Watch this key level now.
This content is not directed to residents of the EU or

TradingView Show: Trade Ideas You Can't Miss with TradeStationJoin us for a timely TradingView live stream with David Russell, Head of Global Market Strategy at TradeStation, as we break down the latest rebound in the markets and what it could mean for traders and investors. In this session, we’ll dive into:
- New sectors to watch, like homebuilders
- Prio

Using 1 min time frame for entries on VX algo & day tradingwhat time frames do you use to confirm entries outside of a buy signal?
If I am day trading, I will mainly use the 1 minute time frame to look for moving average support and resistance, and read the candle stick patterns as well from that chart.
However, there are times I'll switch to a 5 minute a

See all editors' picks ideas
Dynamic Swing Anchored VWAP (Zeiierman)█ Overview
Dynamic Swing Anchored VWAP (Zeiierman) is a price–volume tool that anchors VWAP at fresh swing highs/lows and then adapts its responsiveness as conditions change. Instead of one static VWAP that drifts away over time, this indicator re-anchors at meaningful structure points (swings).

Trading Holidays and Expiry CalendarTrading Holiday and Expiry Calendar
This indicator displays calendar for current and next 2 months. Calendar marks ‘CRITICAL DAYS’ on the calendar.
‘CRITICAL DAYS’:
Trading Days
Trading Holidays
Weekends
Expiry Days
Out of these ‘Expiry Days’ are marked based on User input and rest of

Drawdown Distribution Analysis (DDA) ACADEMIC FOUNDATION AND RESEARCH BACKGROUND
The Drawdown Distribution Analysis indicator implements quantitative risk management principles, drawing upon decades of academic research in portfolio theory, behavioral finance, and statistical risk modeling. This tool provides risk assessment capabilit

FunctionADFLibrary "FunctionADF"
Augmented Dickey-Fuller test (ADF), The ADF test is a statistical method used to assess whether a time series is stationary – meaning its statistical properties (like mean and variance) do not change over time. A time series with a unit root is considered non-stationary and

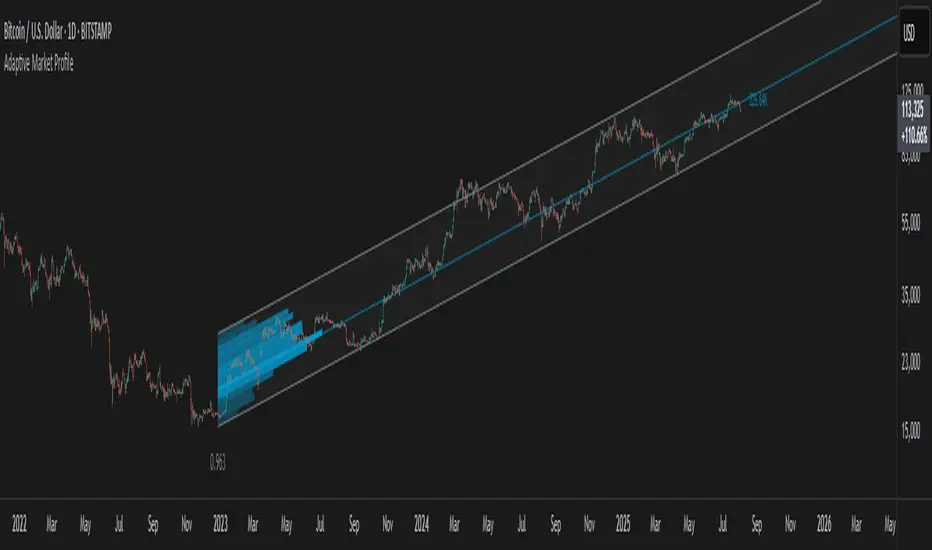
Adaptive Market Profile – Auto Detect & Dynamic Activity ZonesAdaptive Market Profile is an advanced indicator that automatically detects and displays the most relevant trend channel and market profile for any asset and timeframe. Unlike standard regression channel tools, this script uses a fully adaptive approach to identify the optimal period, providing you
Trading Report Generator from CSVMany people use the Trading Panel. Unfortunately, it doesn't have a Performance Report. However, TradingView has strategies, and they have a Performance Report :-D
What if we combine the first and second? It's easy!
This script is a special strategy that parses transactions in csv format from Paper

Smart Money Breakout Channels [AlgoAlpha]🟠 OVERVIEW
This script draws breakout detection zones called “Smart Money Breakout Channels” based on volatility-normalized price movement and visualizes them as dynamic boxes with volume overlays. It identifies temporary accumulation or distribution ranges using a custom normalized volatility me

Trend Range Detector (Zeiierman)█ Overview
Trend Range Detector (Zeiierman) is a market structure tool that identifies and tracks periods of price compression by forming adaptive range boxes based on volatility and price movement. When prices remain stable within a defined band, the script dynamically draws a range box; when p

BE-Indicator Aggregator toolkit█ Overview:
BE-Indicator Aggregator toolkit is a toolkit which is built for those we rely on taking multi-confirmation from different indicators available with the traders. This Toolkit aid's traders in understanding their custom logic for their trade setups and provides the summarized results o

Synthetic VX3! & VX4! continuous /VX futuresTradingView is missing continuous 3rd and 4th month VIX (/VX) futures, so I decided to try to make a synthetic one that emulates what continuous maturity futures would look like. This is useful for backtesting/historical purposes as it enables traders to see how their further out VX contracts would'

See all editors' picks scripts