GOLD TRADING GAUGE | EASY TO OBSERVEThe 'Why' Insight:
The other way to keep your money is to put it in a savings account or into bonds that aren't very risky and will pay you interest. People who invest in gold lose money when interest rates go up because the yields on savings accounts and bonds also go up, which makes gold less appealing as a long-term investment. It is very important to look at the interest rate when you are trying to figure out how much gold is worth. Storage costs and insurance are two more things to think about. The price of the commodity will be the sum of all of these things.
Thereafter, how the price moves depends on things like the movement of the US Dollar and things like demand and supply.
Warning: This is the broader view, not the detail spesific method for entry.
Fundamental-analysis

What is the pricing in factor?Pricing In
Human behaviour, specifically greed and impatience are some of the main reasons the markets move the way they do. The term pricing in is the definition and illustration of human impatience. Due to the fear of missing out, impatience, and greed, humans natural instinct after hearing a rumour without any solid information to back it is the buy into it.
Brexit has been causing a lot of this recently with rumours of a possible Brexit solution which causes investors to “price in” based on the rumours.
Interest rate cuts are another example where they begin to get priced in based on the rumours.
Buy the rumour, sell the news. A sentence commonly seen in the trading world. Let's imagine we have interest rate data expected to be released at 2%. The current rate is 3%. This data is seen as negative as the interest rate is dropping so many people can begin to factor that information in days prior to the release of the news. This is demonstrated by a drop in the price of the currency much earlier than the actual release. Once the data is released, it comes out at 2%, and you may notice the price does not move much. This is due to the fact that the price has dropped and been factored in prior. However, let's imagine the data released at 1.5% which is worse than expected, you can expect the value to decrease majorly. On the other hand if the data was released at 2.5%, even though the interest rate still fell from 3 to 2.5%, it is still expected to see an increase in value of the currency due to the data being greater than the expected result. In other words, when data release is unexpected, you should expect great volatility in the markets.
In the markets, it is important to always watch for the unexpected at all times. Data may be predicted to be very positive or very negative and once released it can be the total opposite. Don't get caught up in trading news as it is not suggested, however learn how to use the fundamentals to your advantage and imply them into your technical analysis.

How to trade fundamentals (AUDUSD BUYS)Hey traders!
A common question I get is, do I trade fundamentals??
-From my experience it is to hard to trade off the back of data releases as the moves are to quick to happen and usually get very messy...
-Fundamentals I believe just help push a currency in the right direction as technicals give us the entry points to catch these moves
-For me its a rule to always have my stop-loss at breakeven when trading around the times of any news event or data release.
-It is important that we always know when a big event or release is coming out to cover any trades we currently have running or are about to open, price can move so quick and cause slippage on accounts especially if you are over leveraged.
-So the answer is I do and I don't trade fundaments, the aim of the game for me is to already be in a position with stops at breakeven to catch the bigger move but also protecting my account at the same time, at the end of the day we never know what's going to happen and price can do some wild things...
......... fundamentals overall control the market but technicals provide us with the entry points and create market structure.........

My Issue With Technical AnalysisI am going to have to choose my words carefully in this article, as I am sure it will be an unpopular one. I first want to say that TA clearly has a time and a place, and is excellent for certain aspects of creating your position. But I fear the idea of TA is far to simple and it fails to recognize the various factors of market price.
Where TA Works
The idea of Technical Analysis in theory is a magnificent one. The idea that people are consistent and that trends will repeat themselves. In some cases I would agree; TA is highly useful for determining the short term price action of a stock. RSI (Relative Strength Index) is a solid measure of whether a stock is over bought or over sold, and momentum indicators are a sound way to map out the length and intensity a security will move. Finding the price channel of a security is a highly effective way to map out price targets, you may use the Fib Retracement Lines. The three techniques mentioned above are backed by history and are all based around direction of price due to the days prior. I believe that if using TA in this manner, traders can be very successful, if they consider many other factors.
Where TA Doesn't Work
I believe there is far to much "wishy-washy", for the lack of a better term, ideas in TA. There is far to many people "Reading candle sticks", an ineffective method backed by absolutely nothing. Before you come for my head, understand; In finance, all securities fairly priced are backed by the numbers to support that price. They are backed by the previous momentum and are tied heavily to the overall market. Nothing in finance is just a random occurrence, somebody somewhere planned for, and made it happen. So the idea that a close and a open are going to effect the next day's price, is nonsense. The idea that patterns may happen again, is valid, but the environment which it is set up in must be the exact same. I believe there are far to many strategies that people claim to work, that don't. I believe it is far to difficult for any human to see a pattern in the midst of it happening, rather than after the fact.
In conclusion, I want to say I am not bashing on those who believe in TA, but I see too many inconsistencies with it. I believe when mapping momentum, planning entrance and exits, and looking into weather a security is overbought or undersold, TA can be highly effective. I would be cautious when looking into any strategy not backed by math, or that involves symbols. I believe all investors should learn the skills of TA, but should use them in a realistic sense. I see far to many influencers talking about unrealistic strategies, and only showing their success's.
Have a great day everyone!

Enhanced Magic Formula for fundamental analysisThis is an experimental procedure based on fundamentals. Since, there isn't much option to backtest these methodologies, I am trying to create a trade and then measure performance over long period of time.
Magic Formula investing method is invented by Joel Greenblatt . In a nutshell strategy does following:
Rank all the stocks based on Return on Capital
Rank all the stocks based on Earning Yield
Add these ranks to come up with a combined rank.
Invest equally in first 10 stoscks of combined. Rebalance yearly.
Concept here is, earnings yield represents value whereas return on capital represents quality. Combining these two to get the stocks which have best of both.
More information on the methodology is present here: www.investopedia.com
Improved Method :
Since, tradingview does not allow comparing fundamentals or technicals of all stocks, I had to do this in python. Output report can be found here: docs.google.com
Basic Filtering of Stocks:
Basic filtering of stocks is done based on the methods as mentioned in quality screen indicator:
Since the financial data is taken from yahoo for generating report, some of the quality parameters are not included and there can be slight changes in the fundamental values present in tradingview. No other initial filtering is applied.
Derive ranks on several Value, Profitability, Growth and Cashflow parameters:
Value Parameters : P/E, P/S, P/B, P/C, P/FCF, PE-Forwarding, PEG Ratio
Profitability Parameters : ROA, ROE, ROI, GrossMargin, OperatingMargin, ProfitMargin
Growth and Momentum Parameters : Quarterly, Half Yearly and Yearly Performance, Upside Calculated from analyst valuation
Cashflow Parameters : Quick Ratio, Current Ratio, Debt to Equity, Long term Debt to Equity, Debt to Assets, Long term debt to assets.
Derive composite rank for Value, Profitability, Growth and Cashflow based on individual ranks:
For example, Add up all ranks of value parameter to come up with Value Score. And then sort value score in ascending order to get value rank
Derive combination ranks such as value/growth rank, value/profitability rank etc by similar method: Also create combined rank which considers all 4 ranks - value, profitability, growth and cashflow.
Sort the values based on combined rank to get top value/quality stocks - which represents lowest score.
Final stock selection consideration : Instead of picking first 10 stocks, I have picked stocks from different sectors thus sacrificing bit of Magic Formula edge. This is to avoid high concentration on single sector.
Final list of stocks selected:
SBSW - Basic Materials (Gold)
VALE - Basic Materials (Industrial Metals and Mining)
GOOG - Communication Services (Internet and Information)
CROX - Consumer Cyclical (Footwear and Accessories)
ENVA - Financial (Credit Services)
EVR - Financial (Capital Markets)
UTHR - Healthcare (Biotechnology)
LPX - Industrial (Building Products and Equipment)
TER - Technology (Semicondoctor Equipment & Materials)
AMAT - Technology (Semicondoctor Equipment & Materials)

Book Value Per Share - Is it outdated? Attached is my take on Book Value Per Share. Happy Thanksgiving to all Americans out there.
Stock Mentioned:
NASDAQ:BNGO
Best of luck traders,
Brayden

Understanding News ManipulationIt is crucial to understand the price action prior to a high impact news event.
Analysing the range to the left beforehand can help you determine what move is likely to come next.
In this example, we saw the price was driven down by the bears to stop out buyers, only to reverse immediately to the upside moments after the news had been released.
By studying and acquiring knowledge like this, you can predict market moves that are likely to come with fundamentals.
Find the liquidity and trade it, or be the liquidity.

The most important words you need to know in fundamentalsHello everyone 😃
Before we start to discuss, I would be glad if your share your opinion on this post and hit the like button if you enjoyed it !
What Is Fundamental Analysis?
Fundamental analysis (FA) is a method of measuring a security's intrinsic value by examining related economic and financial factors.
Fundamental analysts study anything that can affect the security's value, from macroeconomic factors such as the state of the economy and industry conditions to microeconomic factors like the effectiveness of the company's management.
The end goal is to arrive at a number that an investor can compare with a security's current price in order to see whether the security is undervalued or overvalued.
This method of stock analysis is considered to be in contrast to technical analysis, which forecasts the direction of prices through an analysis of historical market data such as price and volume.
Now you know what is fundamental analysis, But before you start to learn more about it, Its better to know the important words that authors use in their articles !
📚 On this Article you'll learn about 25 of them and we'll continue to post the other in next educational posts; It's easier for you to read and remember !
1. Assets: Capital that is frozen as in property, real estate or possession.
2. Bearish: The falling trend of assets and shares in markets.
3. Bonds: Governmental bonds that ensure a fixed rate of interest in often long
term investment.
4. Boycott: To protest by refusing to purchase from someone, or otherwise do
business with them. In international trade, a boycott most often takes the form of
refusal to import a country's goods.
5. Bribe: A payment made to a person, often a government official such as a
customs officer, to induce them to treat the payer favorably.
6. Broker's fee: The fee for a transaction charged by an intermediary in a
market, such as a bank in a foreign-exchange transaction.
7. Bubble economy: Term for an economy in which the presence of one or
more bubbles in its asset markets is a dominant feature of its performance.
8. Bubble: A rise in the price of an asset based not on the current or prospective
income that it provides but solely on expectations by market participants that the
price will rise in the future. When those expectations cease, the bubble bursts and
the price falls rapidly.
9. Budget deficit: The negative of the budget surplus; thus the excess of
expenditure over income.
10. Budget surplus: Refers in general to an excess of income over expenditure,
but usually refers specifically to the government budget, where it is the excess of
tax revenue over expenditure (including transfer and interest payments).
11. Bullish: A rising trend in the significant increase of funds and shares in the
stock market.
12. Capital: the large amount of money or investment.
13. Capital loss: The loss in value that the owner of an asset experiences when
the price of the asset falls, including when the currency in which the asset is
denominated depreciates. It contrasts with capital gain.
14. Cartel: An agreement among, or an organization of, suppliers of a product. A
group of firms that seeks to raise the price of a good by restricting its supply. The
term is usually used for international groups, especially involving state-owned firms
and/or governments.
15. Cash dividend: Cash distribution of earnings to stockholders, usually on a
quarterly basis.
16. Commodity: Could refer to any good, but in a trade context a commodity is
usually a raw material or primary product that enters into international trade, such
as metals (tin, manganese) or basic agricultural products (coffee, cocoa).
17. Compensation: whoever violates agreement rules must compensate other
countries by lowering tariffs or making other concessions, or be subject to
retaliation.
18. (CSR) Corporate social responsibility: The responsibilities that corporations
have to workers and their families, to consumers, to investors, and to the natural
environment.
19. Corporation: Form of business organization that is created as a distinct legal
person composed of one or more actual individuals or legal entities. Primary
advantages of a corporation include limited liability, ease of ownership, transfer,
and perpetual succession. A business form legally separate from its owners. Its
distinguishing features include limited liability, easy transfer of ownership,
unlimited life, and an ability to raise large sums of capital.
20. Decline: The falling of stocks or prices in the market.
21. Breakout: The breakout of a virus or the breakout of a war.
📚 There's a difference between this breakout with the breakout we call in chart analyzing !
22. Minutes: The report from a meeting. (minutes from Fed’s meeting will be
released)
23. Consolidate: The prices are reaching a plateau and becoming more stable.
(the prices are consolidating)
24. Stimulus measure: The government is giving the banks a stimulus measure
to be bailed out for the financial crisis.
25. Retreat: The management is retreating from their initial position to deduct
the salary of the workers. (it's an example of retreat)
📍 We'll continue this series of educational posts in next days, STAY TUNED and don't forget to follow this idea, So you'll be notified after I post the new one...
Hope you enjoyed the content I created, You can support us with your likes and comments 😉🙋🏼♂️
Have a good day!
@Helical_Trades

Trends in Technical Analysis 📈📈✨What are the trends in technical analysis and what is its application in digital currencies such as Bitcoin and other cryptocurrencies? In the second part of the tutorial, we will look at the trends.
The concept of trends is definitely one of the principles of technical analysis. All the tools that we will teach in the following are created from patterns, oscillators, support and resistance levels, indicators, and with the aim of helping to measure the price trend. Even if you have been in the market for a short time, you must have heard the words, "Trend is your friend", "Always trade in the direction of the trend", "Never fight the trend". These are common phrases that you often hear in the market. So we need to take the time to define the process and know its types.
Bitcoin price chart consists of uptrends, downtrends and neutrals
John Murphy describes the trend in her valuable book, Technical Analysis of Financial Markets:
The market never moves in a straight line. Market changes are characterized by a series of zigzag movements. We call these market zigzag movements. The result of the motion of these waves is TREND.
✨Classification of trends in technical analysis
▪️ Uptrend
The uptrend is defined as a series of ascending waves. Charles Dow defines an uptrend as follows: "When a price is higher on an uptrend than the previous uptrend, or when the price is on a downtrend above the previous uptrend, we have an uptrend." In other words, the uptrend is a pattern of upward fluctuations.
An uptrend indicates a greater power of demand or purchase over supply or sales, referred to as the "BULLISH market".
The uptrend in technical analysis is the result of several uptrends
▪️downward trend
The downtrend is formed as a series of downward waves. Charles Dow described the downtrend as exactly the opposite of what was said about the uptrend. This means that whenever the price is lower in a bearish wave than the previous bearish wave or the price is lower in a bullish wave than in the previous bullish wave, we have a bearish trend.
A downtrend indicates a greater supply or demand power over demand or a buy, a "bearish market".
The downtrend in technical analysis is the result of several downtrends
▪️ Range trend
The Range trend consists of a wave or waves of ascending and descending that have a direct direction. In other words, if the price can not go above the peak of the uptrend or the price can not go below the bottom of the downtrend, we have a Range trend.
A Range trend indicates a relative balance between buyer and seller power or market supply and demand. "Range market" refers to this trend.
The Range trend in technical analysis is the result of several neutral waves
✨So far, we have defined the concept of trends in financial markets. We may be trending in the market but we need another tool to confirm our diagnosis, trading volume is the tool we need. According to Dow, trading volume is a secondary but important factor in confirming warnings derived from price analysis.
In general, keep in mind that trading volume should be in line with the direction of the main trend.
In the uptrend; Each ascending wave is accompanied by an increase in volume and each descending wave is accompanied by a decrease in volume.
Trading volume should confirm an uptrend
In a downward trend; Each descending wave is accompanied by an increase in volume and each ascending wave is accompanied by a decrease in volume.
If you have any questions, comment for me🔥🔥

Ultimate Short Term Investment Methodology Hello, everyone!
As I can see, you like my series of articles about different coin’s trading plans. Today I’m glad to introduce the short methodology about how to choose the coins for short term investment. On the term “short term investing” I mean the trade with the duration from 1 to 5 months with the potential profit 3 to 6X from current price. Let’s go.
First of all you need to know that for short term investing you do not need to believe in project idea, just a big hype should be anticipated.
1 PRODUCT
The product is not the key point of my methodology. The best product is the blockchain because it is fundamental project, which can develop quickly in the future. Hype projects such as DeFi and NFTs are also allowed for our purpose. You should just avoid the scams and memecoins.
Good examples: DOT, NEO, FLM, ATOM, ADA
Bad examples: DOGE, SHIB, SAFEMOON, PRIZM
2 TEAM
For our aim this is the least important point. You can just check if the famous and successful people are creators of this project. It is an additional mark for the coin.
3 SOCIAL MEDIA
Check if the Twitter account is active or not, activity is high before the pump. The famous investor and other persons as the subscribers also is a good sign. Good and bad example see on the pic below.

How To Use Financial Ratios To Make Better DecisionsFinancial Ratios help you evaluate a company. Most financial ratios will show you how much money you're paying for a specific piece of the business. Let us give a few examples:
Price-to-Sales Ratio = Market Cap / Sales
The Price-To-Sales ratio or PS ratio tells you how expensive a company is relative to its total sales. The formula is calculated in two different ways: divide the company's market capitalization by its revenue or divide the current stock price by revenue-per-share. Because this ratio is being calculated with live price information, you can also watch it in real-time on the chart as we've shown in this example above.
If a company has a market cap of $10 billion and revenue of $1 billion, well that, that implies a PS ratio of 10. You're paying $10 for every $1 in sales. You can do ratios like this for all aspects of the company. For example, PE ratio or Price-To-Earnings ratio measures the Market Cap / Earnings. This tells you how much you're paying for every dollar of earnings.
Keep in mind that Financial Ratios are not perfect. They are also not a buy or sell recommendation. Instead they are shortcuts, ways to quickly evaluate a company, compare its underlying fundamentals, and study that company relative to other companies. You also must remember that financial metrics can change quickly with a single earnings report. A company's future expectations are also just as important. A company like Apple might have a high PE ratio, but if they're building and growing revenue into the future, their PE ratio could come down over time.
Remember, Financial Ratios and Financial metrics in general paint a picture of the underlying business and its earnings potential. Here are some other resources to get you started:
1. Read more about Financials on TradingView in our Help Center.
2. You can also code your own strategy or indicator using this financial information .
3. We've also created a library in our Help Center so you can learn more about every Financial metric.
Here are some other financial ratios that you may find interesting and how they're calculated:
PE Ratio = Market Cap / Earnings
PB Ratio = Market Cap / Book
PEG Ratio = PE / Earnings Growth
Quick Ratio = (Cash + Cash Equivalents + Current Receivables + Short Term Investments) / Current Liabilities
Dividend Yield = Dividends Per Share / Price
EV Multiple = Enterprise Value / EBITDA
To access all of the Financial Ratios available to you, click the Financials button at the top of your chart. From here, you can select many different Financial metrics and study markets at a deeper level.
More importantly, you can combine the study of Technical and Fundamental analysis at the same time. Meaning you can evaluate the fundamental side of the business including its earnings and valuation while ALSO studying price action and planning a trade.
Please feel free to share your feedback and comments below! Thank you for reading.

History of ForexHistory of Forex
We have come a long way from the previously practiced barter system to the modern-day system of trading currency. Following is a brief summary of the evolution of currency and how it gave rise to Forex Trading.
Here are the main stages that are illustrated on the chart:
1️⃣The Ancient system of Trading - Trading with Gold
As early as 6th century BC , the first gold coins were produced, and they acted as a currency because they had critical characteristics like portability, durability, divisibility, uniformity, limited supply and acceptability.
2️⃣Bank Notes Originated - Deposited Gold in banks in exchange for banknotes
3️⃣Role of Geography - Various banks of different regions printed different currencies
Gold Standard - Currency pegged to gold
In the 1800s countries adopted the gold standard. The gold standard guaranteed that the government would redeem any amount of paper money for its value in gold . This worked fine until World War I where European countries had to suspend the gold standard to print more money to pay for the war.
4️⃣Bretton Woods System - Currency pegged to USD
The first major transformation of the foreign exchange market, the Bretton Woods System, occurred toward the end of World War II.
The Bretton Woods Accord was established to create a stable environment by which global economies could restore themselves. It attempted this by creating an adjustable pegged foreign exchange market. An adjustable pegged exchange rate is an exchange rate policy whereby a currency is fixed to another currency. In this case, foreign countries would 'fix' their exchange rate to the US Dollar .
5️⃣Birth of Floating Currency - Currency that is not pegged to any assets or other currencies is known as a 'floating currency'.
And what will be next?
Very hard to say but blockchain technologies will make the system change again.

The importance of the STOPLOSS protective orderThe importance of the STOPLOSS protective order
Our protective stops are vital to managing our risk, and just a single position you open without a stop can lead to the suicide of your trading account.
The uniqueness of stop orders lies in the fact that they, being pending orders, await their execution at a predetermined price. When stop orders are triggered, their important function is that they add momentum to the market and at the same time use the liquidity present in the market.
1)
Many have probably heard such information as: "When entering a trade, place a protective stop just below the high / low of the price." The reason is that this level has been identified as an important support level .
What else is posted in the support area? Limit orders of traders to buy, who have identified the support area and are waiting for the time to open a position when retesting the level.
Is there a large number of stops under each level? It depends on the size of the timeframe and how quickly the price leaves the given zone at the time of purchase.
2)
When the price gets to this level, traders are still interested in long positions, but this time the price does not bounce off that level as one would expect. It does not break it, does not make lower lows, but displays lower highs.
If you were interested in going long right now, what would you do? The average trader who bounces off the support level would enter a long position with a stop just below the support level . If you had a limit order that hadn't been filled yet, I would have postponed the order.
Candlesticks / Bars displays lower highs; The price does not rise as fast as one might expect; You know that just below the support area there are a lot of stop orders.
3)
What happens next? The price moves downward under pressure and breaks the stops of traders who have long positions, and, as we remember, when buy stops are triggered, these are market sell orders, and they force the price to move further down.
And traders, who are waiting for the opening of short positions, open them because the price breaks the support level , but then the market takes them out, “eats” them, because the price goes higher.
4) Those traders who were initially set for long positions and who were thrown out of the market by broken stops help push the price up. Now the graph looks like this:
New stops are placed below the new level, in front of us is Groundhog Day. And everything that has just been played will be played over and over again ... only at different price levels.
STOPLOSS is a way to limit losses when managing an open trading position or portfolio of positions. In fact, a stop loss is an order to close a position in the event of an unfavorable price movement.
The trader sets a stop loss to limit his own losses and trade within his own money management rules.
Find me on:

Understanding Market StructureLets start
1) Consolidation
The market enters this phase after a strong movement. Sellers control buyers, which further leads to a downward trend
2) Down trend
Bearish phase - lower lows and lower highs. This is where traders want to go short on breakouts or from levels
3) Distribution
Occurs after a prolonged fall in prices, when buyers gain control of prices, resulting in higher prices
4) Up trend
The bull phase is where you want to be long. See to buy short breakout moves after long rallies have exhausted themselves. Attempts to rally are considered guilty until proven innocent
-------------------
Share your opinion in the comments and support the idea with likes.
Thank you for your support!
thankyou

What is impulse and how to make money on it?What is momentum and how to make money on it?
Momentum is a sharp paranormal price movement in one direction or another, unusual for average daily fluctuations of an asset
How to build zones from which impulse movement is most likely to occur?
1) The price is pushed back from the previously built level
2) There is an impulse movement in the other direction
3) Correction to the level, from which the price pushed a little
4) consolidation, consolidation below the level, from which there will be an impulse movement
How it works?
1) the level above which the price consolidates and repels
2) Rollback from the price level at the moment
3) Impulse that breaks the level
4) We need to extend the level to understand where the key point will be
5) Fixing the price below the level
6) In anticipation of an impulse movement, at the very beginning of the movement, after fixing, we open an order
*** Works in the same way in long
What do you need to do, what to earn on this?
1) If you use impulses not all in a row, but the very first one after a trend reversal, then we have a chance to pick up all the movements, it all depends on your benchmarks, where you exit the market, according to your strategies.
2) Not every impulse level is the first, we estimate the situation from strong levels, from which the price can reverse
3) We focus on the opening of the session, the chance that the market will reverse at the end of the working day and give you less profit if it is at the beginning.
It is important to understand:
Price moves from level to level
The price does not always fix directly below / above the level
You can work both on the younger (m5, m15, m30, h1, ch4) and on the higher timeframes (d1, b1, m1 )
The older the timeframe, the stronger the level from which an impulse can follow
During an impulse, funds are injected, a large player enters the market or a major player exits the market, stops-losses are collected, i.e. removal of market participants.
Our goal is to follow a major player who leads the price and get profit from it

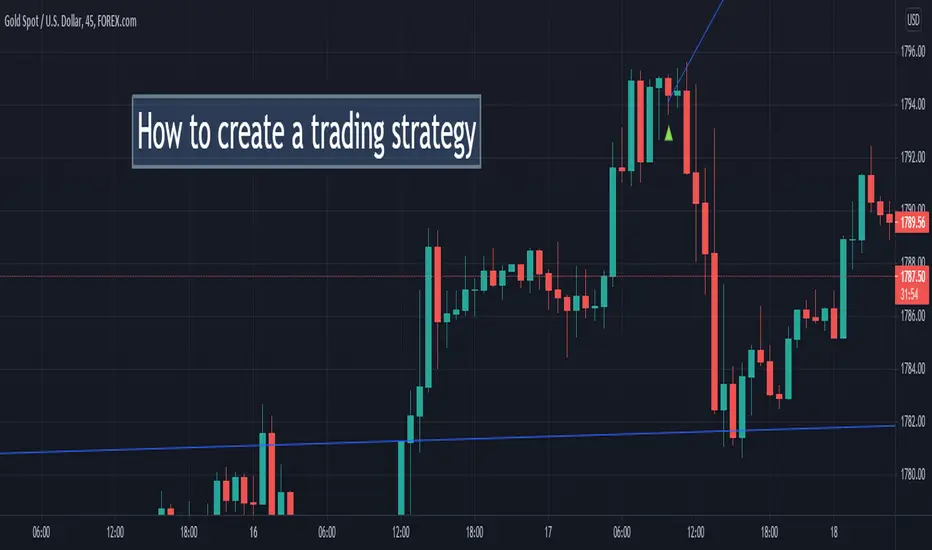
How to create a trading strategy?HOW TO CREATE A TRADING STRATEGY?
WHAT IS A TRADING STRATEGY?
Trading rules that systematize it, bring clarity, orderliness and predictability of the result. You can take a ready-made strategy and adapt it for yourself. And you can create your own
The main idea of the strategy, its rationale
The idea should be rational, based on market patterns that you understand. For example, trading with a trend or pullbacks. On technical or fundamental analysis , with or without indicators
A good trading strategy is not complicated, but simple. A large number of rules makes the strategy inconvenient and understandable for the trader himself.
Timing of trading
What timeframes do you want to trade on?
How much time are you willing to devote to trading?
What time will you trade?
Selection of trading instruments
Pick those tools. which you understand well
The strategy can be both universal (for many tools), and sharpened for specific toolsChoice of tools for analysis
1) When the main idea of the strategy emerged and it became clear how, when and what to trade, you need to decide on the tools of market analysis
2) If the strategy is indicator, then select indicators (from 2 to 5)
3) If the strategy is not indicator, then select patterns, figures of graphical analysis
4) If the strategy is based on fundamental analysis , then it is necessary to decide on which news to trade.
Trade entry rules
Under what conditions will you enter the market based on what signals?
When will you not open a trade?
What orders will you use market or pending?
Exit rules
Stop Loss and Take Profit
Under what conditions do you close a position?
How will you set stop loss and take profit?
Risk Management
Write down the risk per order, risk per day / week / month
(in percent or in currency)
Determine the maximum allowed number of losing trades
per day / week / month
Calculate the volume of a trading position (lot)
When there is a strategy, what's next?
Check the effectiveness of your strategy on the strategy tester or on a demo account
Maintain trade statistics to identify weaknesses of the strategy and remove them
Find me on:
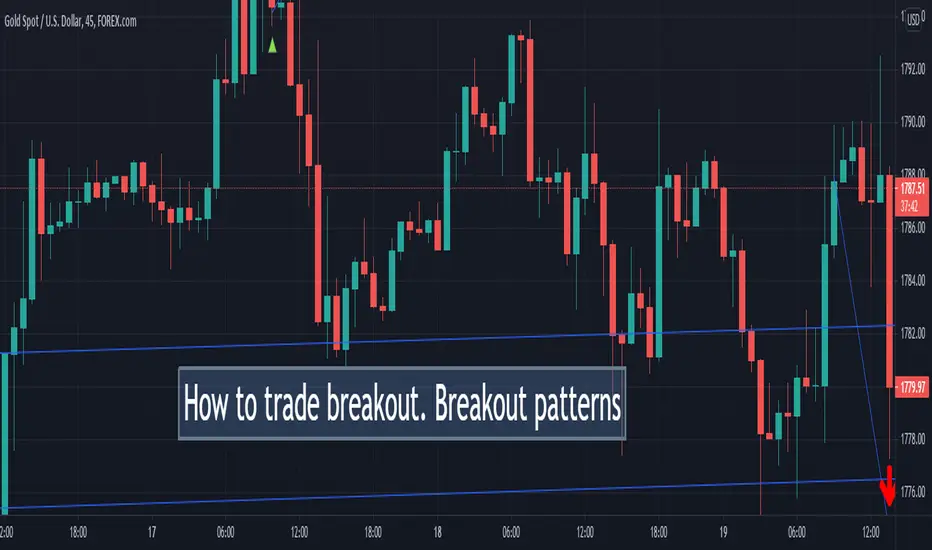
How to trade breakout Breakout patternsWhat is a level breakout? A large number of orders are located behind the level. Either this is a limit entry order
if the price overcomes the level, or it is a protective order - it is triggered if the price goes out of our way and
overcomes the protective zone in the form of a level
-------------------
Share your opinion in the comments and support the idea with Like.
Thanks for your support!
Gold: How to Combine Technical & Fundamental To Get Best ResultsWhat Does Market Really Follow?
We all know that market is normally run by based on Technical Analysis, Fundamental Analysis, and Trading Sentiment. If you want to get a high result on your trade, you must combine these 3 analyses.
As USD and Gold both are safe-haven currencies and reserve currencies as well. USD and Gold have a negative co-relation. If the USD rise, Gold will drop. If the USD drops Gold will rise.
Which Fundamental Factors Are Responsible for Golds Move?
1. US Economical Reports
2. World Wide Economic Conditions
3. Man-made or Natural Disaster (For the moment Covid Situations)
4. Political or Economic Crisis
5. Central Bank's Rate Decision and some other reasons.
What to Do Firstly?
You must have a look at US economic reports. US job Market Report, CPI, Manufacturing Reports, and FED economic Overview. If most of the fundamental reports are positive from the USA, that means fundamentally USD is in a good position, which means Gold has a chance to drop.
especially CPI / Inflation reports are important for hiking bank rates. So, if you see recent most of the high-impact reports are positive, that means gold has more chance that it will drop and FED is going to deliver the hawkish statement. FED's hawkish statement will give an extra benefit to USD what is negative for Gold.
What to Do Secondly
Now see your technical chart. A trading view has many awesome tools to draw your Technical Charts. Personally, I do follow pure price action. Based on your chart analysis, find an entry rate, exit rates, and where the stop loss and profit should be put. You can use any kind of technical tools, indicators of what is suitable for you.
What To Do Thirdly?
To get the trading sentiment, Option expiry and Cot reports will help you a lot. Especially cot reports are free, so check last cot reports. Day Traders usually follow non-Commercial contract positions. if you are a day trader checks a non-commercial contract. if most of the contracts are in a short mode, that means banks, hedge funds, and other financial authorities are selling more.
commercial contracts are also very important. because they are big guns and big companies. you should also check their position. Non-Reputable contracts are not really important.
How Will I Combine Technical and Fundamental Analysis and implement to my trade?
This is the final part. If you see most of the US economic reports are positive in recent months, especially job market reports, manufacturing reports, and Inflation reports. In this case, most of the time FED delivers a hawkish statement. So, you think for Buying USD and Sell Gold.
If you see US Economic reports are not supportive, then think about selling USD and buying Gold.
This is the first part. I will write details about it in my second part. till then keep reading.
If you think this article helped you then, like, comment, and share with your trader's community.

Learning the TradingView Platform: Exploring the Top Panel Pt.2In this video we will explore:
Indicators and Strategies
Fundamental metrics for stocks
Indicator Templates
If you would like to learn more about these items, check out the great material we have in the help center and on our blog. 📚 🤔 📚
Indicators
www.tradingview.com
Fundamentals
www.tradingview.com
www.tradingview.com
Indicator Templates
www.tradingview.com
Did you learn about anything new that you may use from now on?
Let us know in the comments below 👇 👇

Improve your Technical Analysis using Fundamental Analysis!In this video I decided to show you how to use Fundamental Analysis along with Technical Analysis in order to improve your understanding about the market.
Although it is not common, as most people seem to like Tradingview for its price charts/indicators, you can use this platform for fundamental analysis as well . In this video I explain the importance of looking at the fundamentals through a chart.
I hope you'll like the video! In this case, remember to support this idea, and follow me for more content like this.
Have a good week.
Fundamental Indicators used in this video:
- Price to Earnings;
- Net Margin (%);
- Return on Invested Capital (ROIC).

What Technological Progress?? ..."Across all fields of science and technology, we find that the rate of disruptive scientific work is declining."
comdig.unam.mx
The full paper;
arxiv.org
Here is a novel idea; Stop drinking the Coolaid!

The Dollar INFLATION? Part 2
(see link to Part 1 attached below)
Hello,Traders!
As we found out in Part 1,the FED and The Treasury added 5.3 Trillion dollars to the money supply, with 3 Trillion Dollars being spent, not invested and all that coming from borrowing, not taxes, which would have created price inflation even without the supply shock.
However, the supply side was also affected by the lockdowns, and below is a summary of how this happened!
First of all, we saw a massive structural change, with the demand suddenly shifting from services to goods , as the majority of the former became unavailable to the indoors bound population.
That additional demand for goods, would have strained the supply chain in any scenario, but several factors made it much much worse.
First, the lockdowns in China, especially Wohan, a major logistics hub, brought some of the manufacturing and shipping to a halt, that led to the initial shortages, but the demand fell sharply too, so at first, the two canceled each other out. Then with China opening up at the end of 2020 faster than any other country, and the demand picking up in the US and other countries , China started shipping Covid-19 supplies and other goods to the rest of the world.
But as manufacturing in China recovered , the United States were locked down, which affected two major ports in the US : the ports of Los Angeles and Long Beach. The thing is that 41% of all the US container traffic goes through just these two, and while the container traffic went up by 49%, the ports were operating at lower capacity , due to the dock workers either being sick with Covid, or being in quarantine.
Loaded Ships were stranded for weeks , waiting to be unloaded, doubling the shipping time. As if that wasn’t enough, the shipping containers price went from 1800$ to 3500$ , because due to the lockdowns in the US there wasn’t much to be shipped back to China, and for every 100 containers that went in, only 40 were exported back . The ports operating at lower capacity didn’t have the resources to load empty containers onto the ships going back to China, and the truck drivers shortage lead to that the empty containers weren’t returned back to the ports, from inside the US.
This led to a vicious cycle: shortage of shipping containers was worsening the shortage of shipping capacity, which was worsened by the shortage of port capacity, which in turn was worsening the shortage of shipping containers, which as in turn worsened by the shortage of truck drivers which worsened the shortage of goods.
All that led to scarcity exacerbated by the debt funded, non-investment consumer spending, and worsened by a demand shifting from services to goods.A perfect storm situation, which nearly collapsed the «Just-in-Time» manufacturing based supply chains.
All that led to the official FED inflation figures for April 2021 being 4.2% , which is A LOT! And more is to come, if the lockdowns are not lifted, and, especially,if Biden's 6 Trillion budget gets passed.
Please, Like comment and subscribe!

Types of Market Analysis (Foundation level of Technical Analysi)Reviewing the 3 Types of market analysis (Foundation level of Technical Analysis)
Technical Analysis
Fundamental Analysis
Market Sentiment
