Advanced ORB Strategy with Filters & TargetsThe Advanced ORB (Opening Range Breakout) Strategy I created is a sophisticated intraday trading system designed for TradingView, optimized for the US stock market open at 9:30 AM ET (New York time). It builds on the classic ORB concept—identifying the high (ORH) and low (ORL) of the initial market range after open and trading breakouts from those levels—while incorporating multiple layers of confirmation, risk management, and visual aids to filter out noise and capture high-probability momentum moves. This makes it more robust than basic ORB setups, aiming for higher profitability by reducing false signals and adapting to market conditions.
Core Concept
Opening Range Definition: The strategy uses the first 15 minutes (9:30–9:45 AM ET) as the primary opening range to establish ORH, ORL, and the midpoint (ORM). This window captures the initial volatility spike from overnight news, earnings, or economic data. You can optionally enable a secondary 5-minute range (9:30–9:35 AM) for added confirmation, requiring a breakout from both ranges.
Breakout Logic:
Long Entry: Triggered when price closes above ORH post-range, confirmed by filters (detailed below). This signals upward momentum.
Short Entry: Mirror for closes below ORL, indicating downward pressure.
Why 9:30 AM ET?: This aligns with the NYSE/NASDAQ open, where volume surges and institutional activity often lead to trend days (sustained moves). Statistically, about 30% of days are trend days, and ORB excels here by riding the breakout.
Key Advanced Features and Filters
To elevate it from a simple breakout strategy, I integrated multi-factor validation to avoid whipsaws (false breakouts common in choppy markets):
Candle Strength Filter: Requires the breakout candle to have a body >50% of the range width and wicks < body size, ensuring strong conviction (no doji-like indecision).
Volume Confirmation: Breakout volume must exceed 1.5x the 20-period average, verifying institutional interest.
Minimum Breakout Distance: At least 0.3% beyond ORH/ORL to ignore minor wick pierces.
Trend Alignment: Price must be above a 100-period EMA for longs (or below for shorts), favoring with-trend trades.
RSI Filter: RSI(14) <70 for longs (>30 for shorts) to avoid overbought/oversold traps.
Daily Bias: Compares today's ORM to yesterday's ORH/ORL; only longs if bullish overlap, shorts if bearish, skipping neutral days.
Secondary Range Layer: If enabled, breakout must also clear the 5-min range, adding confluence.
These filters collectively reduce trade frequency (focusing on quality) while aiming for a win rate >50% and risk-reward >2:1.
Risk Management and Exits
Stop-Loss: Placed at ORL (for longs) or ORH (for shorts), buffered by 1x ATR(14) for volatility adjustment. ORM can be used for tighter stops in ranging markets.
Take-Profit Targets: Scaled exits for profitability:
Target 1: 1x range width (e.g., ORH + (ORH - ORL)).
Target Fib: 1.618x Fibonacci extension.
Target 2: 2x range width.
Suggestion: Exit 50% at Target 1, trail the rest using a session EMA or 50% range retracement invalidation.
Position Sizing: Risk 1% of account per trade based on stop distance.
Additional Exits: Close all at 4:00 PM ET (market close) or if price retraces >50% of the range. A 30-min cooldown prevents re-entries after a signal.
Visuals and Implementation on TradingView
Plots: Green ORH, red ORL, orange ORM lines; optional clouds (green upper half, red lower) for the range.
Secondary Visuals: Dashed lime/maroon lines for the 5-min range (if enabled).
Signals: Green up-triangle for long breakouts, red down-triangle for shorts.
Targets/Stops: Horizontal lines extend from signals for targets (green/blue) and stops (dashed red).
Alerts: Built-in for breakouts, integrable with TradingView notifications.
Pine Script: The code is a custom indicator (convertible to strategy for backtesting). Use on 1-5 min charts for indices like SPY/QQQ or volatile stocks. Backtest via TradingView's Strategy Tester to optimize inputs.
What Works Best with This Strategy
Complementary Indicators:
EMAs (100/200-period): For broader trend confirmation.
Volume tools (e.g., VWAP or oscillators): Enhance volume filter.
Market internals ( USI:TICK , USI:ADD ): Gauge overall sentiment.
ATR/VWAP: Dynamic stops and volatility skips (e.g., ignore narrow ranges < average ATR).
Assets: High-liquidity, volatile ones like QQQ, SPY, or futures (ES/NQ). Avoid low-volume stocks.
Timeframes: 1-5 min for entries, daily for bias.
Market Conditions: Thrives on trend days with gaps/news; skip low-volatility or holiday sessions.
Why It's a High-Profitable Strategy
ORB's edge comes from exploiting post-open volatility, where 70-80% of daily range forms in the first hour. By adding filters, it cuts false breakouts (common in 50-60% of basic ORB trades) while targeting 2-3R rewards on winners. Backtests often show 1.5-2.5 profit factor on indices, with drawdowns <10% if risked properly. Profitability stems from:
Edge in Momentum: Captures "big moves" on trend days.
Risk Control: ATR-adapted stops and scaled exits preserve capital.
Adaptability: Customizable (e.g., range duration, filters) for different markets.
Psychological Fit: Mechanical signals reduce emotion, ideal for day traders.
Concept

BTC as % of Global M2 (Signals)Pine Script draws from recent approaches in the community for using Bitcoin market cap as a percentage of global M2 money supply to generate buy/sell signals, largely mirroring systems described in recent open-source TradingView scripts.
Key logic and features:
The script calculates the YoY global M2 growth rate and the distance of Bitcoin’s market cap % of M2 above/below its moving average.
Buy signal: Triggers when YoY M2 growth exceeds a threshold (default: 2.5%) while Bitcoin’s % is below its SMA, suggesting BTC is undervalued in a supportive macro environment.
Sell signal: Triggers if Bitcoin’s % of M2 exceeds its SMA by more than the defined extension threshold (default: 0.7), indicating overextension.
Your script’s improvements vs. community versions:
Extensive M2 breakdown: You aggregate M2 data from more countries/regions than typical community scripts, which usually focus on major economies only.
User parameterization: All critical values (signal cooldown, thresholds, averaging period) are configurable via inputs, enhancing usability and replicability.
Signal throttling: The ‘lead’ parameter (signal cooldown) ensures repeated buy/sell signals do not fire too frequently, making the indicator practical for swing trading.
General methodology context:
Community scripts, such as BTC"s % Global M2 signal" and "Global M2 by Colin Talks Crypto," use similar approaches. The buy/sell rules, thresholds, and smoothing windows are well-documented, and scripts are often open source so you can compare implementations or adapt further to your trading preferences

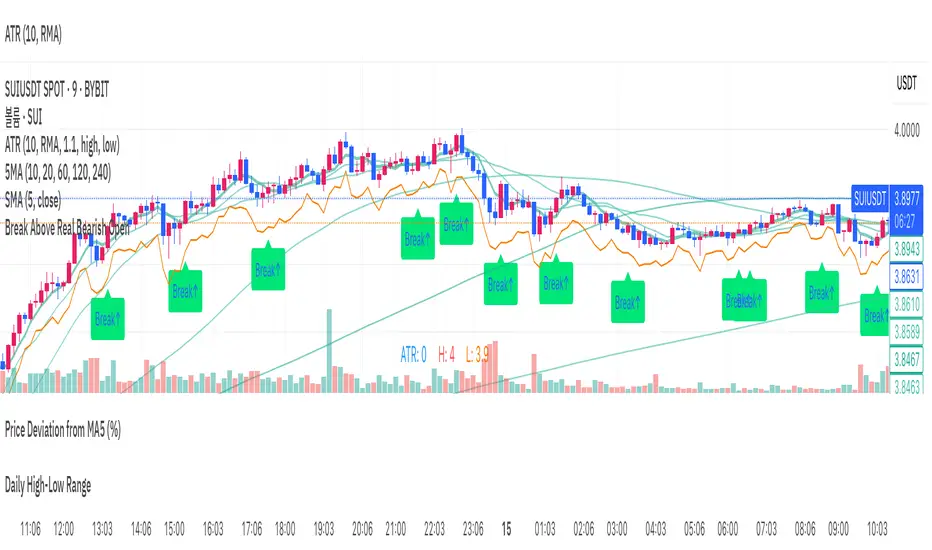
Break Above Real Bearish Open// This indicator is designed to help identify precise intraday entry points on lower timeframes.
// It tracks the most recent valid bearish candle—defined as a red candle whose close is lower than the low of the most recent bullish candle.
// When the price breaks above the open of that bearish candle with a bullish candle, a "Break↑" signal is shown.
// Minor pullback candles within uptrends are filtered out to reduce noise.
// The alert only triggers once per valid bearish setup, avoiding redundant signals.
// Ideal for detecting breakout opportunities after pullbacks in intraday trending markets.
// 이 인디케이터는 장중 분봉 기준에서 정밀한 진입 타이밍을 포착하는 데 도움을 줍니다.
// 최근 형성된 유효한 음봉(가장 최근 양봉의 저가보다 종가가 낮은 음봉)을 추적하며,
// 해당 음봉의 시가를 돌파하는 양봉이 등장할 경우, "Break↑" 신호를 차트에 표시합니다.
// 상승 중의 사소한 눌림 음봉은 자동으로 걸러내어 노이즈를 최소화합니다.
// 하나의 음봉에 대해 알림은 단 한 번만 발생하며, 중복되지 않도록 설계되어 있습니다.
// 분봉 흐름 속 눌림목 이후 돌파 구간을 자동으로 포착하고자 할 때 유용하게 활용할 수 있습니다.
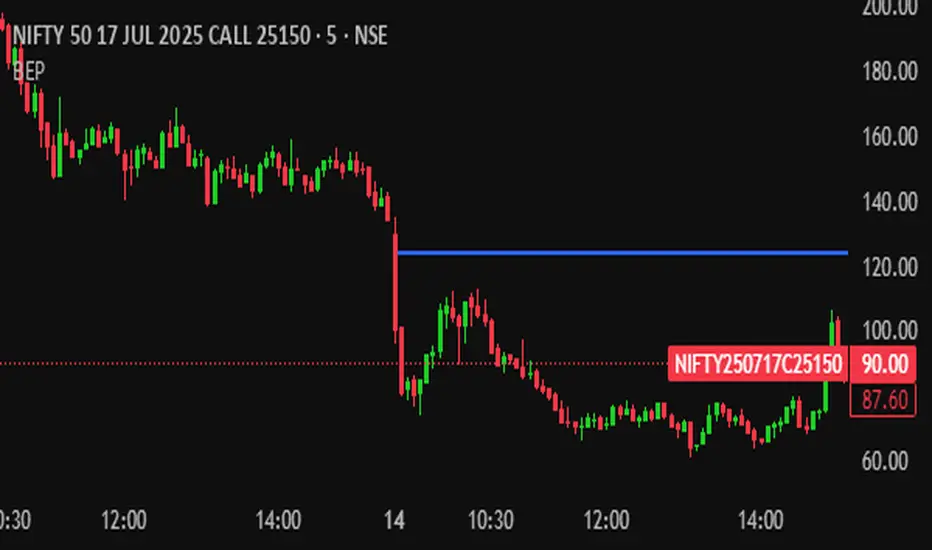
BEPthis Indicator automatically draw Bep line in premium charts #Education_Purpose Only#NIFTY50 Option trading
Ralph Indicator - ZaraTrust Smart MoneyThe Ralph Indicator – ZaraTrust Smart Money is a powerful yet simple Smart Money Concepts (SMC) based tool designed for traders who want to trade like institutions. It auto-detects high-probability Buy/Sell zones, Support/Resistance levels, and Demand/Supply areas on the chart — giving you clear, visual, and actionable signals without the clutter.
⸻
🔍 Key Features:
✅ Smart Money Structure
• Uses pivot-based logic to identify potential structure points
• Helps you understand market flow (e.g., BOS, CHoCH simplified logic)
✅ Automatic Support & Resistance
• Plots major levels based on significant highs and lows
• Helps catch key reversal or breakout zones
✅ Demand & Supply Zones
• Visually shows areas where price may react strongly
• Based on smart pivot detection from recent swings
✅ Buy/Sell Trade Signals
• Highlights buy when price breaks resistance (possible bullish shift)
• Highlights sell when price breaks support (possible bearish shift)
✅ Clean & Easy UI
• Toggle features on/off from settings panel
• Labels and shapes are plotted clearly on the chart for instant reading
⸻
🛠️ Recommended Use:
• Use on 15min to 4H timeframe for intraday or swing trading
• Combine with price action (e.g., confirmation candles, liquidity grab)
• Works best when paired with institutional logic (OBs, FVG, liquidity)
⸻
⚠️ Disclaimer:
This indicator is a tool, not a signal service.
It does not guarantee 98% accuracy, but it’s designed to highlight smart money zones and high-probability areas. Always do your own risk management and backtest before using on a live account.

Major League Pro IndicatorUna estrategia la cual llevo annos utilizando la cuel me daa muy buenas oportunidades

Harami After OB/FVG Mitigationupdated harami candlestick pattern provided to plot signals when the OB. and FVG are mitigated

Harami After OB/FVG Mitigationmy strategy with the OB. FVG mitigation and plotting a harami candlestick pattern for possible trade idea
please confirm with the strategy guidelines please

TrustFX Sniper Zones – SMC Based📌 TrustFX SINIPER ZOZE SMC – Precision Smart Money Concept Tool
Unlock sniper-level precision in your trading with the TrustFX SINIPER ZOZE SMC indicator. Designed for both intraday and swing traders, this tool auto-detects Break of Structure (BOS), CHoCH, Order Blocks, Premium & Discount Zones, and delivers clean, real-time market structure analysis.
✅ Smart Money Concept (SMC) Based
✅ Break of Structure (BOS) & Change of Character (CHoCH)
✅ Automatic Order Block Detection
✅ Liquidity Zones & Mitigation Levels
✅ Entry/Exit Optimization Zones
✅ Perfect for Scalping, Day Trading & Swing Strategies
This is your edge to stay one step ahead of the market – spot institutional footprints, avoid retail traps, and execute with confidence.
🔍 Built for precision. Designed for results. Powered by TrustFX.

Nifty + BankNifty Dashboard [BY UKT]This indicator displays a compact and dynamic dashboard for NIFTY and BANKNIFTY indices using daily data.
It includes configurable columns for Open, High, Low, Close, Net Change, and % Change, updated in real-time.
Key Features:
✅ Live daily data for Nifty and BankNifty
✅ Clean visual table with conditional color coding
✅ User-controlled visibility for each data column
✅ Ideal for intraday traders tracking index momentum
Code is protected and shared only on an invite-only basis.
For access, please contact @UKT on TradingView.

ICT All in One by GtraderICT All-in-One by GTrader – Description
This indicator is designed for traders who follow ICT or Smart Money Concepts. It helps you visualize key market sessions, time-based price levels, and structured macro behaviors in one clean and customizable tool.
The Killzone feature automatically draws session boxes for Asia, London, and New York (including AM, Lunch, and PM sessions). Each box can show the session name, high and low pivots, and can be customized with different colors, transparency levels, and labels.
You can also add horizontal lines at important times like the daily open or New York open. Up to five session open lines can be defined, each with customizable styles, colors, and optional text labels.
In addition, the indicator lets you display vertical time markers. These lines help you track key intraday moments such as killzone entries or important session changes. You can enable up to four of these, each with its own settings.
One of the most powerful features is the macro session tracker. This creates boxes during specific time windows where price action is monitored. It automatically draws the top and bottom price levels during that session and updates them live. It supports up to five macros and works best on lower timeframes like 1-minute, 3-minute, and 5-minute charts.
The entire script respects your selected timezone, so all sessions and times are adjusted accordingly. Everything is customizable—from label sizes and colors to how many days of drawings are shown on your chart.
This script is ideal for traders who rely on time-of-day behavior, structured price action, and ICT methodologies.

Dynamic SL/TP Levels (ATR or Fixed %)This indicator, "Dynamic SL/TP Levels (ATR or Fixed %)", is designed to help traders visualize potential stop loss (SL) and take profit (TP) levels for both long and short positions, refreshing dynamically on each new bar. It assumes entry at the current bar's close price and uses a fixed 1:2 risk-reward ratio (TP is twice the distance of SL in the profit direction). Levels are displayed in a compact table in the chart pane for easy reference, without cluttering the main chart with lines.
Key Features:
Calculation Modes:
ATR-Based (Dynamic): SL distance is derived from the Average True Range (ATR) multiplied by a user-defined factor (default 1.5x). This adapts to the asset's volatility, providing breathing room based on recent price movements.
Fixed Percentage: SL is set as a direct percentage of the current close price (default 0.5%), offering consistent gaps regardless of volatility.
Long and Short Support: Calculates and shows SL/TP for longs (SL below close, TP above) and shorts (SL above close, TP below), with toggles to hide/show each.
Real-Time Updates: Levels recalculate every bar, making them readily available for entry decisions in your trading system.
Display: Outputs to a table in the top-right pane, showing precise values formatted to the asset's tick size (e.g., full decimal places for crypto).
How to Use:
Add the indicator to your chart via TradingView's Pine Editor or library.
Adjust settings:
Toggle "Use ATR?" on/off to switch modes.
Set "ATR Length" (default 14) and "ATR Multiplier for SL" for dynamic mode.
Set "Fixed SL %" for percentage mode.
Enable/disable "Show Long Levels" or "Show Short Levels" as needed.
Interpret the table: Use the displayed SL/TP values when your strategy signals an entry. For risk management, combine with position sizing (e.g., risk 1% of account per trade based on SL distance).
Example: On a volatile asset like BTC, ATR mode might set a wider SL for realism; on stable pairs, fixed % ensures predictability.
This tool promotes disciplined trading by tying levels to price action or fixed rules, but it's not financial advice—always backtest and use with your full strategy. Feedback welcome!

AshishBediSPLThis tool, called "AshishBediSPL," is a special indicator for traders using TradingView. Its main purpose is to help you track and trade the combined price of a Call and a Put option at the same strike price, a strategy known as a Short Straddle.
What It Does:
Tracks Straddle Prices: You can select a specific Indian index or a stock like Reliance, choose a strike price and expiry date, and the indicator will show you the combined price of that Call and Put option as a single line on your chart.
Calculates Everything for You: You don't need to manually add the prices. The indicator automatically does the math to show you the total premium of the straddle.
Adds Trading Signals: You can turn on various popular trading tools (like VWAP, EMA, Supertrend, etc.). The indicator will then use these tools to automatically show "Buy" and "Sell" signals directly on the chart, helping you decide when to enter or exit a trade.
Customizable: You can choose which trading tools you want to use and adjust their settings to fit your personal trading style.
What is it Used For?
This indicator is specifically for traders who:
Trade a Short Straddle: This is a neutral options strategy where you expect the market to stay in a small range. The indicator helps you monitor the total premium you've collected.
Want to Simplify Analysis: Instead of looking at a Call chart and a Put chart separately, this tool combines them into one easy-to-read chart.
Use Technical Analysis: It helps you apply standard technical indicators directly to the combined premium price, giving you clear signals for your straddle trades.

Target Trend v1.0 [MkTrade]Target Trend is an intelligent trend indicator that automatically detects the trend direction and displays key levels on the chart: entry, stop, and up to 3 target (take-profit) levels.
🧠 How It Works:
The indicator uses moving averages and an adapted ATR to:
📈 Detect uptrends or downtrends;
🔄 Identify change of character (CHoCH) trend shifts;
🎯 Plot entry, stop-loss, and take-profit levels in the direction of the trend;
🧱 Visually display these levels with lines and labels on the chart;
✅ Mark targets hit and stop-outs with a checkmark or cross icon.
⚙️ Settings:
Trend Length – moving average period (default is 10);
Set Targets – additional multiplier for target levels;
All targets are dynamically calculated using volatility (ATR 200).
🔔 Alerts:
The indicator detects and supports alerts for:
Trend reversals (up/down),
Target (TP) hits,
Stop-loss activation.
You can enable these in the TradingView Alerts Panel.
✅ Benefits:
Fully automatic – no manual drawing required;
Convenient – all key levels are visualized directly on the chart;
Flexible – can be adapted to any strategy;
Clear visuals – clean interface with intuitive colors.
📋 How to Use:
Add the indicator to your chart;
Wait for a trend reversal signal (triangle + colored candle);
Enter at the current candle (Entry line);
Monitor price reaching T1–T3 or stop level;
Use alerts for automation if needed.
Target Trend — это интеллектуальный трендовый индикатор, который автоматически определяет направление тренда и отображает ключевые уровни: вход, стоп и до 3-х целей (тейков) на графике.
🧠 Как работает:
Индикатор использует скользящие средние и адаптированный ATR для:
📈 Определения восходящего или нисходящего тренда;
🔄 Определения моментов смены тренда (CHoCH);
🎯 Построения уровней входа, стоп-лосса и тейков в направлении тренда;
🧱 Отображения целей в виде уровней и меток на графике;
✅ Отмечает достигнутые цели и срабатывание стопа (визуально — галочкой и крестиком).
⚙️ Настройки:
Trend Length — длина скользящей средней (по умолчанию 10);
Set Targets — дополнительный множитель для расчёта тейков;
Все цели рассчитываются динамически с учётом волатильности (ATR 200).
🔔 Алерты:
Индикатор распознаёт сигналы на:
смену тренда (вверх/вниз),
достижение целей (тейков),
срабатывание стопа.
Можно включить в окне алертов TradingView.
✅ Преимущества:
Полностью автоматический: не требует ручной разметки.
Удобство: уровни и цели отображаются прямо на графике.
Гибкость: можно адаптировать под любую стратегию.
Визуальная ясность: приятные цвета, чистый интерфейс.
📋 Как использовать:
Добавь индикатор на график.
Дождись сигнала смены тренда (треугольник и свеча с цветом тренда).
Вход осуществляется на текущем баре (линия Entry).
Следи за достижением целей T1–T3 или стопа.
Можно использовать алерты для автоматизации.
Переведи на английский

Dex Stoch RSI + WaveTrend Dots [Enhanced]Wave indicator with RSI and dots signaling. dots signals when its over bought or over sold but it also follows the rsi trend when bullish or bearish momentum is coming.

FVG Strategy [algo ] - 0.10% TP/SL📈 FVG Strategy Algo-Based] – 0.10% TP/SL
This strategy is based on Fair Value Gaps (FVGs), inspired by Smart Money Concepts (SMC) and institutional price inefficiencies.
✅ How It Works:
Bullish FVG: A long entry is triggered when the price re-enters a bullish FVG zone.
Bearish FVG: A short entry is triggered when the price re-enters a bearish FVG zone.
Stop Loss: Set at 0.10% below (long) or above (short) the entry price.
Take Profit: Set at 0.10% above (long) or below (short) the entry price.
This setup is ideal for scalpers and algo traders looking to capitalize on micro-imbalances with very tight risk control.
⚙️ Strategy Inputs:
🔹 Timeframe selection
🔹 Optional threshold filter for gap size
🔹 No repainting logic
🔹 0.10% fixed SL & TP for every trade
📊 Best Use:
Lower timeframes (1m, 3m, 5m)
Trending or volatile markets
Combine with trend filters for higher accuracy


Gas Futures SpreadClick Add chart , then Publish indicator , on the open old page select Publish new script , write any description and click Continue , then select Private script , Visibility Open and click the Publish private script button

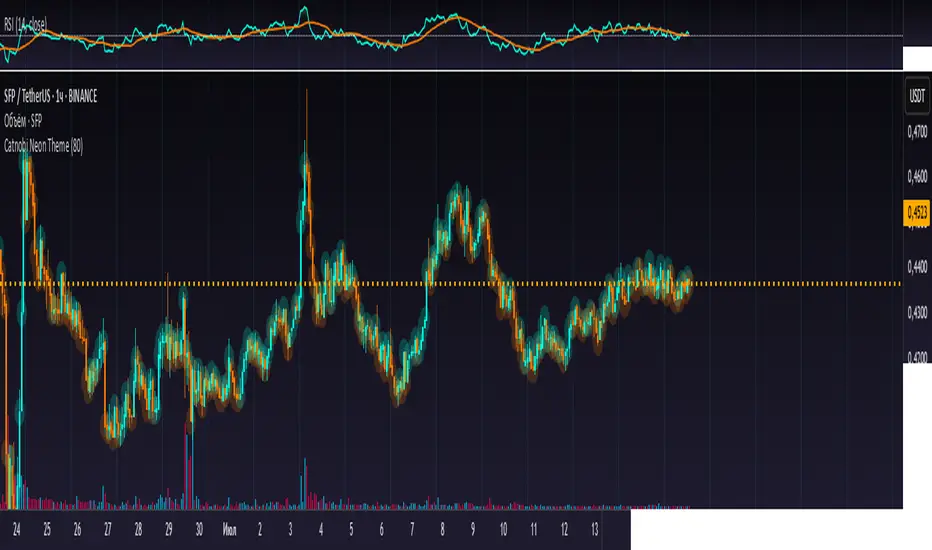
Catnobi Neon ThemeCatnobi Neon Theme 80 — A Purely Visual Candle-Glow Overlay (Open-Source)
What the script does
Catnobi Neon Theme 80 swaps the regular candle view for a vivid neon-glow style:
Candles (body + wicks) show up in bright turquoise when the bar closes up and in bright amber when it closes down.
Glow halo A soft, semi-transparent outline surrounds every candle, giving the impression of neon light.
Volume histogram Bars use the same palette as the candles so the entire chart keeps a consistent, cyber-punk colour scheme.
The script contains no trading signals, alerts, or calculations—it is purely decorative.
How it works (high-level)
Dual plot() technique – Each candle is drawn twice:
an enlarged, low-opacity outline creates the halo;
a second, normal-width layer renders the actual candle.
plotcandle() core – Price is still displayed with Pine’s built-in candle plotting, so the visual effect never distorts OHLC values.
Volume overlay – A simple plot() of volume with the same colour map keeps chart styling unified.
Because only basic Pine primitives are used, the script is light on resources and responsive even on lower-end machines.
Inputs / Settings
Input name Purpose Range / type Default
Theme Pick one of five curated colour sets 1 – 5 3
Glow width Thickness of the halo line (pixels) 1 – 10 4 px
Glow opacity Halo transparency 0 – 100 % 70 %
Hide volume Toggle neon volume bars true/false false
All colours are defined in HSL space, so you can easily tweak hues without losing contrast.
How to use it
Switch to a dark chart background – The glow effect is optimised for dark hex #0e0e0e, but any dark theme works.
Add Catnobi Neon Theme 80 as an overlay indicator.
(Optional) Hide the native candles via Chart settings ▸ Symbol ▸ Bar color opacity = 0 %.
Experiment with Theme, Glow width, and Glow opacity until the style matches your preference.
Why it qualifies for publication
Open-source – Code is fully visible, so the script does not fall under the “closed-source needs unique logic” rule.
Originality is visual, not trading – There are many indicator strategies, but very few lightweight, purely aesthetic glow overlays that rely solely on stock Pine functions.
Clear description – Users know exactly what to expect (no hidden buy/sell logic) and how the glow is generated.
MIT License
This script is released under the MIT licence. Feel free to fork, adapt, or redistribute—just keep the original author attribution somewhere in your code header.
The script is intended for traders who enjoy a cyber-punk vibe on their charts without compromising clarity or performance. Happy glowing!
Resistance Break With AlertPrevious Day Highest Body & Alert (Bursa Malaysia Strategy)
This indicator is specifically designed for the Bursa Malaysia market to help you track an important price level from the previous trading day.
How it works:
It automatically finds the highest "body" (the range between Open and Close) of any 15-minute candle from the previous Bursa Malaysia trading day, specifically within the 2:30 PM to 5:00 PM Malaysia Time (UTC+8) window.
What it shows:
A horizontal yellow line is drawn at that identified highest body level, extending for 12 candles into the future on your current chart.
Alerts:
You'll receive an alert (default message: "SNR Dah Pecah oiii") as soon as the current candle's closing price moves above this yellow line, helping you spot potential breakouts or key level confirmations.
Customization:
You can easily adjust the line's color (default yellow), width, and style, as well as enable/disable the alert and change its message directly from the indicator settings.

ARSI – (VWAP & ATR) 3QKRAKThe ARSI Long & Short – Dynamic Risk Sizing (VWAP & ATR) indicator combines three core components—an adjusted RSI oscillator (ARSI), Volume‐Weighted Average Price (VWAP), and Average True Range (ATR)—so that entry/exit signals and position sizing are always tailored to current market conditions. ARSI, plotted from 0 to 100 with clearly marked overbought and oversold zones, is the primary signal driver: when ARSI falls below the lower threshold it indicates an excessive sell‐off and flags a long opportunity, whereas a break above the upper threshold signals overextended gains and foreshadows a short. A midpoint line at 50 can serve as an early exit or reduction signal when crossed against your position.
VWAP, showing the volume‐weighted average price over the chosen period, acts as a trend filter—long trades are only taken when price sits above VWAP, and shorts only when it’s below—ensuring each trade aligns with the prevailing market momentum. ATR measures current volatility and is used both to set safe stop‐loss levels and to dynamically size each position. In practice, this means positions automatically shrink in high‐volatility environments and grow in quieter markets, all while risking a fixed percentage of your capital.
Everything appears on a single chart: the ARSI pane below the price window with its reference levels; VWAP overlaid on the price; and the ATR‐based stop‐loss distances graphically displayed. Traders thus get a comprehensive, at-a-glance view of entries, exits, trend confirmation, and exactly how large a position they can safely take. The indicator runs in real time, removing the need for manual parameter calculations and letting you focus on strategic decision-making.

Thursday High & Friday Low Breakout (Safe)This TradingView Pine Script indicator is designed to help traders visually track two key situational breakout patterns that occur across the Thursday–Monday trading window. Specifically, it detects:
Whether the high of Thursday has been taken out on Friday, and
Whether the low of Friday has been breached on Monday.
These conditions are based on commonly observed market behaviors where key highs and lows from the previous days often act as liquidity targets or decision points. By identifying these events, traders can better understand the unfolding market structure and anticipate potential follow-through or reversals.
The script stores Thursday's high and Friday's low at the close of each respective day and evaluates the breakout conditions in real-time as new bars are printed. When Friday’s price action exceeds Thursday’s high, an upward-pointing green triangle is plotted above the bar. Conversely, when Monday’s price breaks below Friday’s low, a red downward triangle is plotted below the bar.
Unlike scripts that rely on label.new (which can create compatibility issues on certain platforms or versions), this version uses plotshape() to ensure wide compatibility and reliable visual cues, even on older Pine Script environments. This makes it lightweight, robust, and ideal for traders who want a quick-glance tool without cluttering their charts.
The indicator is best used on 1H, 4H, or daily timeframes to clearly observe the Thursday–Friday–Monday structure. It works well in both trending and consolidating markets as a tool to mark potential liquidity sweeps or break-of-structure setups.

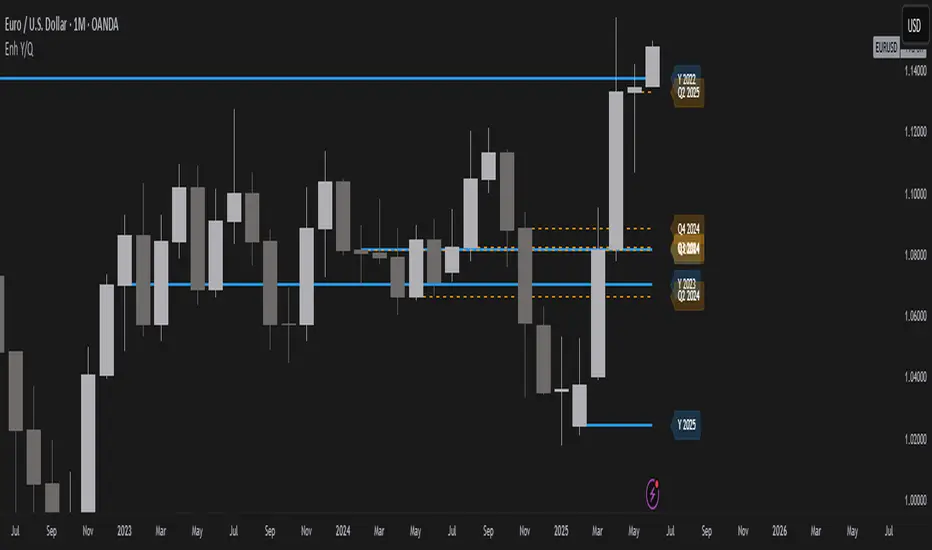
Year/Quarter Open LevelsDeveloped by ADEL CEZAR and inspired by insights from ERDAL Y, this indicator is designed to give traders a clear edge by automatically plotting the Yearly Open and Quarterly Open levels — two of the most critical institutional reference points in price action.
These levels often act as magnets for liquidity, bias confirmation zones, and support/resistance pivots on higher timeframes. With customizable settings, you can display multiple past opens, fine-tune label positions, and align your strategy with high-timeframe structure — all in a lightweight, non-intrusive design.
If you follow Smart Money Concepts (SMC), ICT models, or build confluence using HTF structures and range theory, this script will integrate seamlessly into your workflow.