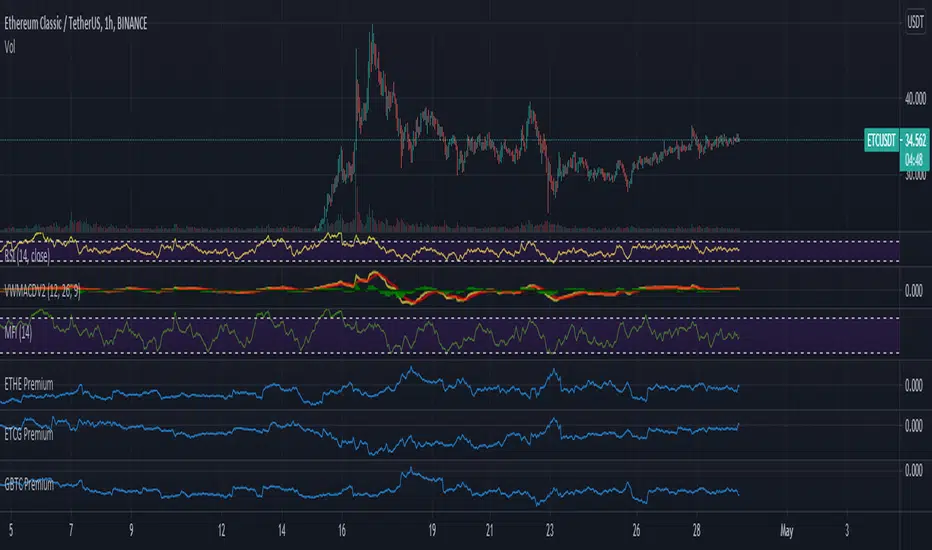
ETHE PremiumThis script simply shows the premium (when positive) and discount (when negative) associated with ETHE as compared with its estimated NAV based on ETH underlying holdings. This will of course need to be updated frequently for accuracy, but it serves as a rough estimate for educational purposes.
D-ETH
Price DEFI Categories against BTC & ETH/* Work in progress. The indicator is not finished. *\
The indicator shows the pricing of 3 DEFI categories against 2 possible baselines, BTC and ETH.
To do:
* Make a simple array in the source code to enter and remove new projects to the category. -> Maybe can also make it so that the source code does not have to be altered (projects can be added through input etc.)
* Adjust weightings depending on project data but this is not as important since weightings are being priced in by the market.
* Try to find a way to update input to string instead of booleans. As of currently, I could not seem to use input strings into plot functions because of an error.
* and more. Leave some feedback, that would be highly appreciated!

Crypto PricesA simple indicator that gives you a quick overview of which BTC & ETH markets are the most expensive and which are the cheapest at any given time.
Five spot markets and five derivatives markets are included.
An average price of all those markets is calculated and then it shows you how the markets selected are trading relatively to that average.
The average will always be based on all markets (for each coin), but you can add or exclude markets to compare in the settings (do it in the input settings, NOT the style settings).
There's a lot of information that can be derived from comparing prices of different markets.
Markets included:
SPOT
Bitfinex
Coinbase
Binance
FTX
Huobi
DERIVS
Bitmex
Bybit
Binance
FTX
Deribit
It's free so just add it to your favourites and you can start using it.
Shout-out to /u/dogepgp for helping me out with this indicator.

Bitfinex Spot PremiumOverview
A tool to display the spot price premium of Bitfinex coins vs the other big 3 exchanges.
Premium is calculated against:
- Coinbase
- Binance
- FTX
The average is calculated through volume weighting. The absolute difference between the Bitfinex spot price and the calculated average is then displayed on the histogram.
Interacting with the tool
Colours: Green bars indicate a positive premium (Bitfinex spot price is greater than the average), Red bars indicate a negative premium. The ability to grey out smaller premiums is also enabled with the "Grey Small Vals" checkbox, this can be used to further emphasise larger premiums.
Ticker: The ticker input allows you to detect the Bitfinex premium for any coin traded within all 4 exchanges (Bitfinex, Coinbase, Binance, FTX). Just input the coins ticker symbol, for example, "BTC", "ETH", "UNI".
Indicator Ideology
Bitfinex is known for being the home of crypto "smart money". Therefore, positive premiums indicate stronger buying from "smart money". Although this premium is a good sign of bullish/ bearish market conditions, for example, consecutive days of a negative Bitfinex premium have been pretty good at indicating short term tops in BTC, this indicator should only be used as a confirmation signal.

QMWD RangerThis script will display the previouse Highs, Lows and Mid of the last:
- Quarter
- Month
- Week
- Day
Ranges
Its pretty good in finding potential pivot areas.

Full strategy Psar+ adx + cmf + rsi This ia full strategy made with a combination of a trender, volume, volatility and oscillator.
In this case we only go long.
Indicators used:
Default PSAR
Default CMF
Modified RSI logic, not using OB/OS
ADX with EMA applied
The rules are : we check if we are in a uptrend on psar, together with a positive value in volume, rsi is above the middle line(50), using a big length, and lastly the ADx is superior to the ema ADx
For exit, we check the opposite, like downtrend psar, negative value volume, rsi < 50, and adx < ema adx
If you have any questions let me know.

4X EMA and volume strategyThis is a strategy made from multiple types of EMA and volume(EOM).
This is a long only strategy.
EMA 1 = 13
EMA 2 = 21
EMA 3 = 50
EMA 4 = 180
In this case we have 2 options for entry:
1.We check that are candles are in ascending order and EOM is above 0 - > long, descending and eom<0 -> exit long
2.We check if we have a crossover between the first ema with the second and the third. Cross up -> long, crossdown -> exit long
If you have any questions let me know!

Korea PremiumA simple indicator based on the percentage price difference between Korean crypto markets and western markets.
It currently shows the premium for BTC & ETH.
If it's positive (red) it means that the Korean market is trading at a premium.
Vice versa negative (blue) means the West is trading at a premium.
Because the Korean crypto market is so closed off (because of regulations) the premium sometimes gets really wild.
The Korean average is based on Bithumb & Korbit prices.
The index made for the west is based on Coinbase, Kraken and Bitstamp.
By default it uses closing prices for the calculation but you can change that.
You can also change the timeframe in the settings although it's probably best that you keep it at "same as chart".
It's free so you can just add it to your favourites and start using it.

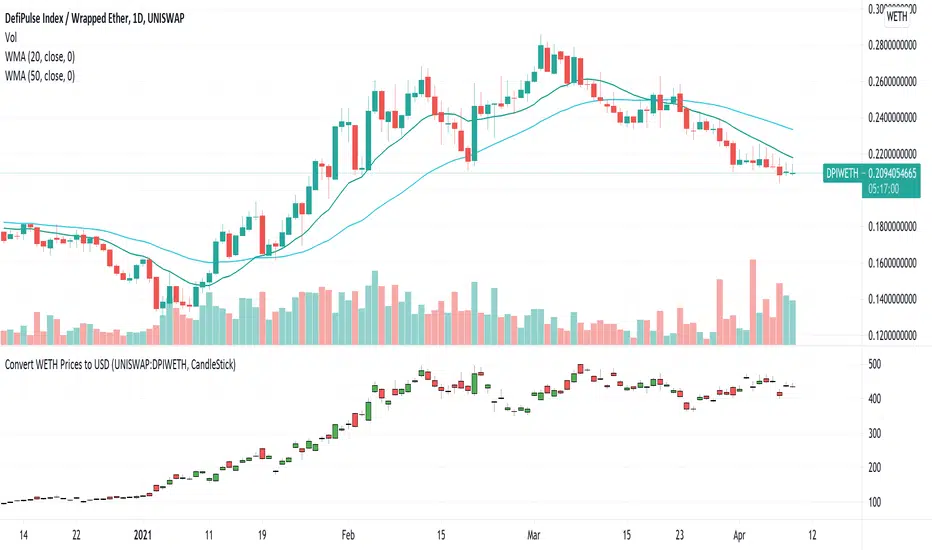
USD Prices for Uniswap Token/WETHUniswap instrument prices are in WETH. This indicator translates the series to USD prices and plots the series as candles or as a line. Data is translated by using corresponding series data for ETHUSD. The reference ETHUSD price is from Coinbase.
Any token listed as a ETH/WETH pair could be specified as an input parameter. The default instrument value is set to UNISWAP: DPIWETH, an index created by indexcoop and tracking the DEFI basket.
The script is simple and easy to understand. It allows for quick conversion and comparisons and something we had to do in a custom way prior to this script. The crypto and DEFI community would benefit from it immensely. There is even a feature request for something like this on the tradingview subreddit.
Full CRYPTO pack macd, rsi, obv, ema alert versionThis is the indicator version of a simple, yet very efficient crypto strategy, adapted to 4h time frame, on big coins like ETH and BTC . However it can be adapted to other markets, timeframes etc
For this strategy I use a combination of a trend line , an oscillator, price action and volume .
This study has alert for both long and short entries/exit.
The rules are the next ones:
Long : we check that current candle is ascending and above the moving average, the macd is in positive range, rsi is below overbought level and volume is bigger than the moving avg of volume .
For short, we have the opposite long rules.
If you have any questions, please let me know !

Full CRYPTO pack macd, rsi, obv, ema strategyThis is a simple, yet very efficient crypto strategy, adapted to 4h time frame, on big coins like ETH and BTC. However it can be adapted to other markets, timeframes etc
For this strategy I use a combination of a trend line, an oscillator, price action and volume.
This strategy has both the opportunity to go long and short.
As well, it has a leverage simulator .
The rules are the next ones:
Long : we check that current candle is ascending and above the moving average, the macd is in positive range, rsi is below overbought level and volume is bigger than the moving avg of volume.
For short, we have the opposite long rules.
If you have any questions, please let me know !

MACD oscillator with EMA alert version 4HThis is the study/indicator alert version of the macd + ema strategy.
The strategy details are the following :
Is a simple, yet efficient strategy, which is made from a combination of an oscillator and a moving average.
Its setup for 4h candles with the current settings, however it can be adapted to other different timeframes.
It works nicely ,beating the buy and hold for both BTC and ETH over the last 3 years.
As well with some optimizations and modifications it can be adapted to futures market, indexes(NASDAQ, NIFTY etc), forex( GBPUSD ), stocks and so on.
Components:
MACD
EMA
Time condition
Long/short option
For long/exit short we enter when we are above the ema , histogram is positive and current candle is higher than previous.
For short /exit long , when close below ema , histo negative and current candles smaller than previous
If you have any questions please let me know !

MACD oscillator with EMA strategy 4H This is a simple, yet efficient strategy, which is made from a combination of an oscillator and a moving average.
Its setup for 4h candles with the current settings, however it can be adapted to other different timeframes.
It works nicely ,beating the buy and hold for both BTC and ETH over the last 3 years.
As well with some optimizations and modifications it can be adapted to futures market, indexes(NASDAQ,NIFTY etc), forex(GBPUSD), stocks and so on.
Components:
MACD
EMA
Time condition
Long/short option
For long/exit short we enter when we are above the ema, histogram is positive and current candle is higher than previous.
For short /exit long , when close below ema, histo negative and current candles smaller than previous
If you have any questions please let me know !

ELIA MULTI INDICATORS STRATEGYExperimental multi indicators strategy, to catch right entry and avoid noise.
Each indicator included in the strategy, assume a value based on its status and because is a trend-follow strategy, some indicator value are higher then the other
Backtested on ETHUSDTPERP
BINANCE:ETHUSDTPERP

Crypto price action strategy long onlyThis is a very powerful strategy, which I adapted mostly for futures perp pairs like BTCUSDTPERP or ETHUSDTPERP.
Its made purely of price action rules like :
We check for the last down candle before a sequence of up candles, or the last up candle before a sequence of down candles.
At the same time I combine with other rules ,like for example during this sequence comparing the actual candle high and low with the min/max of the candles from the sequece before establishing if its a potential entry or not.
So far I have noticed that it works greatly with big timeframes 1h+ .
The results from above are using 1h on BTCUSDTPERP binance, together with 4 on length and 0.03% comission for futures on perp binance
If there are any questions , let me know in private !

ETH Perp Volume Per ExchangeETH aggregated volume of perpetual swap contracts in stacked or indexed format, denominated in US dollars.
Gives you a simple overview of which markets account for the most volume.
Markets included:
Binance
Huobi
Bybit
Bitmex
FTX
Deribit
Kraken
In the settings you can exclude/include markets.
Do this in the input settings, NOT in the style settings (or the calculations will be messed up).
It's free so just add it to your favourites and you can use it

ETH Spot Volume Per ExchangeETH aggregated spot volume in stacked or indexed format, denominated in US dollars.
Give you a simple overview of which markets account for the most volume.
Markets included:
Binance
Okex
Huobi
Coinbase
Bitfinex
Bitstamp
FTX
In the settings you can exclude/include markets.
Do this in the input settings, NOT in the style settings (or the calculations will be messed up).
It's free so just add it to your favourites and you can use it

Crypto ENGULF Candle with EMAThis is strategy based on the popular candle pattern, the ENGULFING candle together with multiple EMA for small and big length, in this case 5,20,50 and 200.
The logic for long is the next one, we have a big engulf candle, meaning the the engulf low is lower than the previous low and the high of the candle is higher than the previous candle, together with close of the engulf higher than the previous candle. At the same time I am checking that the EMA are in ascending order , like small one bigger than the middle one and the middle one above big one.
For short, we check the same patterns for engulf, but this time applied to a red candle, opposite to a green candle in long. The same we check for EMA that they are in descending order, like 5<20 and 20<50 and so on.
For exit in both situations, I use the EMA 200 cross above or below, together with a tp/sl system.
If you have any questions, please let me know on private

Volume Extractor By CryptoScriptsThe Volume Extractor is an indicator I've been working on for awhile that involves a Volume Oscillator derived from various volume metrics combined with Bollinger Bands and Overbought/Oversold levels. This indicator is unique because it not only measures the standard deviations whenever the oscillator crosses outside the BBs but it does so at ranges that are most advantageous for the trader to identify KEY buy/sell levels (as shown above). I'll break down each signal below and how to best take advantage of them so you can get the best entries and capture the most profit per trade.
*This indicator works best on the Binance or Bybit exchange for crypto but also works for stocks and forex. It's best used on small-medium timeframes such as the 15m, 1h, 4h, 8hr, or 12h. It tends to give more false signals on the 1D timeframes and higher.
Red Alarm - this signal indicates that the volume oscillator is overbought AND is crossing outside of the bollinger bands . This is a STRONG sell signal but should still be combined with support/resistance levels and confirmed with other indicators.
Red Diamond - this signal indicates that the volume oscillator is crossing outside of the bollinger bands above the 20 level but is not yet overbought. This is a potential sell signal but should still be combined with support/resistance levels and confirmed with other indicators.
Red Shaded Area - this indicates the volume oscillator is overbought. This is a potential sell signal but should still be combined with support/resistance levels and confirmed with other indicators.
Rocket - this signal indicates that the volume oscillator is oversold AND is crossing outside of the bollinger bands . This is a STRONG buy signal but should still be combined with support/resistance levels and confirmed with other indicators.
Green Diamond - this signal indicates that the volume oscillator is crossing outside of the bollinger bands below the 20 level but is not yet oversold. This is a potential buy signal but should still be combined with support/resistance levels and confirmed with other indicators.
Green Shaded Area - this indicates the volume oscillator is oversold. This is a potential buy signal but should still be combined with support/resistance levels and confirmed with other indicators.
Input Options
Show 80 Levels - This checkbox will create a red zone and green zone for the 60-80 levels on the indicator. This is useful if the volume oscillator reaches one of these levels, you can be sure it's going to reverse soon and can have more confidence if it crosses outside of the BBs in addition to that.
VEO Length - This changes the height of the oscillator and will change how your signals flash (more or less often). Use this if you find you're getting too many signals or not enough. I find this is best at 21 but feel free to test out what works for you depending on your timeframe.
Moving Average Volume Source - This is currently set to None but you can change it to Exponential, Hull, or Simple moving average . I found that None works best but feel free to test out the different options.
Moving Average Length - Changing this length will do nothing to your chart if None is selected for the Moving Average Volume Source, therefore you will most likely keep this setting default at 9.
Alerts
I've set alerts on this indicator for each icon (Red Alarm, Red Diamond, Overbought, Rocket, Green Diamond, Oversold). I HIGHLY recommend setting the alerts for Candle Close so that you can be sure the signal is confirmed.
You may notice that the indicator can give multiple signals back-to-back or be overbought/oversold for multiple candles. When this happens, it's best to look at other indicators such as the RSI , MFI Pro, etc to nail the best entry and have confluence with your decision. With that said, having multiple signals back-to-back can also be an indication that the move is close to happening.
This indicator is a strong indicator by itself but works best when paired with my Price Extractor indicator i.e taking a trade when both indicators are displaying overbought/oversold or crossing outside of the bollinger bands . Measuring price action is an extremely important aspect of trading and one I believe should not be overlooked. I hope I made everything as clear as possible and please let me know if I didn't.
PM me to obtain access and please let me know if you have any questions!

Bitcoin Bullrun ATHFind Bitcoin's next ATH before bearmarket.
This indicator, which successfully indicated the 3 previous tops, has been modified and improved.
Its precision is the most accurate on the 2h timeframe.
3 features:
- A visual percentage gauge will show the next potential high of the current bull run when it reaches 100%
- Possibility to add an alert when the gauge reaches 100%. To do this, go to the tradingview alert menu and instead of the ticker, choose "Bitcoin Bullrun ATH" (Don't forget to set the timeframe on 2h or less.)
- Possibility to choose if you want to see or not the tips/gauge/percentage only.
Welcome and have a good bull run.

Price Extractor By CryptoScriptsThe Price Extractor is an indicator I've been working on for awhile that involves a Price Oscillator derived from various moving averages combined with Bollinger Bands and Overbought/Oversold levels. This indicator is unique because it not only measures the standard deviations whenever the oscillator crosses outside the BBs but it does so at ranges that are most advantageous for the trader to identify KEY buy/sell levels (as shown above). I'll break down each signal below and how to best take advantage of them so you can get the best entries and capture the most profit per trade.
*This indicator works best on the Binance or Bybit exchange for crypto but also works for stocks and forex. It's best used on small-medium timeframes such as the 15m, 1h, 4h, 8hr, or 12h. It tends to give more false signals on the 1D timeframes and higher.
Red Alarm - this signal indicates that the price oscillator is overbought AND is crossing outside of the bollinger bands. This is a STRONG sell signal but should still be combined with support/resistance levels and confirmed with other indicators.
Red Diamond - this signal indicates that the price oscillator is crossing outside of the bollinger bands above the 20 level but is not yet overbought. This is a potential sell signal but should still be combined with support/resistance levels and confirmed with other indicators.
Red Shaded Area - this indicates the price oscillator is overbought. This is a potential sell signal but should still be combined with support/resistance levels and confirmed with other indicators.
Rocket - this signal indicates that the price oscillator is oversold AND is crossing outside of the bollinger bands. This is a STRONG buy signal but should still be combined with support/resistance levels and confirmed with other indicators.
Green Diamond - this signal indicates that the price oscillator is crossing outside of the bollinger bands below the 20 level but is not yet oversold. This is a potential buy signal but should still be combined with support/resistance levels and confirmed with other indicators.
Green Shaded Area - this indicates the price oscillator is oversold. This is a potential buy signal but should still be combined with support/resistance levels and confirmed with other indicators.
Input Options
Show 80 Levels - This checkbox will create a red zone and green zone for the 60-80 levels on the indicator. This is useful if the price oscillator reaches one of these levels, you can be sure it's going to reverse soon and can have more confidence if it crosses outside of the BBs in addition to that.
PEO Length - This changes the height of the oscillator and will change how your signals flash (more or less often). Use this if you find you're getting too many signals or not enough. I find this is best at 21 but feel free to test out what works for you depending on your timeframe.
Moving Average Price Source - This is currently set to None but you can change it to Exponential, Hull, or Simple moving average. I found that None works best but feel free to test out the different options.
Moving Average Length - Changing this length will do nothing to your chart if None is selected for the Moving Average Price Source, therefore you will most likely keep this setting default at 9.
Alerts
I've set alerts on this indicator for each icon (Red Alarm, Red Diamond, Overbought, Rocket, Green Diamond, Oversold). I HIGHLY recommend setting the alerts for Candle Close so that you can be sure the signal is confirmed.
You may notice that the indicator can give multiple signals back-to-back or be overbought/oversold for multiple candles. When this happens, it's best to look at other indicators such as the RSI, MFI Pro, etc to nail the best entry and have confluence with your decision. With that said, having multiple signals back-to-back can also be an indication that the move is close to happening.
This indicator is a strong indicator by itself but works best when paired with my Volume Extractor indicator i.e taking a trade when both indicators are displaying overbought/oversold or crossing outside of the bollinger bands. Measuring price action is an extremely important aspect of trading and one I believe should not be overlooked. I hope I made everything as clear as possible and please let me know if I didn't.
PM me to obtain access and please let me know if you have any questions!

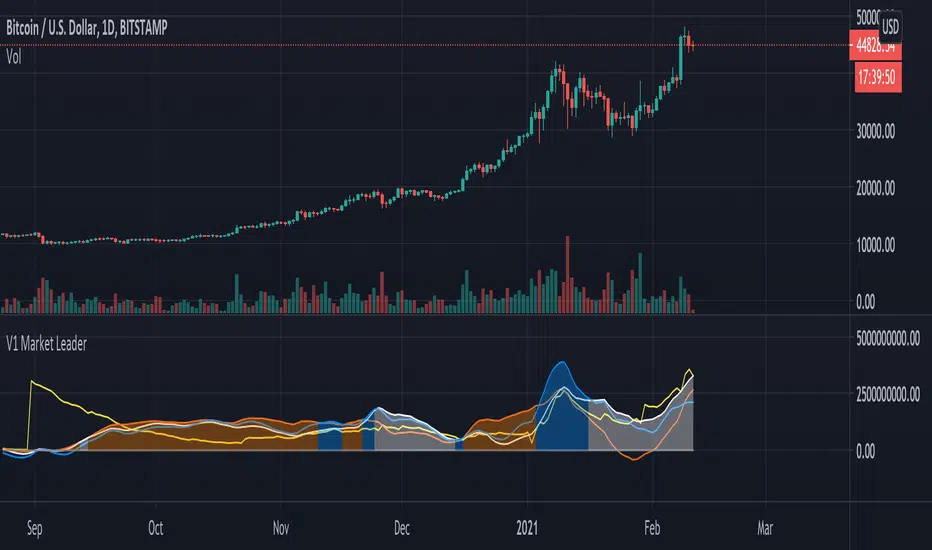
V1 Market Leader
This script aims to identify who the current market leader is between 3 participants, BTC , ETH and ALTS & ETH combined.
Colour coded so you can identify what is what in the settings - Default setting are: BTC = Orange, ETH = Blue and ALTS & ETH = White.
There is also a line to identify the market movement in relation to amount of Tether currently in circulation - Default setting is: Tether = Yellow.
This script can be used on any timeframe but I recommend 12H or greater.
Lines can be turned on and off in settings for cleaner look.
ETH Top Cap [jamesray]This script is modified from Top Cap , as published here.
Historically it matches market tops for ETH
