BITMEX Bybit binance HUOBI OKCOIN BTC ETH TREND ATR strategyBITMEX Bybit binance HUOBI OKCOIN BTC ETH TREND ATR strategy
This is a very effective trend strategy.
Strategy principle
HOW TO USE
set long position when a green arrow appears in the chart.
set short position when a red arrow appears in the chart.
For the long position and the short direction, you can set the stop profit & stop loss or trailing profit stop & trailing stop loss respectively.
When a purple arrow appears to close a position, an aggressive trader can go in the opposite direction when it is purple.
Strategy applicability
The default setting is for bitmex perpetual swap contract XBTUSD , bybit BTCUSD perpetual futures contract ,binance btcusdt Spot,Bitfinex BTCUSD Spot,bitflyer BTCJPY Spot,bithumb BTCKRW Spot,bitso BTCMXN Spot, bitstamp BTCUSD Spot,bittrex BTCUSDT Spot,Coinbase BTCUSD spot, deribit BTCPERP perpetual futures contract,gemini BTCUSD Spot,Hitbit BTCUSDT Spot,huobi BTCUSDT Spot KRAKEN XBTUSD spot,OKCOIN OKEX BTCUSD3M BTCUSD BTCUSD2W,Poloniex BTCUSDT Spot etc btc symbol with 30 minutes timeframe.
This indicator has broad applicability and can be applied to multiple different symbols.
This indicator also applies to the ETHUSD symbol etc, just adjust the default configuration.
Using the alert of the indicator, it can work well on the trading robot like Gunbot,autoview, without repaint false signals.
这是非常有效的趋势策略。
如何使用
在图表中出现绿色箭头就做多。
在图表中出现红色箭头就做空。
对于多头头寸和空头方向,您可以分别设置止损和止损或尾随利润止损和尾随止损;当出现紫色箭头时平仓,激进的交易者,可以在紫色时就做反方向。
策略适用性
默认设置是针对bitmex交易所 XBTUSD永久掉期合约,BYBIT交易所 BTCUSD永续期货合约,binance币安交易所 btcusdt现货,Bitfinex交易所 BTCUSD现货,bitflyer交易所 BTCJPY现货,bithumb交易所 BTCKRW现货,bitso交易所 BTCMXN现货,bitstamp交易所 BTCUSD现货,bittrex交易所 BTCUSDT现货,Coinbase交易所 BTCUSD现货,deribit交易所 BTCPERP永续期货合约,gemini双子星交易所 BTCUSD现货,Hitbit交易所 BTCUSDT现货,huobi火币交易所 BTCUSDT现货,KRAKEN交易所 XBTUSD现货,OKCOIN OKEX交易所 BTCUSD3M OK BTC季度合约 BTCUSD BTCUSD2W OK BTC次周合约,Poloniex BTCUSDT现货等2小时区间的btc交易。
Bitmex XBTUSD 90分钟 比特币期货 90 minutes Bitcoin Futures
Bitmex XBTUSD 2H 比特币现货 2 hours Bitcoin Futures
Bitmex XBTUSD 16分钟 比特币期货 90 minutes Bitcoin Futures
这个指标具有广泛的适用性,可以适用多个不同交易品种。
该指标还适用于ETHUSD交易品种等,只需调整默认配置即可。
Bitmex ETHUSD 2H 以太币合约
Bitmex ETHUSD 30 以太币合约
Bybit ETHUSD 30分钟合约
使用该指标的警报设置,它可以在自动交易机器人上很好地工作,而无重绘错误的信号。
D-ETH

BITMEX Bybit binance Bitfinex OKCOIN BTC ETH TREND AlertBITMEX Bybit binance Bitfinex Coinbase OKCOIN BTC ETH TREND Alert
This is a very effective trend strategy.
Strategy principle
HOW TO USE
set long position when a green arrow appears in the chart.
set short position when a red arrow appears in the chart.
For the long position and the short direction, you can set the stop profit & stop loss or trailing profit stop & trailing stop loss respectively.
When a purple arrow appears to close a position, an aggressive trader can go in the opposite direction when it is purple.
Strategy applicability
The default setting is for bitmex perpetual swap contract XBTUSD , bybit BTCUSD perpetual futures contract ,binance btcusdt Spot,Bitfinex BTCUSD Spot,bitflyer BTCJPY Spot,bithumb BTCKRW Spot,bitso BTCMXN Spot, bitstamp BTCUSD Spot,bittrex BTCUSDT Spot,Coinbase BTCUSD spot, deribit BTCPERP perpetual futures contract,gemini BTCUSD Spot,Hitbit BTCUSDT Spot,huobi BTCUSDT Spot KRAKEN XBTUSD spot,OKCOIN OKEX BTCUSD3M BTCUSD BTCUSD2W,Poloniex BTCUSDT Spot etc btc symbol with 30 minutes timeframe.
This indicator has broad applicability and can be applied to multiple different symbols.
This indicator also applies to the ETHUSD symbol etc, just adjust the default configuration.
Using the alert of the indicator, it can work well on the trading robot like Gunbot,autoview, without repaint false signals.
这是非常有效的趋势策略。
如何使用
在图表中出现绿色箭头就做多。
在图表中出现红色箭头就做空。
对于多头头寸和空头方向,您可以分别设置止损和止损或尾随利润止损和尾随止损;当出现紫色箭头时平仓,激进的交易者,可以在紫色时就做反方向。
策略适用性
默认设置是针对bitmex交易所 XBTUSD永久掉期合约,BYBIT交易所 BTCUSD永续期货合约,binance币安交易所 btcusdt现货,Bitfinex交易所 BTCUSD现货,bitflyer交易所 BTCJPY现货,bithumb交易所 BTCKRW现货,bitso交易所 BTCMXN现货,bitstamp交易所 BTCUSD现货,bittrex交易所 BTCUSDT现货,Coinbase交易所 BTCUSD现货,deribit交易所 BTCPERP永续期货合约,gemini双子星交易所 BTCUSD现货,Hitbit交易所 BTCUSDT现货,huobi火币交易所 BTCUSDT现货,KRAKEN交易所 XBTUSD现货,OKCOIN OKEX交易所 BTCUSD3M OK BTC季度合约 BTCUSD BTCUSD2W OK BTC次周合约,Poloniex BTCUSDT现货等2小时区间的btc交易。
Bitmex XBTUSD 30分钟 比特币期货 30 minutes Bitcoin Futures
Bitfinex BTCUSD 30分钟 比特币现货 30 minutes Bitcoin Spot
Bybit BTCUSD 30分钟 比特币合约 30 minutes Bitcoin Futures
OKEX BTCUSD2M 30分钟 比特币次周合约 30 minutes Half a month Bitcoin Futures
Bitmex XBTUSD 2H 比特币现货 2 hours Bitcoin Futures
binance BTCUSDT 2H 比特币现货 2 hours Bitcoin Spot
Bybit BTCUSD 2H 比特币期货 2 hours Bitcoin Futures
这个指标具有广泛的适用性,可以适用多个不同交易品种。
该指标还适用于ETHUSD交易品种等,只需调整默认配置即可。
Bitmex ETHUSD 30 以太币合约
Bybit ETHUSD 30分钟合约
OKCOIN ETHUSD3W 30分钟季度合约
Bitmex ETHUSD 2H 以太币合约
Bybit ETHUSD 2H 以太币合约
HUOBI ETHUSD 2H 火币以太币现货
使用该指标的警报设置,它可以在自动交易机器人上很好地工作,而无重绘错误的信号。

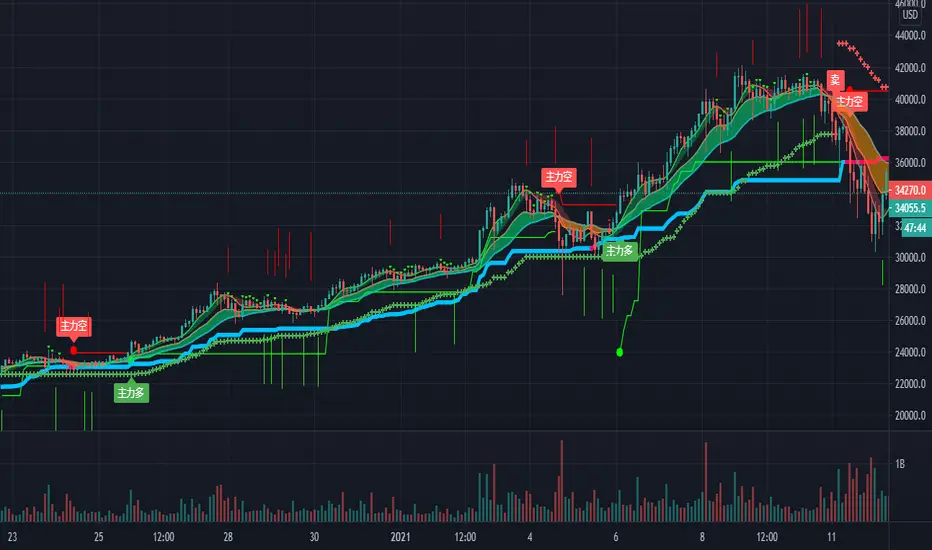
BITMEX Bybit binance bitstamp Coinbase HUOBI BTC ETH TRENDBITMEX Bybit binance bitstamp Coinbase HUOBI BTC ETH TREND
This is a very effective trend strategy.
Strategy principle
Constructs the trailing ATR stop above or below the price, and switches directions when the source price breaks the ATR stop.
Uses the Average Directional Index (ADX) to switch between ATR multipliers. The higher multiplier is used when the ADX is rising, and the lower ATR multiplier is used with the ADX is falling.
This ADX criteria further widens the gap between the source price and the trailing ATR stop when the price is trending,and lessens the gap between the ATR and the price when then price is not trending.
The ATR-ADX stop is effectively a double adapative stop that trails the price,by both adapting to the true range of the price, and the average directional change.
HOW TO USE
set long position when a green arrow appears in the chart.
When the stop is below the price (long trade) the value never decreases until the price intersects the stop, and it reverses to being above the price (short trade)。
set short position when a red arrow appears in the chart.
When the stop is above the price it will never increase until it is intersected by the price. As the true range and ADX change, the stop will move more quickly or more slowly.
For the long position and the short direction, you can set the stop profit & stop loss or trailing profit stop & trailing stop loss respectively.
When a purple arrow appears to close a position, an aggressive trader can go in the opposite direction when it is purple.
Strategy applicability
The default setting is for bitmex perpetual swap contract XBTUSD , bybit BTCUSD perpetual futures contract ,binance btcusdt Spot,Bitfinex BTCUSD Spot,bitflyer BTCJPY Spot,bithumb BTCKRW Spot,bitso BTCMXN Spot, bitstamp BTCUSD Spot,bittrex BTCUSDT Spot,Coinbase BTCUSD spot, deribit BTCPERP perpetual futures contract,gemini BTCUSD Spot,Hitbit BTCUSDT Spot,huobi BTCUSDT Spot KRAKEN XBTUSD spot,OKCOIN OKEX BTCUSD3M BTCUSD BTCUSD2W,Poloniex BTCUSDT Spot etc btc symbol with 2 hour timeframe.
This indicator has broad applicability and can be applied to multiple different symbols.
This indicator also applies to the ETHUSD ETHBTC EOSBTC BNBBTC symbol etc, just adjust the default configuration.
Using the alert of the indicator, it can work well on the trading robot like Gunbot,autoview, without repaint false signals.
这是非常有效的趋势策略。
策略原理
在价格之上或之下构造追踪的支撑压力位并在源价格突破压力位时的切换操作方向,使用平均趋向指数(ADX)与ATR系数之间切换。
当ADX上升时使用上升的ATR系数,而ADX时下降时使用下降的ATR系数。
当价格趋势变化时,ADX参数在价格趋向变大时使源价格止损点与后续ATR进一步扩大,并在价格趋向平缓时减小了ATR与价格之间的差距。
如何使用
ATR-ADX压力线通过适应价格的真实波动范围和平均趋向变动达到跟随价格的双适应性止损目的。当做多时,止损线低于价格,并随价格升高,直到止损线与价格相交,然后反转至高于价格,此时启动空头交易;
在图表中出现绿色箭头就做多。
当做空时,止损线高于价格,并随价格降低,直到止损线与价格相交,然后反转至低于价格,此时启动多头交易;在图表中出现红色箭头就做空。随着真实波动和ADX的变化,止损线将移动得更快或更慢。
对于多头头寸和空头方向,您可以分别设置止损和止损或尾随利润止损和尾随止损;当出现紫色箭头时平仓,激进的交易者,可以在紫色时就做反方向。
策略适用性
默认设置是针对bitmex交易所 XBTUSD永久掉期合约,BYBIT交易所 BTCUSD永续期货合约,binance币安交易所 btcusdt现货,Bitfinex交易所 BTCUSD现货,bitflyer交易所 BTCJPY现货,bithumb交易所 BTCKRW现货,bitso交易所 BTCMXN现货,bitstamp交易所 BTCUSD现货,bittrex交易所 BTCUSDT现货,Coinbase交易所 BTCUSD现货,deribit交易所 BTCPERP永续期货合约,gemini双子星交易所 BTCUSD现货,Hitbit交易所 BTCUSDT现货,huobi火币交易所 BTCUSDT现货,KRAKEN交易所 XBTUSD现货,OKCOIN OKEX交易所 BTCUSD3M OK BTC季度合约 BTCUSD BTCUSD2W OK BTC次周合约,Poloniex BTCUSDT现货等2小时区间的btc交易。
Bitmex XBTUSD 2H 比特币合约
Binance币安 BTCUSDT 2H 比特币现货
Bitfinex BTCUSD 2H 比特币现货
Bitstamp BTCUSD 2H 比特币现货
COINBASE BTCUSD 2H 比特币现货
HUOBI火币 BTCUSDT 2H 比特币现货
OKEX BTCUSD3M 2H 比特币季度合约
Bybit BTCUSD 2H 比特币合约
这个指标具有广泛的适用性,可以适用多个不同交易品种。
该指标还适用于ETHUSD ETHBTC EOSBTC BNBBTC交易品种等,只需调整默认配置即可。
bitmex ETHUSD 2H期货
binance ETHUSDT 2H现货
Bybit ETHUSD 2H合约
HUOBI火币 ETHUSDT 2H现货
OKCOIN ETHUSD1W 2H期货
binance币安EOSBTC 2H
Binance币安 ETHBTC 2H
使用该指标的警报设置,它可以在自动交易机器人上很好地工作,而无重绘错误的信号。

Cracking Cryptocurrency - ParalloxParallox
Many traders are familiar with or utilize the Relative Strength Index ( RSI ) and/or the Commodity Channel Index ( CCI ). For good reason, these classic and simple to understand indicators have made their way into many traders indicator bays with mixed results. As we often do with our trading style and indicators here at Cracking Cryptocurrency is take things that traders have used one way and attempt to view it in a different light to improve our trading efficiency and performance. That is what we have done with Parallox.
Parallox harnesses the calculations of both the Relative Strength Index and Commodity Channel Index , but through a calculation for a new breed of trader and a new market. RSI and CCI were designed to work in the stock markets of old, and their effectiveness nowadays is more-so due to the "self fulfilling prophecy" concept of so many traders using them rather then their technical applicability to any particular market or market circumstance. Moreover, because so many retail traders now utilize the RSI and CCI , trading it the traditional way, for reversals, has created a golden zone of opportunity for larger traders, institutions, and whales to come in and grab the liquidity of counter-trend retail traders basing their signals off of overbought and oversold conditions in the market utilizing RSI and CCI .
What Parallox does is quite different. Instead of relying on the readings of RSI and CCI , it looks at the value of RSI relative to the value of CCI . By looking at the convergence or divergence of these two indicators, a much more accurate reading of the directional trend can be established. No more using these oscillators to pick false tops and bottoms, instead we can utilize their relative conditions to determine market trend. Not only that, but we can identify objective signals when we cross the barrier between convergence and divergence, therefore giving us clear buy and sell signals for any trading asset.
However, we haven't left reversal traders completely by the way side. What is often an "entry" point for reversal traders, when one has determined that the particular direction of the market is at it's extreme, is where Parallox crosses back the other way, identifying an "overbought" and "oversold" region of sorts, from which we can utilize as an exit indicator when in deeply profitable trending trades.
How to Use
Using Parallox is quite simple. It can be utilized as an Initiator or Confirmer, or also as a longer-term directional marker on any time frame. In it's most simple form, the Parallox Line will cross zero from below and the line will turn green. This is an indication that the market has moved from a bearish zone of control to a bullish zone of control, and can be viewed as a potential buy signal. Conversely, when the line crosses zero from above, the line will turn red, indicating the opposite and can be viewed as a potential short sell signal.
For exit indications in strongly trending markets, when the line goes below the lower dashed line when bearish , and above the upper dashed line when bullish , and comes either back below or back above, those can be seen as trend exhaustion signals and often represent great moments to take profit or to go flat in the market until another trend establishes itself.
Settings
Let's take a look at the settings of Parallox.
First, we can input the look back length we want for our RSI and CCI indicators. You will notice that the defaults are unnatural, that is because they are tuned specifically for the BTC USD market. When trading a different asset, you will want to experiment with the optimum look back length for the best signals.
We then take a moving average of our indicators to have plotted values to work with. As above, the look back lengths for the two moving averages are optimized for BTC USD. The same caveats for optimization apply.
Then we can select the smoothing, or type of moving average we wish to utilize. Parallox performs well with different types of moving average smoothing, and I recommend that you experiment with your style of trade to find the signals that best suit your trading system.
We can also select the source of our indicator values. By default, this is hl2 , which I find to be the best for most indicators, in a close tie with hlc3.
Strategy
Please let me know of your success stories, as well as any features you think would be helpful to add. If you notice any errors within it, please notify me so I can fix them. Trade Safely.

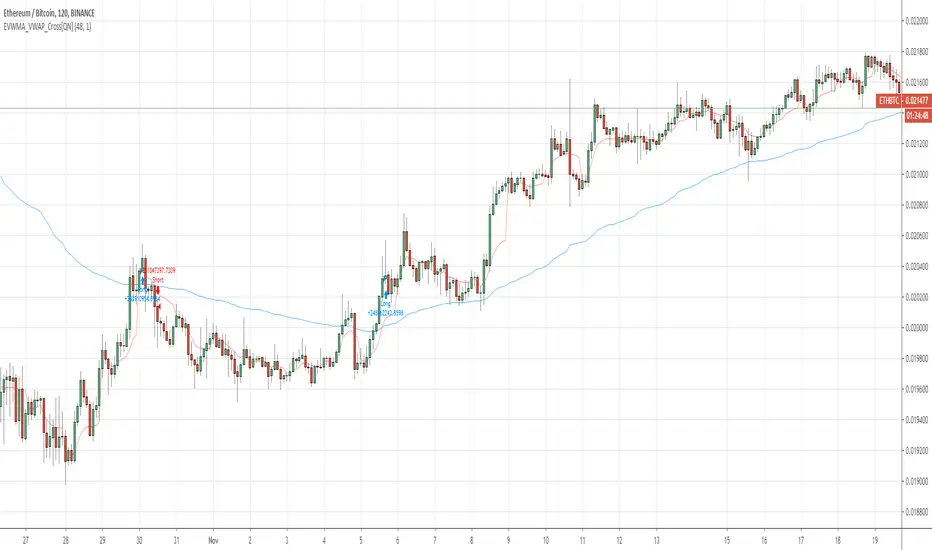
EVWMA VWAP Cross Strategy [QuantNomad]Continue to experiement with VWAP and EVWMA.
It seems that just simple crosses between VWAP and EVWMA can be pretty good signals. VWAP is a bit choppy so you can use VWAP smoothing input to smoth it a bit.
Here are few other strategies based on EVWMA:
EVWMA VWAP MACD Strategy
QuantNomad - EVWMA MACD Strategy
FS position sizethis is position sizing indicator base on Justin wise and his team on crackingcryptocurrency idea
so all credit goes to them
you can put your capital and risk amount that you tend to put on risk in a trade and it will measure your position size base on USD and BTC and it will measure your Take profits base on ATR which are editable.

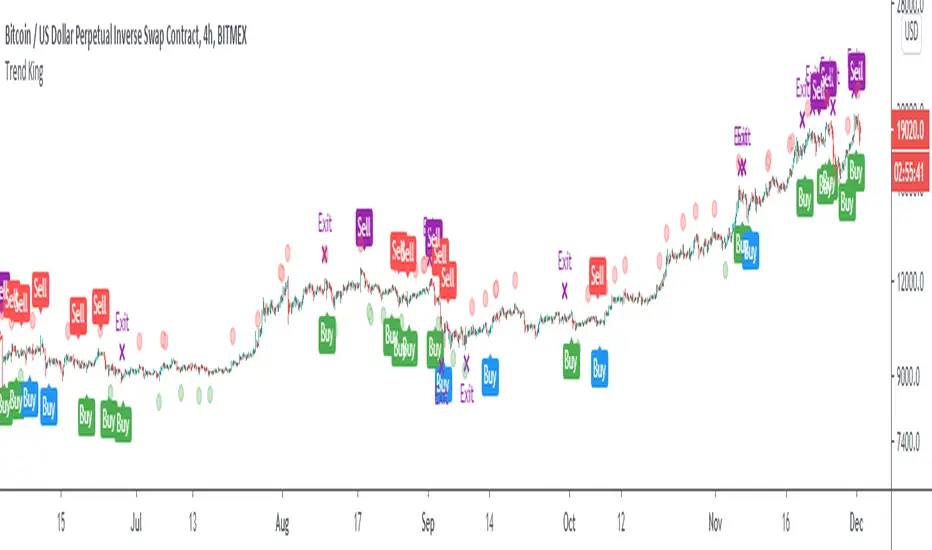
Trend KingIntroducing “Trend King”.
The alpha generating strategy built for Crypto.
“Trend King” combines 4 proprietary indicators. It buys and sells based on:
Short-term momentum
Long-term momentum
Volume compression
Volatility breakouts
The strategy was built on 2 years of BitMEX data (XBTUSD) and backtested on 9 years of Bitcoin data (BLX). Finally, the strategy was validated on multiple large market cap cryptocurrencies, including Ethereum (ETHUSD), without parameter adjustment.
Strategy backtesting checks include:
Used 0.12% fees. 60% more than the actual BitMex/Binance fees of 0.075%.
No Heikin-Ashi Candles (to avoid fake results)
No Stop-losses (to avoid fake order execution)
Market Orders Only (to avoid fake order execution)
The results speak for them self.
See the positive excess return from the “Trend King” strategy returns versus a simple Bitcoin “Buy-and-Hold” strategy. Best functionality on the Daily and 4HR timeframes.
**For Access: Contact me on TradingView or Twitter.
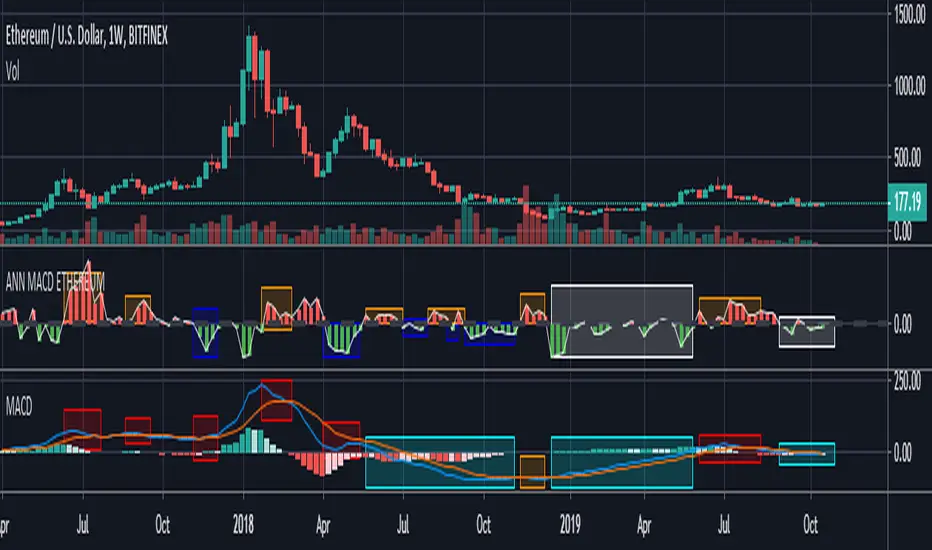
ANN MACD ETHEREUM
This script is trained with Ethereum (Timeframe : 4 hours ).
Details :
Input columns: 19
Output columns: 1
Excluded columns: 0
Training example rows: 300
Validating example rows: 0
Querying example rows: 0
Excluded example rows: 0
Duplicated example rows: 0
Input nodes connected: 19
Hidden layer 1 nodes: 8
Hidden layer 2 nodes: 1
Hidden layer 3 nodes: 0
Output nodes: 1
Learning rate: 0.7000
Momentum: 0.8000
Training error: 0.009378 ( That's a very good error coefficient. )
Many thanks to wroclai for help.
Deep learning series will continue!
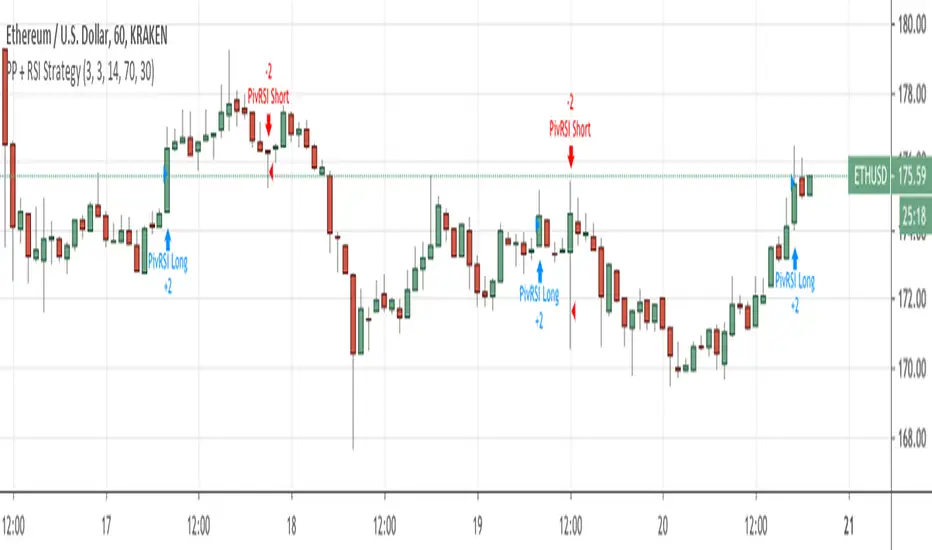
Pivot Point Reversal + RSI AlertsThese are alerts for previously published strategy:
This strategy joins the Pivot Reversal strategy with the RSI indicator.
We check RSI level at the pivot point level and only if RSI condition is satisfied we update levels for stop orders.

Pivot Point Reversal + RSI StrategyThis strategy joins the Pivot Reversal strategy with the RSI indicator.
We check RSI level at the pivot point level and only if RSI condition is satisfied we update levels for stop orders.
The strategy works pretty good for crypto, 30m, 1h, 2h timeframes.
CS Trading Bot Study - Crypto EditionWhat is this Study about?
The CS Trading Bot Study is for getting Open Long (Buy) and Close Long signals (Sell) that you can use to get alerts in various ways (Webhooks, Emails, etc).
The Study is very profitable for a vast amount of Crypto assets and the algorithm behind is not overfitted.
How to use it?
Make sure to start your research and find your favorite Crypto assets using the corresponding strategy:
The research process is very important as you can see beforehand how well the alerts for this Study would perform.
Make sure to read the Strategy's description, as well!
After you found your Crypto assets of interest using the corresponding Strategy...
Open a new chart for each asset and add the Study from your favorite indicators.
Click on the alert symbol on your chart and from "Condition" choose the "CS Bot" Strategy.
Then below choose "CS Bot Buy Alert" and "CS Bot Sell Alert" (each separate alerts).
Under "options" check "Once per bar" (very important) .
Pick your desired way of getting the alerts (app, popup, email, webhook).
The webhooks for setting alerts are very interesting as you can forward your signals to your own trading bot or simply wait until my trading bot is available (currently in development)
Since I develop myself, rest assured it will be available soon. Look out for comments below as soon as it is available!
How to access?
If you are interested to get access to the complete package, please don't hesitate to send me a private message for a quote.
The amount of concurrent users using the package (=licenses) is limited to max. 500 a month (more we cannot manually handle has Tradingview has no automation for this yet).
Access to the bot package is based on a monthly basis. If you get access, you will asked in person at the end of the month if you want to continue or not.
The monthly fee depends on the demand, but for as long as you continue using the package your initial price stays the same!

Express XYZExpress XYZ allows you to set the parameters that best fit your needs.
You can select the range of candles you want the indicator to lock in on.
You can select if you want more or less signals to appear on the indicator to fit your trading style.
You can set alerts for buy/sell which is labeled as BULL (buy) and BEAR (sell).
Enjoy the experience to customize the Express XYZ to fit your needs!

Crypto Multi Exchange Volume (CMEV)Crypto Multi Exchange Volume (CMEV) aggregates and plots trading volumes for supported cryptoasset pairs over multiple different cryptoasset exchanges. For developers looking for more information and for those who want to compile their own version of CMEV, please check out my GitHub (jakobpredin/crypto-multi-exchange-volume).
Configuration
CMEV comes with two configurable settings - whether base volume or quote volume is plotted and the length of the volume's EMA. By default, the base volume is used for plotting and the length of the EMA is set to 12 periods.
Use cases
The indicator was primarily developed in order to be able to chart using the trading pair with the longest available trading history. Due to the fast-changing preferences of where cryptoassets are traded, volumes tend to be very inconsistent and can give a distorted picture of a pairs history. For illustration, check out the SC-BTC pair from Poloniex using their native volume and compare it to the CMEV volume.
The other use case is to be able to spot divergences in volume. A great example here is bitcoin's 2019 rally where volumes from derivatives exchanges are at all time highs but volumes from retail/spot exchanges are not.
Supported exchanges
CMEV currently supports asset pairs from the following exchanges:
Binance
Bitfinex
Bitstamp
Bittrex
Coinbase
Gemini
Kraken
Poloniex
Limitations
Because of the fact that CMEV is pulling data from from multiple different exchanges and is computationally intensive it can take a couple of seconds to load while charting certain cryptoasset pairs.
Additionally, due to Tradingview's various limitations only a certain number of pairs can be supported at a time. By default, only pairs with a BTC or USD quote are supported and many non-unique pairs with consistently low trading volumes have been removed. For a full explanation, please refer to the docs in my GitHub (jakobpredin/crypto-multi-exchange-volume).
Future of the project
I plan on supporting pairs from more exchanges in the future as I see fit and as they become available for charting on Tradingview. Further, I may develop a strategy script using CMEV as its core indicator.
I welcome everybody from the community to help me extend the functionality of CMEV in order to make investing in cryptoassets more transparent for everybody.

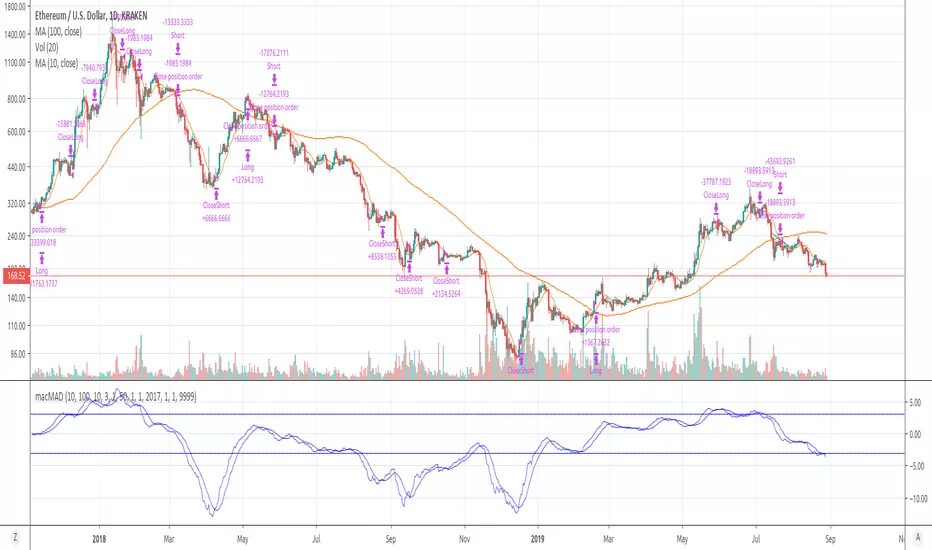
[macMAD] Free crypto strategy that just works How to actually make money on crypto?
Not complicating your strategy (it causes overfitting)
Trade long term (price movement behaves less random on larger scales)
Contact me and I'll help you automate this strategy!
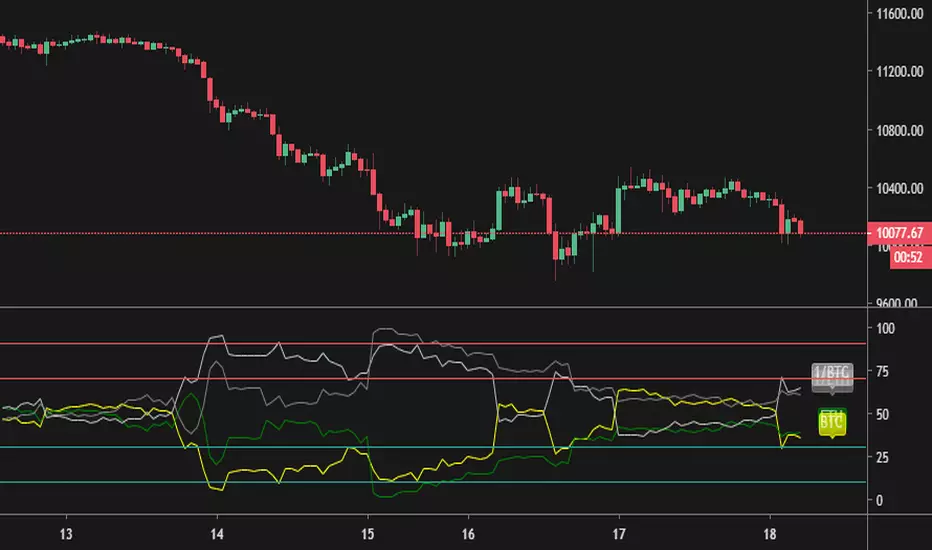
Various Volume RSI (BTC vs ETH) [mushoku]RSI to show btc and eth fight(BINANCE)
Binance(バイナンス) のBTCとETHを同時に表示する RSI です。
無料で使用できます。
こちらでも簡単ですが紹介しています。
note.mu
Bar RatioBar Ratio is an indicator tool that provides real-time likelihood of the current bar closing up or down (green or red).
Technical status, volatility and time are key elements in this indicator.
From the open of a bar, a ratio of 50% is assumed before changes from factors are considered.
The factors that change the likelihood of a bar closing up or down and their relative weight are listed below.
Micro-Trend observed over the last 20 bars - up to 2.5%
Macro-Trend observed over the last 70 bars - up to 2.5%
Current bar price against beginning of Micro-Trend - up to 2.5%
Combination of significant change above average volatility and move against direction of Micro-Trend - up to 2.5%
Combination of significant change above average volatility and move against direction of Macro-Trend - up to 2.5%
Previous bar direction up to 10 consecutive bars - up to 3.75%
Current status of bar (higher or lower) - up to 3.75%
Significance of change against average volatility - up to 5%
Time until bar close - up to 25%
Total: 100%
If all factors are synchronised, the likelihood of the bar closing up or down can be indicated at a probability of 100%.
While the practical ability for this to be used for trading is limited, the tool can be useful for choosing when it is safe to open a trade.
Time is a key element as the likelihood of the bar remaining at current status by the close of the bar is constantly increasing.
The accuracy of this tool is incredible and should be noted as it's primary trait.
You can find and use this indicator on any time-stamp or security such as Cryptocurrency, Forex, Stocks or Indices.
The Bar Ratio can be located by searching in your public indicator library at the top of your chart and adding it to your screen.

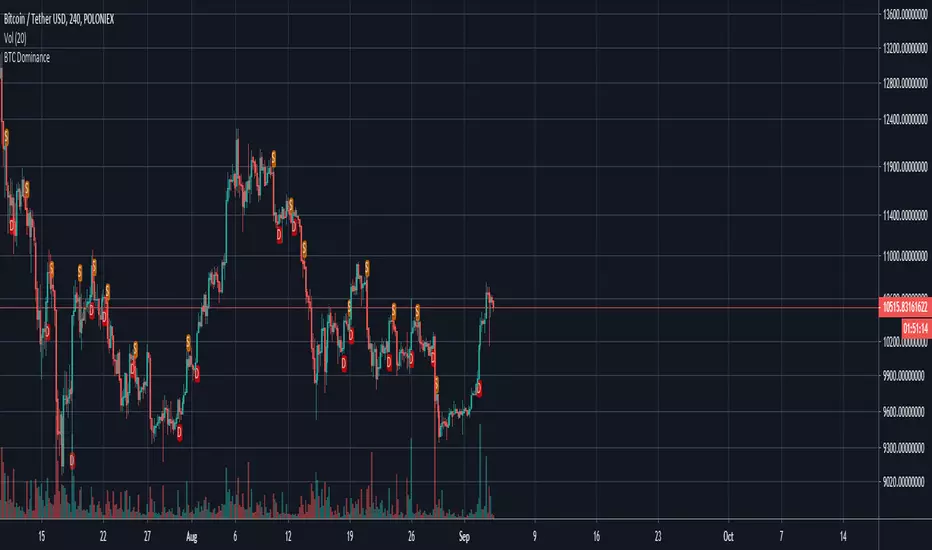
BTC Dominance IndicatorThis script calculates the BTC dominance and adds markers as overlays on top of your crypto chart.
A red "D" means "BTC dominating" and an orange "S" means "BTC submissive". In both cases further price actions are imminent.
You can use this script for any crypto asset to see how it performs while btc is dominating.
If you are for example trading a BTC paired asset, then this can give you a warning if BTC starts to dominate (BTC paired assets tend to dump if BTC dominates).
On the other hand, you can use this as signal on USD paired cryptos if BTC dominates as USD paired cryptos tend to go with BTC.
It is recommended to use additional indicators with this as it is not meant as buy/sell signalling tool.


DBT MoMo v.4DBT MOMO
Introduction: The MoMo is a TradingView indicator designed to evaluate momentum and give the user signals according to momentum shifts, strength, extensions, traps, and divergence. It’s an all in one oscillator that will make reading price action near term and long term much easier.
Part One: Strength
The MoMo consist of two major parts. A 3-candle back formula and a 24-candle back formula. The 3-candle back is called the Price Line (the histogram on the MoMo). The 24-candle back is called the Trend Line (the line on the MoMo). Both lines are placed into a range from 20 to -20. It can go higher than 20 or lower than -20, but this is extremely rare and short lived.
A positive number indicates a bullish bias, a negative number indicates a bearish bias. When the Price or Trend line are ascending while below 0 this indicates that the bearish momentum is weakening. When the Price or Trend line are descending while above 0 this indicates that the bullish momentum is weakening.
In a strong trend the Trend Line will likely flatten out around 15 or -15. While the Trend Line is flat the Price Line will likely shift rapidly, this can lead to bull and bear traps, we will discuss this in the Trap section.
A rare, but powerful signal from the MoMo is when the Price and Trend Lines “pinch” and begin to move in the same direction. If this is happening the trader should be looking to follow the direction of these lines.
Part Two: Extensions
When both Price and Trend Lines are above 10 or below -10 this will begin to signal an extension.
Purple: Indicates the bears are extended to the downside and a pullback or trend reversal upward is likely.
Gold: Indicates the bulls are extended to the upside and a pullback or trend reversal downward is likely.
When only the Trend Line is above 10 the MoMo will shade the upper range red. This indicates the Trend is becoming bullish or entering an extension. If the Trend Line cannot maintain above 10 for long and breaks below 10 this indicates it’s an extension and trend will most likely continue downward.
When only the Trend Line is below -10 the MoMo will shade the upper range green. This indicates the Trend is becoming bearish or entering an extension. If the Trend Line cannot maintain below -10 for long and breaks above -10 this indicates it’s an extension and trend will most likely continue upward.
When the green or purple shading have turned off take the lowest point, this is considered a support level or a local bottom.
When the red or gold shading have turned off take the highest point, this is considered a resistance level or a local top.
The trader can preemptively trade the purple or gold warnings but be warned these warnings can go on for a long time if the trend is very strong. It is the same mentality of an overbought or oversold RSI, except the MoMo extensions have a much higher strike rate.
To avoid preemptively trading these extensions the trader should wait for confirmation on the Price Line and on price action. The Price Line (histogram) should be moving upward during a purple extension to begin showing a bottom. The Price Line (histogram) should be moving downward during the gold extension to begin showing a top.
Part Three: Traps
The relation between the Price Line and Trend Line can create trading signals for bull and bear traps. When the Trend Line is flattened out around 15 or -15, indicating a strong trend is in place, and the Price Line is rapidly moving towards the midline this may indicate a trap is forming.
When the Trend Line is flat around 15 and the Price Line begins moving towards 0, if the Price Line reaches 0 or close to 0 and the Trend Line is still flat, a trap has begone. Once the Price Line shifts from decreasing (red) to increasing (green) the trap is playing out. Therefore, the trader should look to exit short positions or enter long positions.
When the Trend Line is flat around -15 and the Price Line begins moving towards 0, if the Price Line reaches 0 or close to 0 and the Trend Line is still flat, a trap has begone. Once the Price Line shifts from increasing (green) to decreasing (red) the trap is playing out. Therefore, the trader should look to exit long positions or enter short positions.
Part Four: Divergences
The MoMo is exceptional at finding divergences with the Price Line and occasionally the Trend Line.
To find a divergence with the MoMo the trader must look for when the histogram is not following price action completely.
Bullish Divergence: Price makes a lower low, MoMo makes a higher low.
Bearish Divergence: Price makes a higher high, MoMo makes a lower high.
Hidden Bull Divergence: Price makes a higher low, MoMo makes a lower low.
Hidden Bear Divergence: Price makes a lower high, MoMo makes a higher high.
For Access or Questions: Private message us. Thank you.

OBV StochasticsThis indicator uses both a standard Stochastic Oscillator based on security prices and stochastically oscillated OBV values.
Explanation:
Stochastics measure momentum by comparing the current closing price to its lowest and highest price over a user-defined window of n periods. Without going too in depth, traders can view the K value as the current value for the stochastic indicator and the D value as a Simple Moving Average of K values. Users can adjust the length of that Simple Moving Average through modifying the smooth D parameter in the input option menu.
Traders can also define the upper and lower bounds for both sets of K and D values. These are plotted on the graph as the horizontal red (upper) line and horizontal green (lower) line. Generally, the upper line is viewed as the threshold at which a security can be considered overBought. Conversely, the lower green line is the threshold at which they can be viewed as overSold.
OBV, or On-Balance Volume, is a versatile momentum indicator that we discussed in our OBV Z-Scores open-source script. That is a good place to look if you're looking to gain a better understanding of the OBV indicator. By applying the stochastic formula to the OBV, it allows us to gain a better understanding of the current OBV value relative to its historical data and display the OBV in a {0.100} bounded range of values.
Plotting the standard price-based Stoch. K and D in combination with the Stoch. OBV K and D can help identify divergences and track the progression and direction of trends. For example, you can see that when the two move in opposite directions or when one significantly outpaces the other, it often hints towards an impending reversal.
The Graph:
As mentioned the upper and lower overbought and oversold thresholds can be adjusted by the trader and are plotted on the graph in red and green.
The green oscillating line represents the Stoch. K of OBV values, while the red line symbolizes the OBV D values.
The teal line is the standard Stoch. K and the orange line is the standard Stoch. D.
Users have two options for background highlights. The first option is to use green highlights to show entry signals and red highlights to show exit signals. These signals are based on the criteria we have set for identifying optimal entry and exit points. This is shown in the second pane.
The second option is to plot red highlights whenever Stoch. OBV K crosses the upper bound and green highlights whenever it crosses the lower bound. This is shown in the bottom pane. NOTE: Choosing this option means that signals will not be displayed in sequential entry-exit order (instead this is a good option if traders only want to identify when the security is overbought or oversold).
Input Options:
Traders can adjust the respective smooth K and smooth D values for both the standard stoch. and OBV stoch. Additionally, the lookback window length can be adjusted as well as the upper and lower bounds(in addition to the display options shown above).
Alerts:
Indicator sends alerts when entry and exit conditions are met, as well as alerts to inform traders when overbought/oversold conditions are met. Alerts can be tailored for GunBot / other automated trading platforms upon request.
~Happy Trading~
